Experimental investigation of regular wave propagation over an idealized reef model *
2020-06-03GanchengZhuBingRenHongjieWenGuoyuWangYongxueWang
Gan-cheng Zhu, Bing Ren, Hong-jie Wen, Guo-yu Wang, Yong-xue Wang
State Key Laboratory of Coastal and Offshore Engineering, Dalian University of Technology, Dalian 116024,China
Abstract: The wave transformation over the deep-sea coral reefs is an essential issue in the analysis of the reef ecosystem and the design of large reef-top structures. Extensive wave flume experiments are conducted to investigate the wave transformation processes over an idealized reef model. Detailed measurements of the wave height, the wave set-up and the wave-generated flow on the reef-top are made with and without the reef-top structure at various submerged depths and under different wave conditions. It is found that the reef-top structure has a significant influence on the wave breaking, the wave set-up and the wave-generated flow. The wave set-up increases with the increasing wave height and the decreasing submergence depth. However, the relationship between the wave set-up and the wave period is complex, influenced by the reef-top structure.
Key words: Coral reef, wave set-up, reef-top structure, wave breaking, wave-generated flow
Introduction
The topography of the coral reefs in many tropical regions is much different from the traditional mild slope of the coastal zone. The reef-face is usually very steep with a very deep water in front of the reef.The water depth changes rapidly from the deep water in front of the reef to the shallow water on the reef-top.The wave breaking at the shallow water zone dissipates most portion of the incident wave energy and results in a much smaller wave height than that in the deeper water part of the reef. A favourable condition is found for the construction of marine structures and facilities on the reef top flats including the ports, the weather stations, the navigation-aids and the artificial islands[1]. However, some extensive damage was occasionally reported in the low-lying coastal areas fronted by coral reefs during storms.Some field observations show that the wave breaking on the fore reefs can raise the water level on the reef flat. The rise of the water level, known as the wave set-up, is a common phenomenon when a wave propagates over a sloping beach[2-4]or a submerged breakwater[5-6], in which cases, it may be significant determining the water levels on the coral reefs particularly in micro tidal environments. A strong current generated by the water level gradient over the reef flat usually leaves the reef flats through channels at the end of the reefs[7]. The wave-generated flows are responsible for the cross-reef transport of the sediment and the dispersion of the nutrients, and they are also significantly enhanced by oscillatory waves[8].While the hydrodynamic characteristics of the coral reef can be greatly influenced by the reef-top structures, especially the large-scale structures such as the artificial island, the changes of the terrain of the coral reef can also threaten the security and the stability of the reef-top structures. The studies of these processes require an accurate prediction of the wave transformation characteristics with and without the presence of the reef-top structures.
Since the 1950s, a series of field observations were made on the Pacific coral reefs. The water level on the Bikini Atoll was early found to be 0.45 m to 0.60 m higher than the surrounding sea level. The wave set-up on the reef is found to increase with the increase of the wave height and the decrease of the water level over the reef. Jago et al.[9]measured the wave set-up across the reef-top at Lady Elliot Island and found that the magnitude of the wave set-up varied both temporally and spatially across the reef.
Several physical model experiments were conducted to investigate the processes of the wave breaking and the wave attenuation on the coral reefs.The breaking wave height, the breaking type and the surf-zone width were studied. Several empirical formulas of the wave attenuation were proposed based on experimental data[10-11]. The maximum ratio 0.55 of the stable wave height to the depth on the horizontal reef-top is often used to calculate the stable wave height on the reef-top. Gourlay[12-13]contrasted the experimental results of previous studies and summarized the variations of the wave set-up and the wave-generated flow. In view of the complexity of the real reef, more complex physical models were adopted in recent years to simulate the effects of the reef crest[14], the roughness surface[15-17]and the canopy flow[18].
Based on the field observations and a physical model, by using the radiation stress theory, the analytical solutions of the wave setup over the fringing reef with gentle reef-face were obtained by Tait[19], Becker and Merrifield[20]. However, as the reef-face can be very steep or even in the vertical direction, the wave reflection induced by the reef-face must be taken into account. In consideration of these effects, a theoretical relationship between the set-up and the submergence depth on the reef-top was obtained by Gourlay[13]based on the conservation of the wave energy flux for the fringing reef with a steep slope of 1:1. For both platform reef and barrier reef it is usually assumed that the wave set-up reaches a maximum value near the reef-edge and the water level at the downstream side of the reef is the same as that on the seaward side of the surf zone[21]. But for the platform reef with a steep reef-face, most portion of the surf zone may locate on the reef-top, therefore, the above assumption is not valid. Accordingly, Gourlay and Colleter[7]distinguish the wave-generated flow into two basic reef-top flow regimes: the reef-top control regime and the reef-rim control regime, Yao et al.[22]also used a semi-analytical quasi-2DH model to calculate the wave set-up and the wave-generated flow in a reef-lagoon-channel system.
All these previous researches indicate that the mean water-level setup on the reef flat depends primarily on the wave height, the wave period and the still-water depth over the reef flat. With all other factors being the same, the wave set-up increases and the wave-generated flow decreases with the decrease of the tide levels. The magnitude of the wave set-up on a fringing reef without a net flow is more than that on a platform reef with the wave-generated flow across the reef. Most of the previous research results including the experimental and analytical results show that the wave setup on the reef flat increases with the increase of the wave height and the wave period.However, Gourlay[12]found a more complex relationship that the wave set-up increases with the increase of the incident wave period up to a certain value, above which the set-up basically remains constant. In Gourlay’s[12]tests, this certain value of the wave period is 1.5 s.
Because of the limitations of the experimental facilities, the previous experiments focused mainly on the water waves in a limited depth, which are quite different from the deep water wave while approaching the coral reefs. Moreover, the influences of the building structures on the hydrodynamic characteristic of the coral reefs are an essential issue for the safety and the stability of the structures. In order to investigate the wave transformation characteristics over the deep-sea coral reefs and also the influence of the structures on the reef tops, especially the complex relationship between the wave setup and the wave period, a two-dimensional laboratory experiments are carried out. The effects of various factors including the incident wave height, the wave period and the water depth on the wave heights and the set-up over the reef-top are investigated. The changes of the hydrodynamic characteristics of the coral reefs after structures being built on the reef tops are studied.
The paper is organized as follows: after the introduction, the experimental setup is introduced in section 1, the experimental results of the wave transmission over the coral reef is presented in section 2, the hydrodynamic changes after reef-top structures being built are presented in section 3, the main conclusions are summarized in the final section.
1. Experiment setup
Laboratory experiments are carried out under two different conditions corresponding to the cases with and without a vertical-wall structure on the reef flat, in the State Key Laboratory of Coastal and Offshore Engineering, Dalian University of Technology, Dalian. The flume is 60.0 m long, 4.0 m wide and 2.5 m depth. A piston-type wave generator driven by an electro-hydraulic servo system is installed at one end of the flume. The range of the generated wave period is from 0.5 s to 5.0 s. At the other end of the flume, a 12 m long wave energy dissipation device is placed to absorb the wave energy.In order to reduce the effect of the reflected waves from the structure model, a waterproof plate (13.2 m long) is used to separate the flume into two parts. The reef model is placed in a part of 1 m wide.
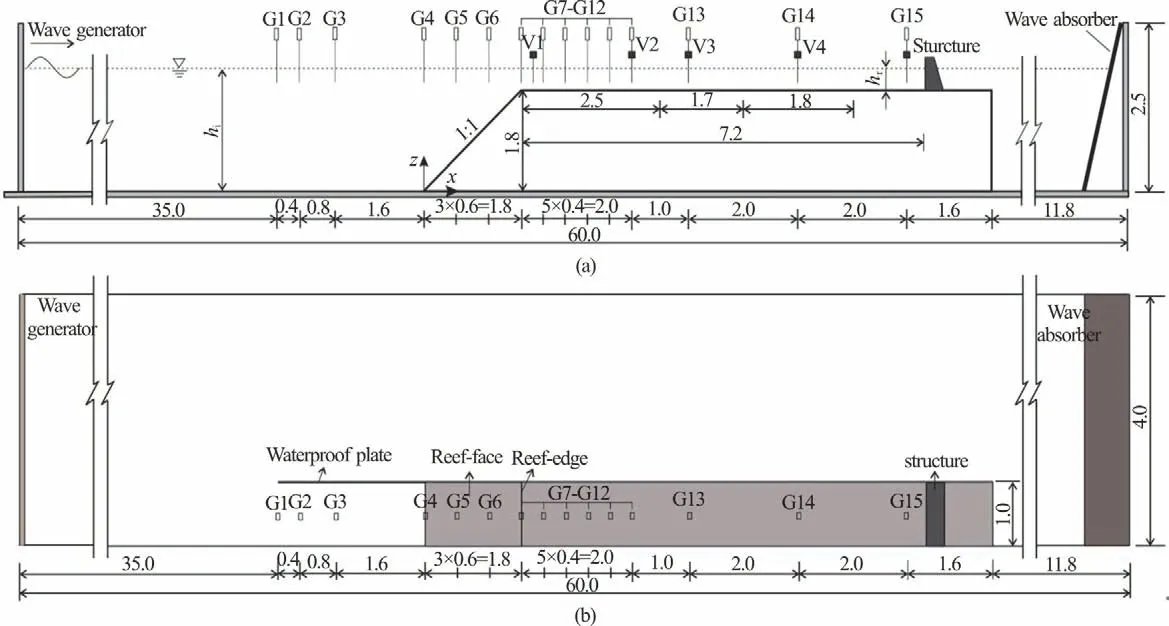
Fig. 1 The reef profile and measuring instrument arrangement (m)

Table 1 Wave conditions in the tests
According to the common characteristics of the reef profiles and the structures in South China Sea, an idealized two-dimensional coral reef model is designed in this experiment, as shown in Fig. 1. A model scale of 1:25 is used in the design of the reef model and the wave conditions based on the gravity similarity. The idealized reef model consists of a steep reef-face with a slope of 1:1 and a horizontal reef-top of 8.600 m long. The reef-face and the reef-top are finished to be smooth surfaces, and the bottom friction can be neglected in the test. The vertical-wall structure on the reef-top is 7.200 m away from the reef-edge.The height of the vertical-wall structure is 0.272 m,high enough to avoid overtopping under the incident wave conditions.
Fifteen capacitance-type wave gauges (TWG-600,made in Japan) and five high-resolution acoustic velocity meters (Vectrino, made in Norway) are installed to measure the wave surface elevation and the wave-generated flow. The measurement accuracy of the wave gauge is ±0.1 mm. The measurement accuracy of the velocity meter is ±0.5% of the measured value. The sampling rate of 50 Hz is used for all wave gauges and velocity meters. Measuring points G1-G3 are placed in front of the coral reef,G4-G6 are placed on the slope to measure the wave shoaling, G7-G12 are placed on the reef-top to measure the wave breaking in the surf zone, G13-G15 are put in the middle and the end of the reef-top to record the waves after breaking, V1-V5 are placed on the reef-top to measure the wave-generated flow. The measuring point V1 on the reef edge is located on the surface of the reef to reduce the disturbance of the wave breaking. The measuring points V2-V5 are placed at the elevation of 0.5 times of the static water level.
The test conditions are listed in Table 1. Each test is repeated at least 3 times. The incident waves in this experiment are the deep water waves when the wave period T=1.00 s, 1.25 s or 1.50 s. The water depth hiin front of the coral reef is from 1.8 m to 1.9 m. The height of the reef model is 1.80 m. The still water depthrh on the reef-top is from 0 m to 0.1 m.
2. Experimental results of the platform reef
2.1 Wave propagation and wave breaking
When the waves propagate onto the reef-face, the wave heights increase rapidly due to the wave shoaling and reflection, then the waves break on the reef-face, the reef-edge or the reef-top and propagate over the reef-top as a succession of bores, as shown in Fig. 2(a). By locating the wave breaking point in this experiment, it is found that the waves break on the reef-face when the water depth on the reef-top is small(hr=0 m, 0.02 m), while the waves mainly break on the reef-top when the water depth increases (hr=0.05 m, 0.10 m). The pictures of the wave breaking on the reef-top and on the reef-face are shown in Figs.2(b), 2(c) and Figs. 2(d), 2(e), respectively. According to Gourlay’s[12]research, the waves break on the reef-face when the relative submergence depth(ηr+hr)/Hi<0.7and the waves break on the reef-top when the relative submergence depth, where the submergence depth η is the sum of the maximum wave set-uprη and the water depth hron the reef-top. Although the water depth in Gourlay’s[12]experiment is only 0.5 m,this condition is applicable for our tests because the same slope of 1:1 is used both in Gourlay’s[12]experiment and in our tests.

2.2 Wave height, wave setup and wave-generated flow on the reef-top
The wave height H and the wave set-upη are calculated using the time series of the wave surface elevations. The wave set-up η is the average of the mean water level of ten wave periods and the wave height H is the average of the wave heights in ten wave periods. The mean velocity V is the average of the velocity measured by the velocity meter. The distribution of the relative wave height H /Hiunder different wave conditions are plotted in Figs. 3(a1)-3(a3). Unlike a gentle slope, the steep reef-face in this experiment can induce considerable wave reflections. It can be seen that the wave heights in front of the reef and on the reef-face have an obvious variation in x direction due to the superposition of the incident waves and the reflected waves. The superposed wave heights at the same wave gauges are different for different wave periods because the phases of the reflected waves are different for different incident wave periods and the shoaling effects also differ for different wave periods. As shown in Fig. 3(a2), the wave heights at G4, G5 and G6 have maximum values when T = 1.75 s ,T = 1.50 s and T = 2.00 s , respectively. In most test cases of ours, the wave heights on the reef-edge have the maximum values when T = 1.75 s .
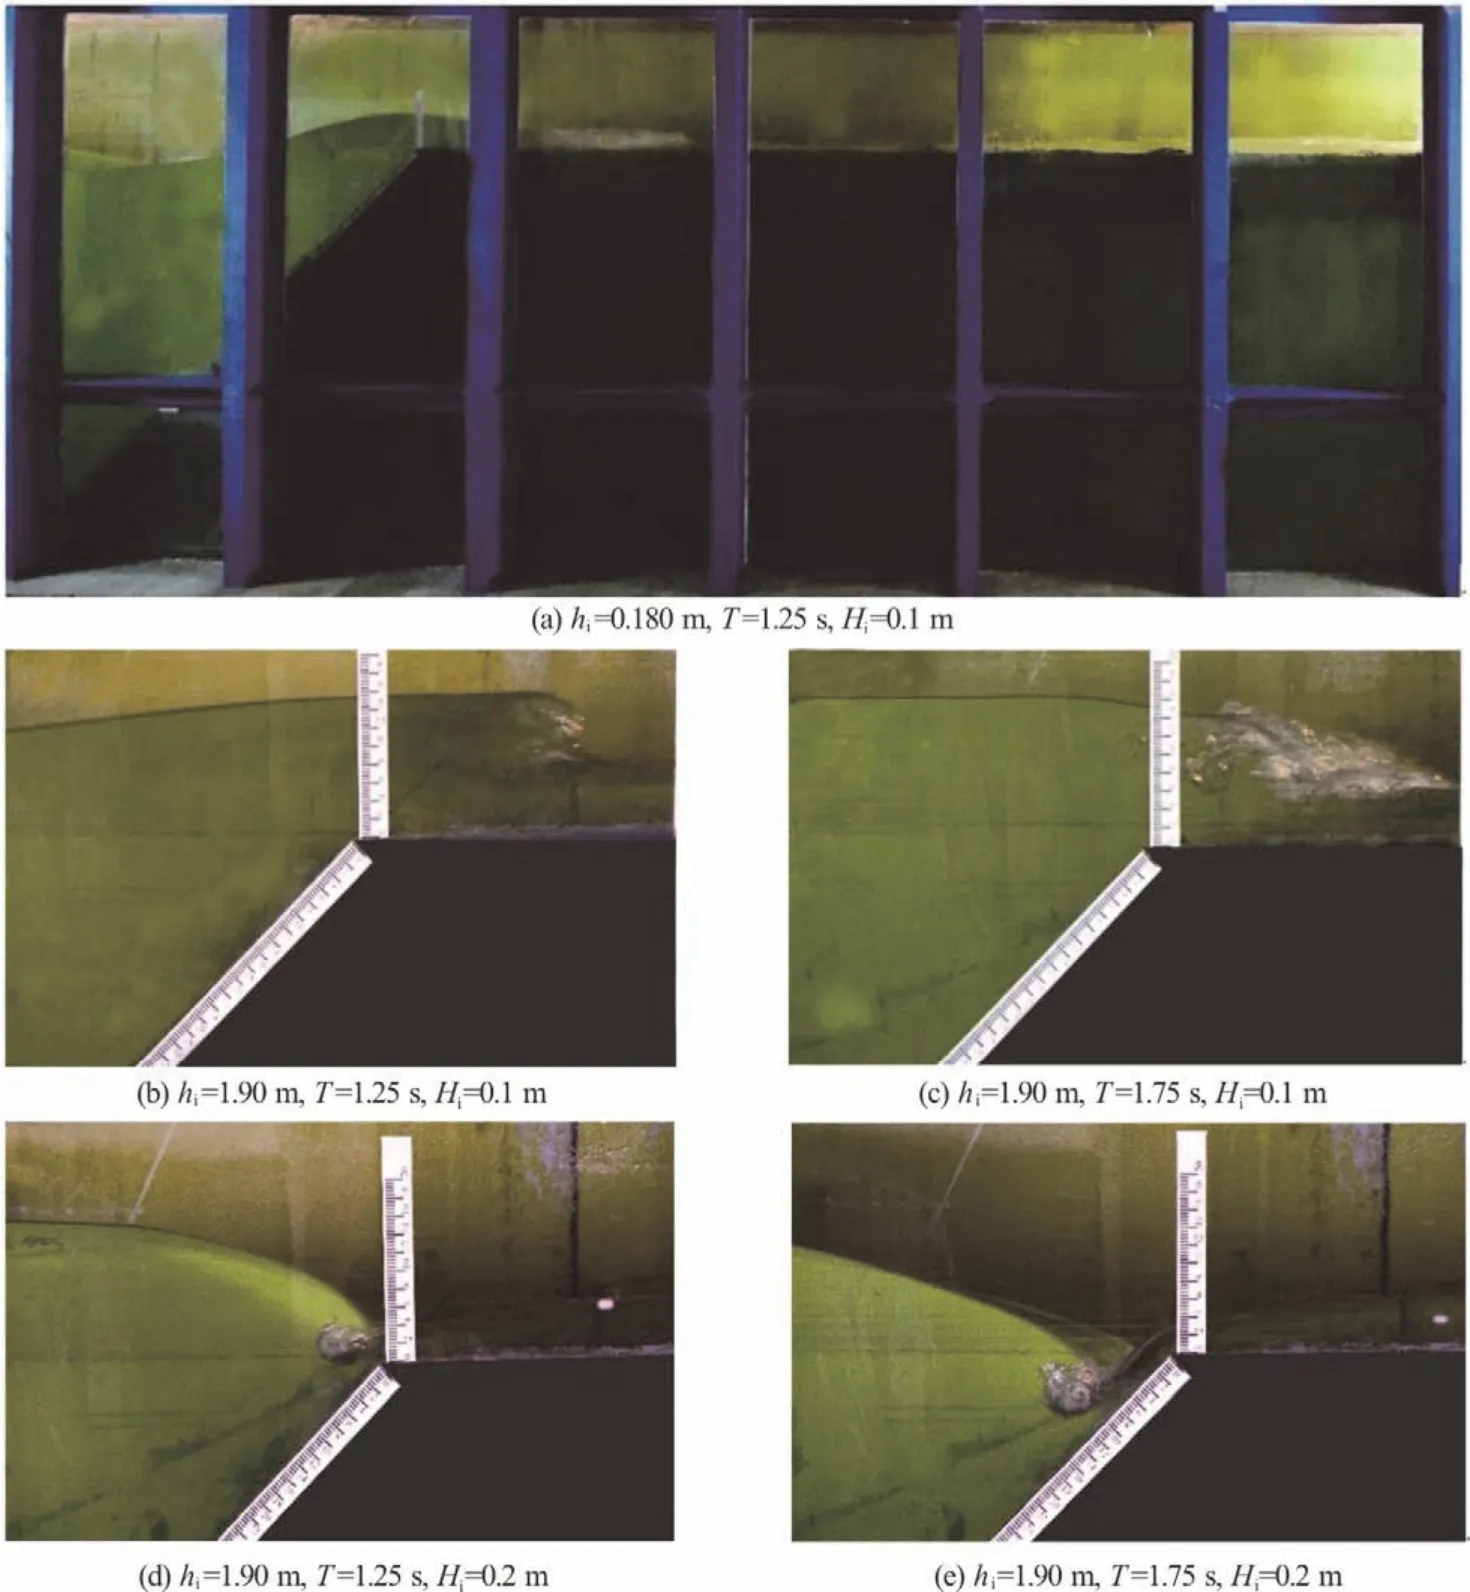
Fig. 2 (Color online) Wave propagations and wave breakings over the reef-top
As the water depth decreases, the wave surfaces become much asymmetric and assume a saw-toothed shape due to the wave shoaling. The wave fronts are very steep and the waves break violently. The wave height decreases rapidly due to the wave breaking.After the waves pass through the surf zone, they propagate as a succession of bores with stable wave heights, controlled by the submergence depth on the reef-top. The wave height away from the surf zone is basically less than 0.5Hiin our experiment.
Figures 3(b1)-3(b3) show the distributions of the mean water level along the platform reef. When the water depth is small (hr=0 m or 0.02 m), the waves break mainly on the reef-face and pass through the reef-edge like overtopping, with a higher mean water level at G7 than surrounding the measuring points.Then the wave height decreases and the wave set-up increases to its maximum within about one wave length. When the water depth on the reef-top is large especially when r h = 0.10 m , the waves break mainly on the reef-top, even a set-down can be observed at G7. Figures 3(c1)-3(c3) show the distributions of the mean velocity along the platform reef. When the water depth hr on the reef-top is 0 m or 0.02 m, the water is too shallow for the velocity meter to work properly.Therefore, the velocity of the wave-generated flow is only measured when r h = 0.05 m, 0.10 m, so the relationship between the mean velocity and the water depth hr can not be adequately determined. As shown in Fig. 3(c2), the mean velocity takes the maximum value when T = 2.00 s . The wave-generated flow on the reef-top can induce the offshore-directed bottom stress, with a decrease of the wave set-up along the reef-top[21]. Although the reef surface is smooth in our experiment, a small decrease of the wave set-up at the end of the reef-top can also be observed. As a result of the decreasing submergence depth, the mean velocity increases at the end of the reef.
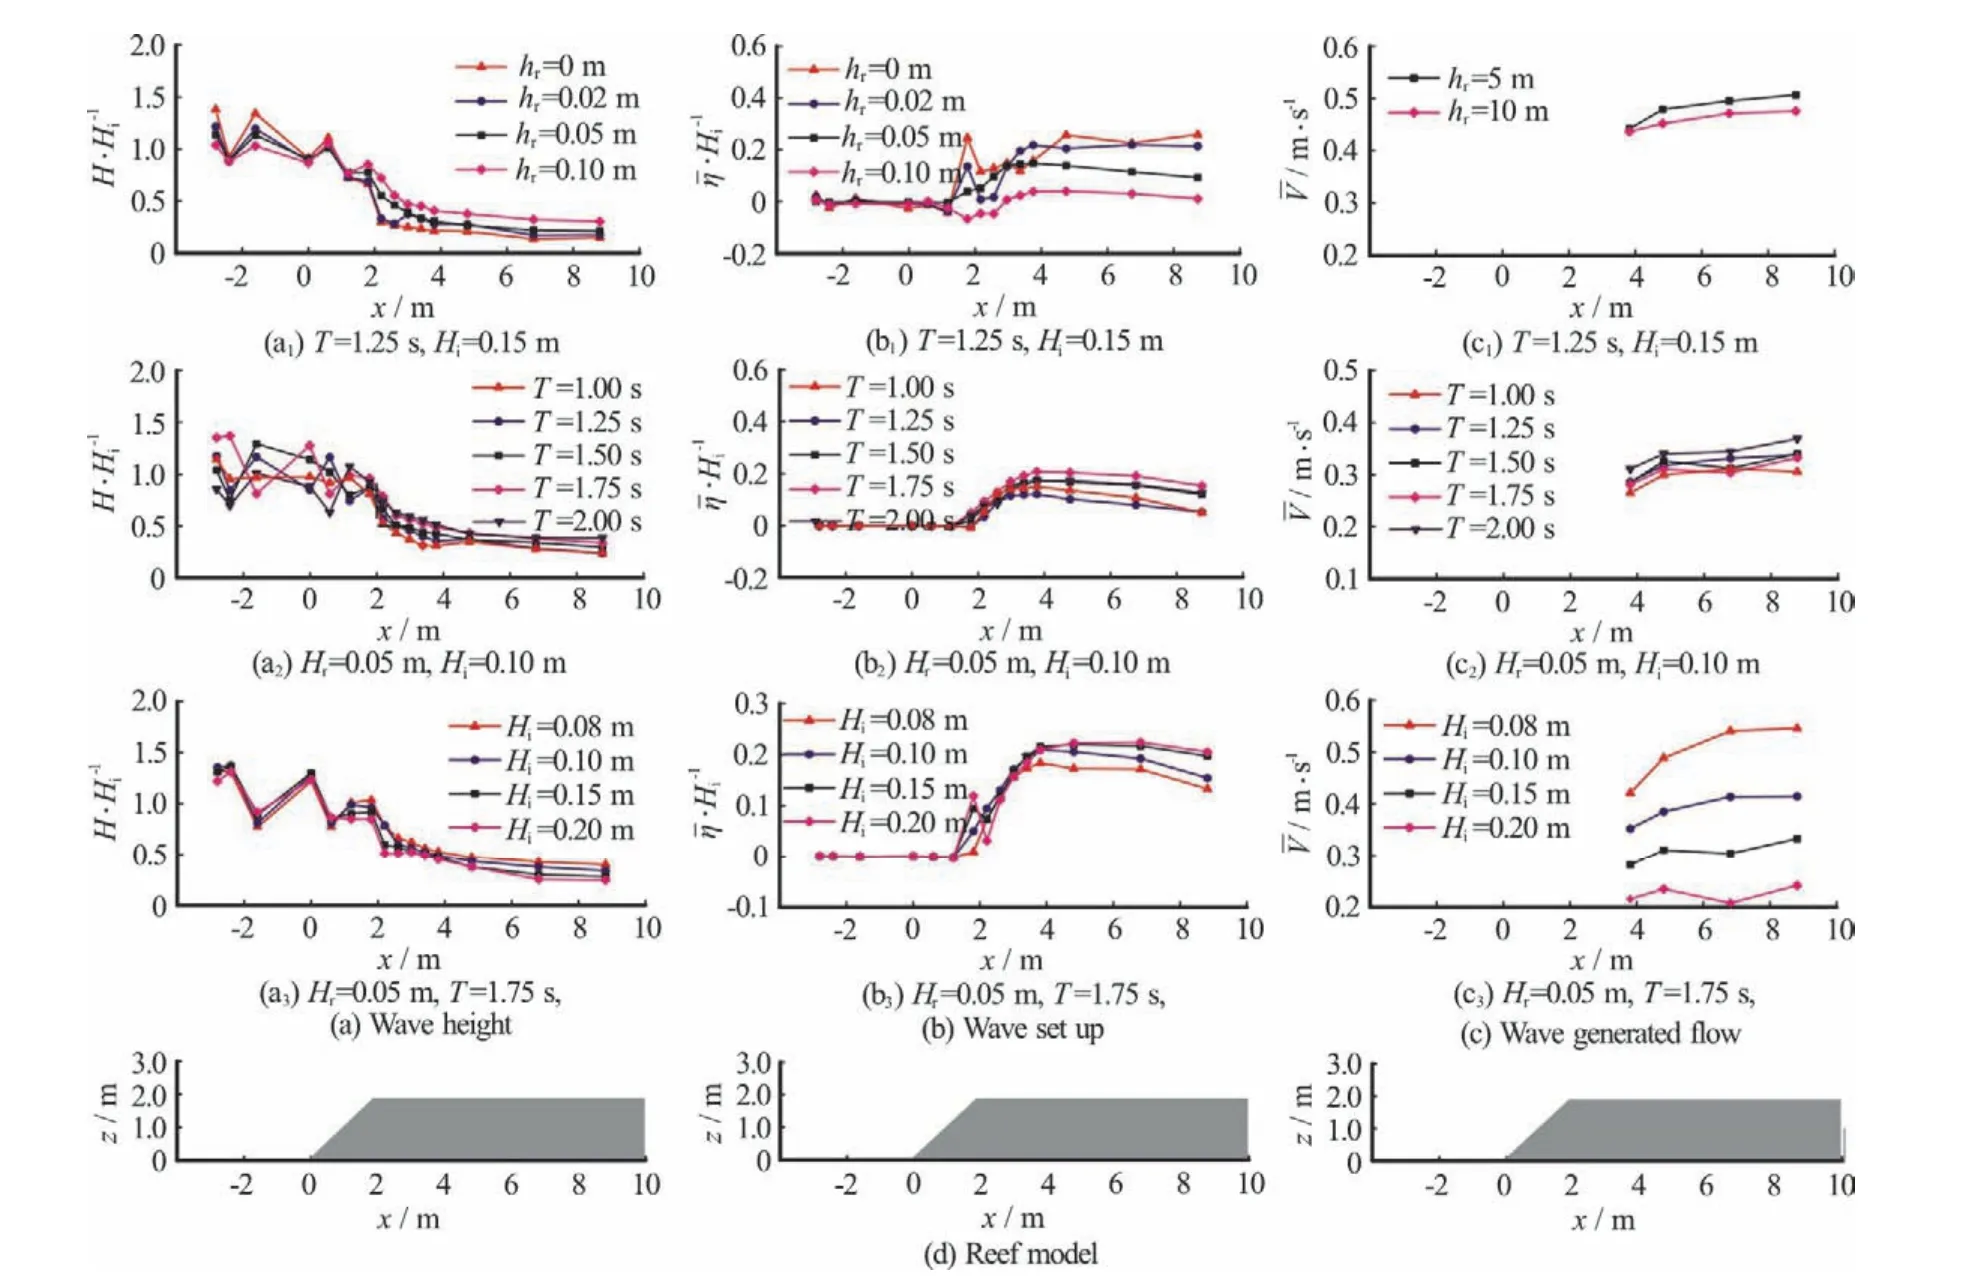
Fig. 3 (Color online) Distributions of wave height, wave set-up and wave-generated flow along the reef model under various wave conditions

Fig. 4 (Color online) Wave set-up as functions of incident wave period for the platform reef
The variation of the maximum wave set-up on the reef-top against the wave period is complex.Figure 4 shows that the maximum set-up is reached at about 1.75 s. It is known that the wave set-up on the reef-top increases with the wave power or the energy flux, proportional to the wave height when the wave breaks. The actual wave height at the breaking point is the sum of those of the incident wave and the reflected wave. In our experiment, in the case of T=1.75 s ,the wave height is the largest when it breaks and as a result the wave setup reaches its maximum value at T=1.75 s . Based on Gourlay’s[12]research, for a platform reef, the wave set-up increases with the increase of the incident wave period until a maximum value is reached at about 1.50 s. Compared with our experiments, although with the same slope of the reef-face, the water depth hiin Gourlay’s[12]experiment is different from ours, the wave shoaling effect and the interaction between the waves and the reef are also different. Therefore, the maximum setup in Gourlay’s[12]research occurs at =1.75 s
T.
3. Influence of the vertical-wall structure
3.1 Influence on wave-generated flow
The wave-generated flow is driven by the wave breaking and the pressure gradient due to the wave set-up. Because the platform reefs are surrounded by the sea, the water on the reef-top can escape over the leeward edge of the platform reef to develop wavegenerated flows. The vertical-wall structure built on the reef-top acts as a fringing reef without any net flow. The flow channel from the exposed side of the reef to the sheltered side is blocked by the vertical-wall structure, the water on the reef-top can only escape from the reef-edge. Figure 5 shows the changes in the wave-generated flow after the vertical-wall structure being built. As expected, after the vertical-wall structure being built on the reef-top,the mean velocity in the middle and the end of the reef-top (V3-V4 in Fig. 5) is close to zero.
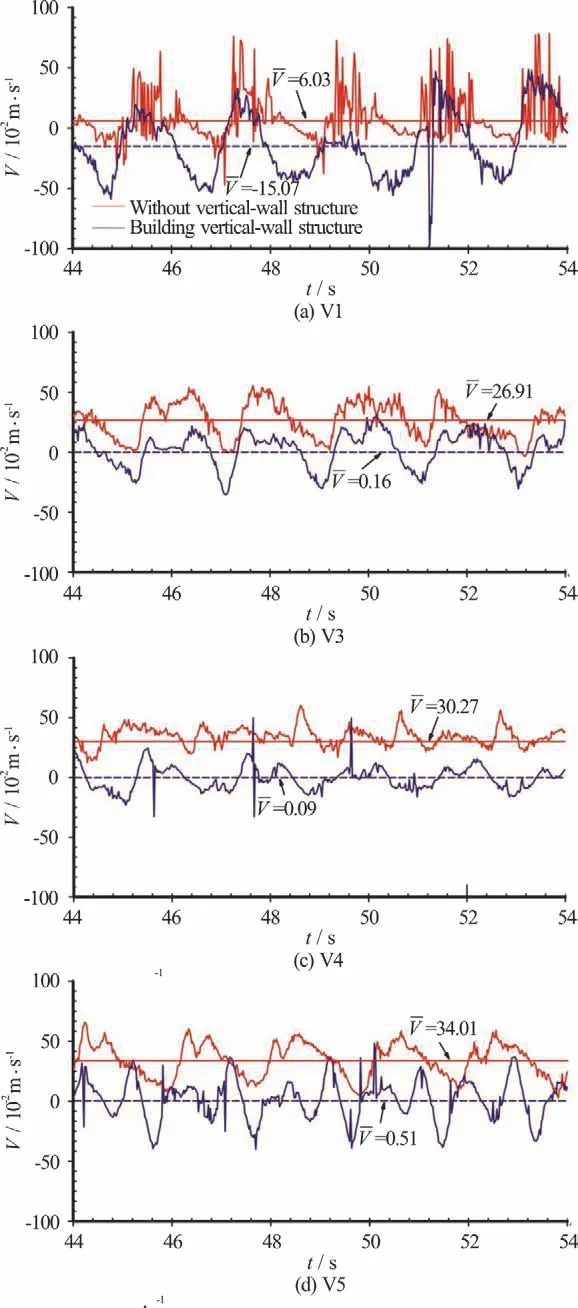
Fig. 5 (Color online) Time series of the flow velocity at the measuring points (hr=1.90 m, T=1.50 s, Hi=0.10 m)
The water bubbles induced by the wave breaking can disturb the measurement accuracy of the velocity meter. In order to reduce the influence of the water bubbles, the measuring point V1 is set on the bottom of the reef-edge. As shown in Fig. 5, after the vertical-wall structure being built, there is a near-bottom backflow towards the seaside over the surface of the reef-edge especially when the wave trough arrives at the reef-edge. Figure 6 shows the test photos of the wave breaking in both cases. It can be seen from Fig. 6 that for the platform reef without a vertical-wall structure, the waves break slightly on the reef-face and then propagate onto the reef-top. The wave-generated flow can escape over the leeward of the platform reef and no obvious backflow over the reef-edge is observed. After the vertical-wall structure is built, obvious near-bottom backflow flows downward the reef-face can be observed and they meet with the wave front when the wave trough arrives at the reef-edge. A phenomenon similar to the“wave plunging” occurs due to the near-bottom backflow. Subsequently, the incoming wave propagates against the backflow with the wave-front breaking violently. The near-bottom backflow significantly enhances the wave breaking around the reef-edge. The process of the wave-generated flow after the vertical-wall structure is built can be explained as follows: The wave-generated flow is driven by the wave breaking and the water surface gradient. The structure at the end of the reef-top blocks the flow channel and the near-bottom backflow towards the reef face is generated, the momentum exchange and the energy dissipation occur when the incoming wave meets with the near-bottom backflow,and there is nearly no net flow at the end of the reef-top.
3.2 Influence on wave surface
The time series of the wave surface elevations are plotted in Fig. 7. The wave surface in front of the reef sees the same difference after the vertical-wall structure is built. When the waves reach the vertical-wall structure, the water can not flow off the reef-top and as the result, the mean water level is raised. The rise of the water level first occurs near the vertical-wall structure. Then the rise of the water level extends towards the reef-edge. It can be seen that the mean water levels at G14, G11 and G7 see a significant rise at 24 s, 30 s and 35 s, respectively.When the rise of the water level extends to the reef-edge (t>35s), the mean wave surfaces on the reef-top are in a basically stable state. For the vertical-wall structure, the wave height and the wave set-up on the reef-top are calculated after the mean water level reaches a stable state.

Fig. 6 (Color online) Influence of near-bottom backflow on the wave breaking (hr=1.85m , T =1.50s , Hi=0.10m)
The distributions of the relative wave height H/Hiand the relative wave set-up η/Hion the reef-top are plotted in Fig. 8. After the vertical-wall structure is built, the wave set-up around the reef-edge increases rapidly due to the momentum exchange between the incoming wave and the near-bottom backflow. As the flow out of the reef-top is blocked by the reef-top structure, the wave set-up in the middle and the end of the reef-top reaches nearly a steady state. It is noticeable that after the reef-top structure is built, the distributions of the wave set-up are similar in cases of different water depths, while for the platform reef the shape of the distribution is sensitive to the water depth. The wave height sees a rapid decrease around the reef-edge due to the violent wave breaking, as shown in Fig. 8. After the vertical-wall structure is built, the wave height in the middle and the end of the reef-top sees a small fluctuation, induced by the wave reflection. Because of the greater submerged depth (ηr+hr), the waves also propagate with a larger wave height over the reef-top.

Fig. 7 (Color online) Comparison of the time series of wave surface (hr=1.80m , T=1.50s , Hi=0.20m)


Previous studies and our experiment indicate that the wave-generated flow increases with the water depth hruntil a maximum is reached on the platform reef. After the vertical-wall structure is built, the flow channel is blocked, to induce a further rise of the water surface. When the water depth is relatively small (hr≤0.05m), the weak wave-generated flow has a relatively small influence on the wave set-up.The variation of the wave set-up against the wave period is similar to that on the reef-top without the vertical-wall structure. That is, the wave set-up reaches its maximum at T=1.75s . When the water depth hr=0.10m , the strong wave-generated flow has a greater influence on the wave set-up with a more complex relationship between the wave set-up and the wave period, that is, the wave set-up varies in a complicated way along with the wave period and will take the maximum value at T=2.00s as shown in Fig. 10.
4. Conclusions
This paper presents a laboratory investigation of the wave transformation characteristics over the deep-sea coral reefs. The distributions of the wave height, the wave set-up and the wave-generated flow on the reef-top are obtained before and after the construction of the reef-top structure at various submerged depths and under various wave conditions.In view of the fact that the wave breaking, the wave set-up and the wave-generated flow can be greatly influenced by the slope of the reef-face, the experiments are limited to the reef with a steep reef-face of 1:1. The conclusions of these studies are as follow:
(1) For the reef with a steep reef-face, the wave reflection can not be neglected. Because the phases of the reflected waves from the steep reef-face are different for different incident wave periods and the shoaling effects also differ for different wave periods,the superposed wave heights at the same wave gauges are different for different wave periods. In most test cases of ours, the wave heights at G7 on the reef-edge take the maximum values at T=1.75s , as a result of which the wave set-up on the reef-top reaches its maximum at T=1.75s .

Fig. 8 (Color online) Distribution of wave set-up and wave height along the reef-top

Fig. 9 (Color online) Relationship between relative wave set-up and relative submergence depth
(2) When the water depth is small (hr=0 m or 0.02 m), the waves break mainly on the reef-face and pass through the reef-edge like overtopping, with a higher mean water level at G7 than surrounding the measuring points. When the water depth on the reef-top is large, especially, when hr=0.10m , the waves break mainly on the reef-top, even a set-down can be observed at G7.
(3) After the reef-top structure is built, the flow channel from the exposed side of the reef to the sheltered side is blocked to generate the near-bottom backflow towards the reef face. The wave set-up on the reef-top increases rapidly due to the near-bottom backflow. The variation of the wave set-up against the wave period is influenced by the water depth on the reef-top: When the water depth is relatively small(hr≤0.05m), the wave setup reaches its maximum value at T=1.75s . When the water depth hr=0.10m, the relationship between the wave set-up and the wave period is more complex, that is, the wave set-up varies in a complicated way along with the wave period and reaches the maximum value at T=2.00s .
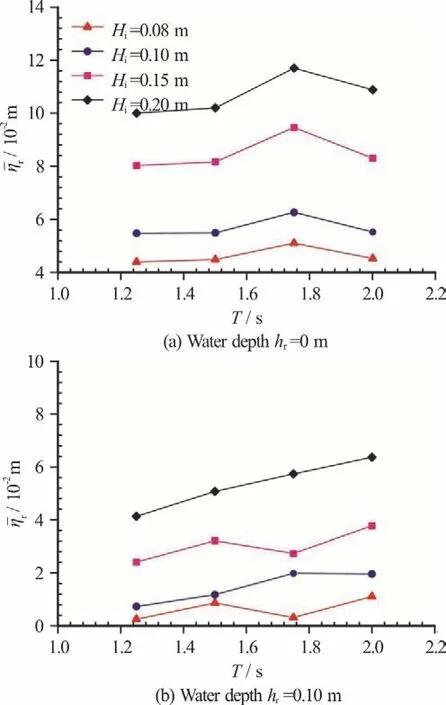
Fig. 10 (Color online) Wave set-up as functions of incident wave period after the vertical-wall structure is built
杂志排行
水动力学研究与进展 B辑的其它文章
- Development and application of a new random walk model to simulate the transport of degradablepollutants*
- Some notes on numerical simulation of the turbulent cavitating flow with a dynamic cubic nonlinear sub-grid scalemodel in OpenFOAM*
- Predictions of bulk velocity for open channel flow through submerged vegetation*
- On solitary wave in nonuniform shear currents *
- Fission law of solitary waves propagating over sharply variable topography *
- A TensorFlow-based new high-performance computational framework for CFD *
