Dynamic modeling and parameter identification of a gun saddle ring
2020-05-23TongLinLinfangQianQiangYinShiyuChenTaisuLiu
Tong Lin, Lin-fang Qian, Qiang Yin, Shi-yu Chen, Tai-su Liu
School of Mechanical Engineering, Nanjing University of Science and Technology, Nanjing, 210094, China
Keywords:Gun saddle ring Dynamic response Parameter identification Particle swarm optimization
ABSTRACT In this study, a theoretical nonlinear dynamic model was established for a saddle ring based on a dynamic force analysis of the launching process and the structure according to contact-impact theory. The ADAMS software was used to build a parameterized dynamic model of the saddle ring. A parameter identification method for the ring was proposed based on the particle swarm optimization algorithm. A loading test was designed and performed several times at different elevation angles. The response histories of the saddle ring with different loads were then obtained. The parameters of the saddle ring dynamic model were identified from statistics generated at a 50° elevation angle to verify the feasibility and accuracy of the proposed method.The actual loading history of the ring at a 70° elevation angle was taken as the model input. The response histories of the ring under these working conditions were obtained through a simulation. The simulation results agreed with the actual response. Thus, the effectiveness and applicability of the proposed dynamic model were verified, and it provides an effective method for modeling saddle rings.
1. Introduction
The saddle ring is a key component of a gun by facilitating easy slewing and bearing the weight of the slewing components and launching load.During launching,the load is transmitted between the upper and lower rings by rollers.The dynamic response of the ring to a launching load is directly related to the slewing motion,which further affects the dynamic response of the whole gun.Therefore, researching the dynamic characteristics of the saddle ring is very significant for improving the calculation accuracy of a gun launching dynamic model and analysis of the launching accuracy.
In a saddle ring,the relative movements of the upper and lower rings are limited by the large amounts of contact between the rollers and raceway. Many scholars have studied the dynamic characteristics of large slewing bearings,including the saddle ring.Yu et al. [1] used a finite element model (FEM) to analyze the bearing stiffness and deformation characteristics of slewing bearings in a shield tunneling machine under radial, axial, and overturning moment loads.Liu et al.[2]simplified the rollers in the ring as rigid bodies and established a rigid-flex FEM to construct the turret and ring. They obtained the deformation and stress distribution of the ring under a launching load. Liang et al. [3] adopted the implicit time-integration algorithm to analyze the contact of the ring under a launching load. They investigated the correlation between the contact force and stress of the ring and time and compared their results with analysis results based on conventional theory. In a gun launching dynamic model, the ring is currently often simplified as a revolute or a number of spring dampers. It is difficult to show the actual bearing force and relative motions of the upper and lower rings.If a saddle ring has a large number of rollers and the contact impacts of all rollers and the raceways need to be established, the FEM dynamic model is not very reliable and is time-consuming. Calculations of the launching dynamics of a gun often focus more on the force transmission and relative motions between the top and bottom carriages. Therefore, a key research area is to establish a gun ring model that is quick and accurate with clear model parameters while still ensuring the calculation efficiency of the gun launching dynamic model to reflect the dynamic response of the real gun launching process.
Modern mechanical structures tend to be multifunctional and complex.For models of nonlinear mechanical structures containing a large number of parameters,more scholars are increasingly using the parameter identification method to study the dynamic characteristics.Wu et al.[4]used the genetic algorithm to identify the parameters of a liquid damper model.Their experimental data verified the robustness and accuracy of the parameter identification results.Ding et al.[5]proposed an adaptive unscented Kalman filter algorithm with a noise statistical estimator to ensure good convergence of the identification of multi-strand nonlinear model parameters. Thus, parameter identification is an important approach for studying the parameters of a mechanical model that are unknown or difficult to measure.
The focus of the present study was a saddle ring. The structure and applied forces were analyzed,and a theoretical dynamic model of the ring was established. The ADAMS software was used for parametric modeling of the gun saddle ring. The particle swarm optimization(PSO)algorithm was adopted to propose a parameter identification method of the ring model, which exhibits faster convergence speed and precision when solving optimization problems without complex constraints. A ring loading test system was designed,and the model parameters were identified according to the statistical results. The simulation and test results were compared under different working conditions to verify the accuracy of the model and applicability of the parameter identification results.
2. Modeling method
2.1. Description of the structure
Fig.1 shows the structure of a saddle ring,which consists of an outer lower ring,an inner upper ring,and three rows of rollers.The lower ring is bolted to the bottom carriage, and the upper ring is bolted to the top carriage. Three rows of rollers are arranged between the upper and lower rings.The upper and lower rows are the same size and have 97 rollers each;they support the axial load and tilting moment. The middle row has 110 rollers and bears radial loads. The ring has axial and radial clearances.
2.2. Establishment of the coordinate system
Fig.2 shows the coordinate system that was established to build the dynamic model of the ring. The global coordinate systemOgxgygzgwas attached to the ground.The coordinate system of the upper ring wasOuxuyuzu: the originOuwas located at the intersection between the upper plane of the upper ring and its axis;Ouxuwas perpendicular to the upper ring's axis and points to the right;Ouyucoincided with the axis of the ring; and the axisOuzuwas determined by the right-hand screw rule. The coordinate system of the lower ring wasOlxlylzl: the originOlwas located at the intersection between the lower plane of the lower ring and its axis;Olxlwas perpendicular to the axis of the lower ring and points to the right; the axisOlylcoincided with the axis of the ring; and the axisOlzlwas determined by the right-hand screw rule.
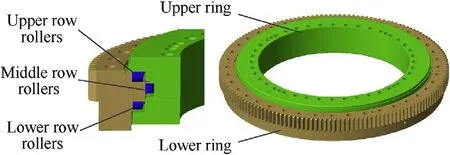
Fig.1. Structure of the saddle ring.
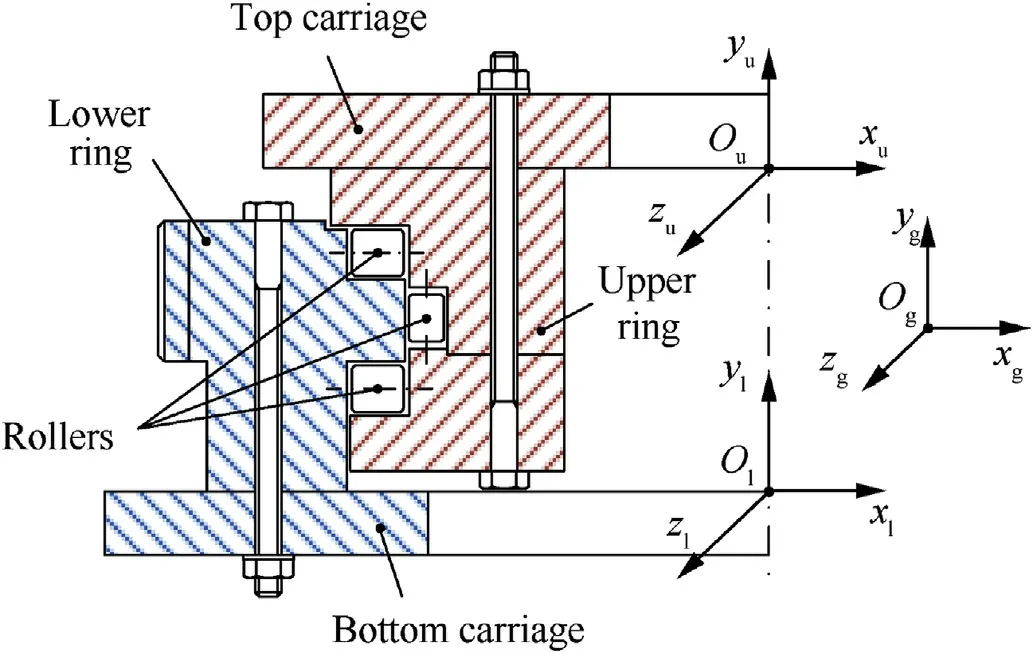
Fig. 2. Saddle ring and coordinate systems.
2.3. Force analysis of the saddle ring
The gun recoils and counter-recoils within 1-2 s after being fired.The recoil force is applied to the trunnion and passes from the top carriage to the bottom carriage.As shown in Fig.3,the load that the ring receives during launching mainly comprises the tilting momentM, radial forceFx, and axial forceFy. The ring passes the load from the top carriage to the bottom carriage through the rollers. The upper and lower rows of rollers are arranged laterally to provide axial force support, while the middle row of rollers is vertically arranged to provide radial force support. The upper and lower rings are fixed by the traversing mechanism and cannot rotate relative to each other.
The relative displacement between the upper and lower rings occurs because of the load. The top plane of the upper ring and bottom plane of the lower ring are each bolted to the top and bottom carriages, respectively. The upper and lower rings have relatively high structural rigidity. The relative displacement is assumed to only occur because of the relative slip and deformation from local contact between the rollers and raceway of the ring under a load. In addition, the upper and lower rings remain their original size and shape [6-8]. The rollers are constrained by the carriages,so there is no relative displacement with the lower ring.When the lower ring is fixed and the upper ringOuis moving toO′u,the radial displacement generated by the upper and lower rings under a load is δx.The axial displacement is δy,and the inclination angle is γ.
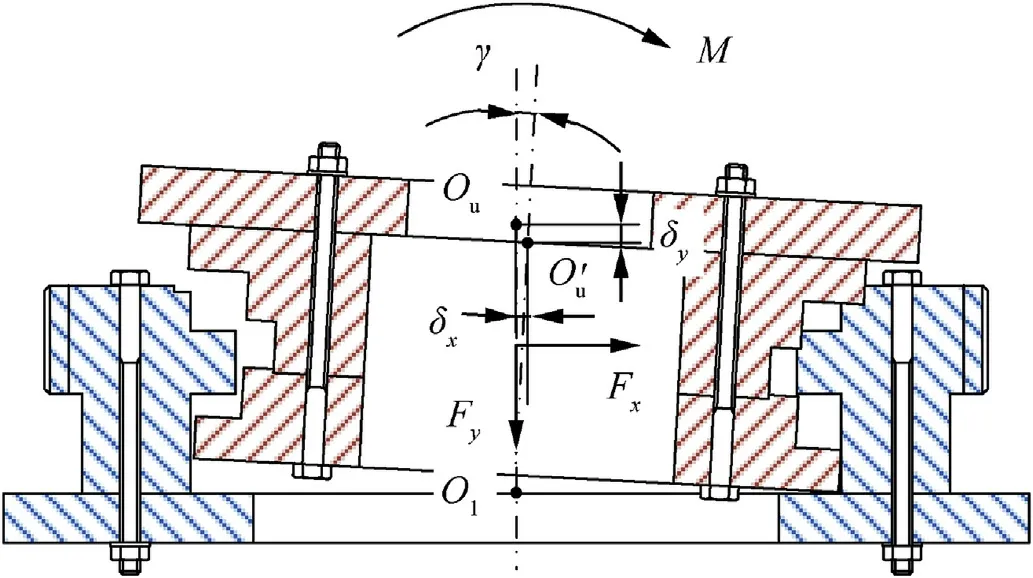
Fig. 3. Loads acting on the saddle ring.
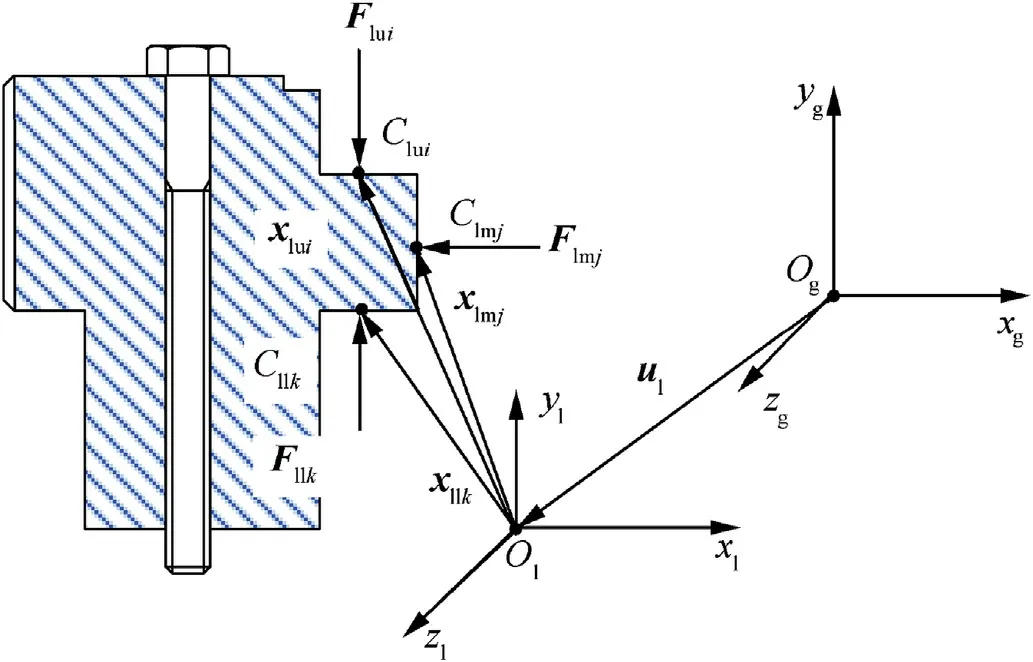
Fig. 4. Forces applied to the lower ring.
Fig.4 shows the force applied to the lower ring.The load of the lower ring under the force of theith roller in the upper row is Flui;xluiis the position vector of the action pointCluito the originOlof the coordinate systemOl-xlylzl.The load of the lower ring under the force of thejth roller in the middle row is Flmj;xlmjis the position vector of the action pointClmjto the originOl.The load of the lower ring under the force of thekth roller in the bottom row is Fllk;xllkis the position vector of the action pointCllkto the originOl.
Similarly as shown in Fig.5,the load on the upper ring under the force of theith roller in the upper row is Fuui= - Flui.xuuiis the position vector of the action pointCuuito the originOuof the coordinate systemOu-xuyuzu.The load on the upper ring under the force of thejth roller in the middle row is Fumj= - Flmj.xumjis the position vector of the action pointCumjto the originOu.The load on the upper ring under the force of thekth roller in the bottom row is Fulk= - Fllk.xulkis the position vector of the action pointCulkto the originOu.
The raceway spaces at the roller positions in the upper,middle,and lower rows are expressed by:

The penetration of each roller in the upper, middle, and lower rows into the raceway are expressed as:

Fig. 5. Forces applied to the upper ring.

Here,elx,ely,and elzare the unit vectors ofOlxlylzlin the directions ofx,y,andz,respectively.φjis the position angle of thejth roller in the middle row, as shown in Fig. 6.d1is the diameter of rollers in the upper and lower rows.d2is the diameter of rollers in the middle row.
2.4. Establishment of the ring model
The load is transmitted between the upper and lower rings through the rollers.As shown in Fig.7,replacing a single roller with the force unit model can effectively avoid the issues resulting from a large contact impact force.Each force unit consists of a nonlinear spring and damper that approximately simulate the characteristics of the contact forces between the rollers, raceway, and even lubricant film.There are gaps between the roller and raceway.If the gaps are assumed to be the same and half of the ring clearance μ,then the force units start to work and generate contact forces after the gaps are removed.
The rollers in the upper and lower rows have the same size and are slightly larger than the rollers in the middle row. During the modeling process of the ring,the same model parameters are used for the force units of rollers in the upper and lower rows. The models of the rollers in the upper,middle,and lower rows are given below:
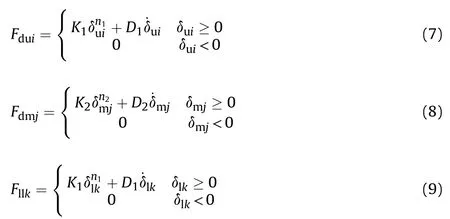
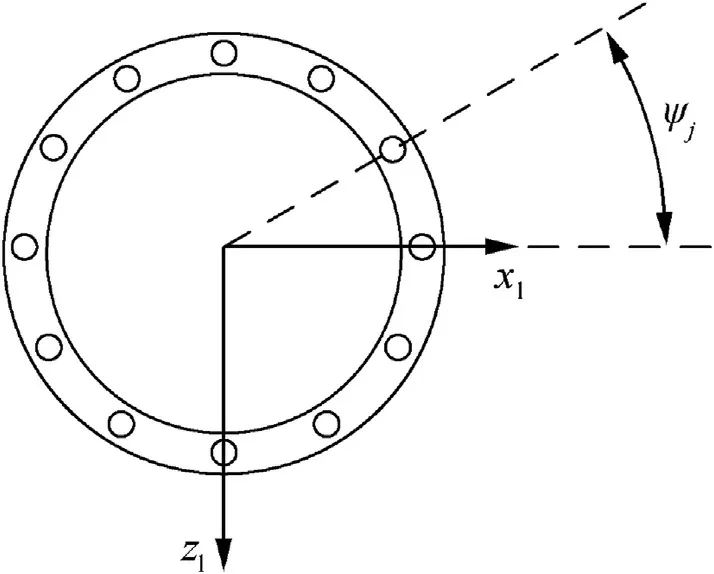
Fig. 6. Angular positions of the rollers.

Fig. 7. Roller model structure.
whereK1,n1, andD1are the stiffness, nonlinear index, and damping,respectively,of the contact model of rollers in the upper and lower rows and the raceway andK2,n2,andD2are the stiffness,nonlinear index,and damping,respectively,of the contact model of rollers in the middle row and ring.Then,the joint force applied on the lower ring is given by

The reaction force on the upper ring is

Based on the above analysis,a dynamic model of the saddle ring was established in ADAMS with the loop command, as shown in Fig.8.The loop command established the force unit of a single roller and then copied the force unit and rotated it around the center of the saddle ring to establish the remaining force units. Six design variables were created in the model to matchK1,n1,D1,K2,n2,andD2of the theoretical model so that the parameters could be easily adjusted during identification.
3. Parameter identification and test
3.1. Issues with the parameter identification
In the ring model,K1,n1,D1,K2,n2, andD2cannot be directly calculated through tests and have to be obtained by parameter identification.The parameters to be identified can be expressed in the form of a vector:

The response history of the ring obtained by inputting the parameters into the model under load isG(α);the response history of the ring generated by the test isThe identification error is defined as

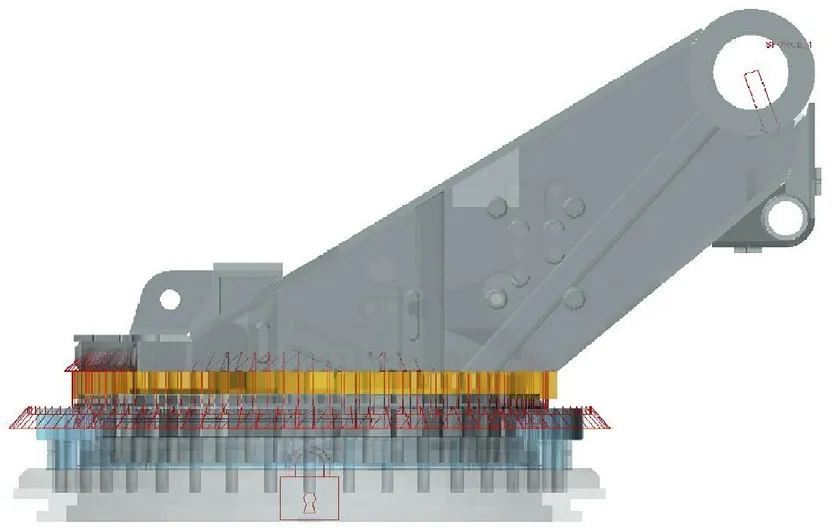
Fig. 8. Dynamic model of the saddle ring.
wherenis the number of data points andandGi(α) are the values of theith data points in the test and simulation,respectively.
The parameter identification of the contact force model of the ring can be regarded as an optimization problem, where the objective is to make the output of the model and measured value of the real system as close as possible.With the optimization method,the optimal values are in the range ofK1,n1,D1,K2,n2,andD2.The parameters of the ring model are established as follows:

where αmaxand αminare the upper and lower bounds of the parameters to be identified.
3.2. Particle swarm optimization algorithm
In this study,the PSO algorithm was adopted with global search for parameter identification of the ring model. PSO was coined by Kennedy and Eberhart [9] and originates from studies on bird foraging behavior.The basic concept is to find the optimal solution through information exchange and cooperation among individuals in a group.It is easy to apply and has a small number of parameters,fast convergence, and other advantages. PSO is widely used in the fields of parameter optimization,fuzzy system control,and system parameter identification [10,11].
The algorithm first initializes a group of particles in a feasible solution space.Each particle represents a potential optimal solution of the optimization problem, and each particle corresponds to a fitness value determined by the fitness function. The value of the particle indicates whether the particle is ideal or less ideal. The characteristics of each particle are represented by three indicators:the position,velocity,and fitness.The particles move in the solution space,and their individual positions are updated by tracking of the individual and global best positions. The individual best position refers to the position of an individual with its optimal fitness value,while the global best position refers to the position with the optimal fitness value among all particles in the population. The fitness value is calculated after the position of each particle is updated. The positions of the individual best position and global best position are updated through a comparison of the fitness values of new particles with those of the previous individual and global best positions.The specific steps are listed below[12].
In aD-dimensional search space, a population X = (X1,X2,…,XN)is assumed to consist ofNparticles,where thenth particle is represented as aD-dimensional vector Xn= (xn1,xn2,…,xnD)Tshowing the location of thenth particle in theD-dimensional search space. It also indicates a potential solution to the problem. The velocity is Vn= (vn1,vn2,…,vnD)T. The fitness value related to the position of each particleXican be calculated with the objective function.The individual best position of thenth particle is Pn= (pn1,pn2,…,pnD)T, and the global best position of the population isPg= (pg1,pg2,L,pgD,)T.
During each iteration, the particles update their velocity and position according to their individual best positions and the global best position:

wheren=1,2,…,N,d=1,2,…,D,and ω is the inertia weight.lis the number of current iterations.andare the velocities of thenth particle in theddimension during thelth and (l+ 1)th iterations.andare the positions of thenth particle in the d dimension during thelth andl+1th iterations.andare the individual best position and global best position in the d dimension during the lth iteration.c1andc2are acceleration factors,which are non-negative constants.r1andr2are random numbers distributed in the interval [0,1]. To control the density of spatial searches and prevent computational spillovers,the velocity is defined as vmaxso that it is limited to the interval[-vmax,vmax].The inertia weight ω is decremented linearly, as given below:

wherelmaxis the maximum number of iterations.
3.3. Ring model parameter identification procedure
The coupling between dynamic and static parameters and the large number of parameters make calculations difficult. To avoid this issue,a two-step identification process was used in this study:identifying the static parameters and identifying the dynamic parameters.A static load test was conducted to identifyK1,n1,K2,andn2. Then,D1andD2were identified in a dynamic load test. The procedure of the PSO algorithm for identifying the parameters of the contact force model of the ring is listed below.
1) Determine the ranges of the parametersK1,n1,K2,andn2;then,set the parameters of the PSO algorithm to generate an initial particle swarm.
2) Use the ADAMS simulation model to simulate the parameters corresponding to each particle in the population; then, obtain the response history of the saddle ringG(α).
3) CompareG(α) obtained from the simulation withgenerated from the test.Then,calculate the fitness function of each particle according to Eq. (13), and determine the individual and global best positions.
4) Update the position and velocity of the individuals according to Eqs. (15) and (16).
5) Repeat steps 2)~4)until the maximum number of iteration steps or the predetermined accuracy requirements are met. Output the final optimal solution and obtain the identification results ofK1,n1,K2, andn2.
6) Input the obtained values ofK1,n1,K2, andn2into the model,and replace the parameters to be identified withD1andD2.Obtain the identification results ofD1andD2according to steps 1)~5).
3.4. Test methods and measurement principles
Fig. 9 shows the experimental setup of the saddle ring. The lower ring was fitted with the base.The upper ring was fixed to the top carriage.The brackets were connected to the bearing wall.The top of the hydraulic cylinder was fixed to the brackets, and its bottom was connected to the rear trunnion.In the test,a load was applied through the hydraulic cylinder, and eddy-current sensors recorded the relative displacements of the four measurement points on the upper and lower rings.The positions of the base and the bracket were modified to change the direction of the applied load and evaluate the dynamic characteristics of the ring at different elevation angles.
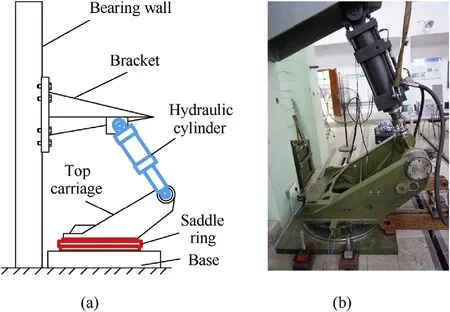
Fig.9. Experimental setup for the saddle ring:(a)schematic diagram and(b)physical map.
The testing device included a load measurement module and ring position measurement module. The load measurement module relied on pressure sensors fitted to the front of the hydraulic cylinder to receive real-time data of the load. The position measurement module comprised four eddy-current sensors on the force plane of the ring and were laid out as shown in Fig.10(a).The eddy-current sensors were installed on the bracket that was clamped onto the lower ring. The front ends of the sensors were connected to the metal convex surface of the upper ring.Each eddycurrent sensor collected distance data from its front-end surface to the corresponding metal plane, as shown in Fig. 10(b). The displacement increments of test points obtained by eddy-current sensors 1-4 were δ1, δ2, δ3, and δ4, respectively. The relative radial displacement of the upper and lower rings was δx.The axial displacement was δy. The rotation angle was γ. These can be calculated as follows:

whereLis the distance between measurement point 2 and point 4.
4. Results and discussion
4.1. Parameter identification simulation with the ring model
The experimental set of rings was tested at an elevation angle of 50°. The output of the eddy-current sensors was adjusted to be in the proper range. Because of the gaps between the bracket and bearing wall and between the bracket and hydraulic cylinder, a slight load was added to remove the gaps before the test. During the loading process from 0 t to 25 t and unloading from 25 t to 0 t,the sensor data were recorded for every load increment of 1 t.Then,the average of two records at the same load was taken as the test results. The dynamic load test was then carried out with loading from 0 t to 25 t and then unloading to 0 t. Fig.11 shows the correlation between the load and time. The changes in each sensor reading with time were recorded.
When the test data were used to calculate δy,the counterbalance of δ2and δ4produced fairly large errors. The radial relative displacement δxand inclination angle γ were selected as motion parameters for parameter identification of the ring. The radial displacement δxindicated the mechanical properties of rollers in the middle row, while the inclination angle γ reflected the mechanical properties of rollers in the upper and lower rows. The objective function in Eq. (14) was replaced as follows:
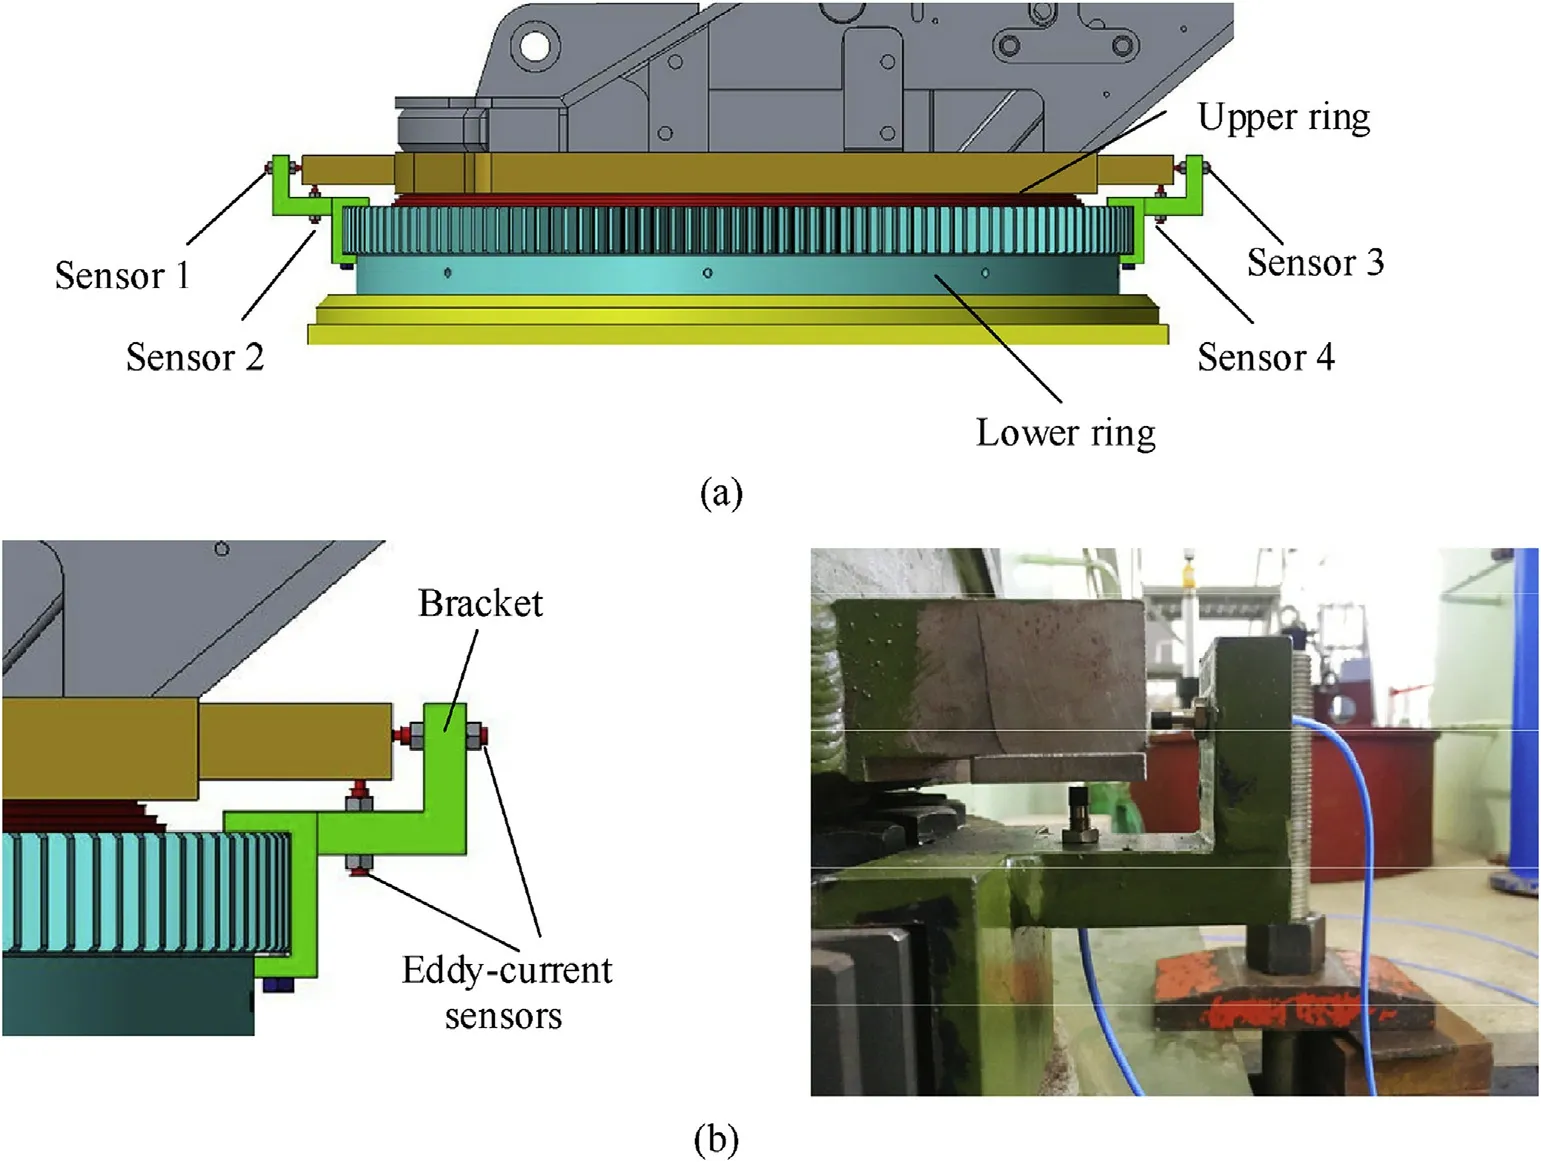
Fig.10. Sensors in the testing device: (a) locations, (b) schematic diagram, and physical map.
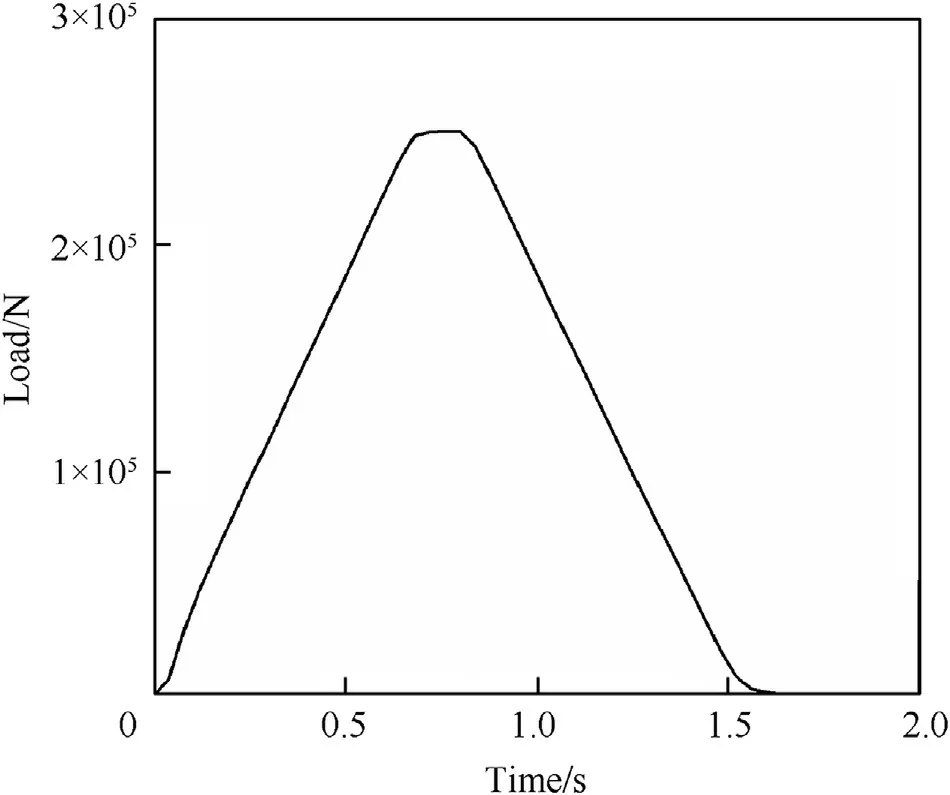
Fig.11. Experimental load vs time.

whereJδxandJγ are the identification errors of δxand γ, respectively.mδxandmγare the normalization coefficients ofJδxandJγ,respectively.The identification errors of δxand γ were normalized to the same level.
The static and dynamic data of δxand γ from the eddy-current sensors were used as the test data for parameter identification.K1,n1,D1,K2,n2, andD2were identified. Table 1 presents the ranges of the parameters. The parameters of the PSO algorithm were set as follows: population size=20, maximum number of iterations is 50,c1= 1.2,c2= 1.7,ωmax= 0.9, and ωmin= 0.4.
Table 2 presents the identification results of equivalent parameters.Approximated results were generated with the conventional contact-impact theory. However, the equivalent stiffness and system damping of roller units including the lubricating oil film could not be obtained in this way. The parameters from Table 2 were input into the ring model.Figs.12-15 compare the simulation and experimental results. The static load curve showed that the radial displacement and inclination angle had a positive linear relationship with the load. The difference between the simulation results and experimental data of the model after parameter identification was very small.This indicates that the proposed modeling method is accurate and that the PSO algorithm obtained the parameters of the ring model with a high degree of accuracy.
4.2. Verification of the ring model test
In order to verify the accuracy of the dynamic model of the saddle ring and the parameter identification,the testing device was adjusted to change the direction of the applied load.Test data of the ring were obtained with a load at an elevation angle of 70°. In addition,the dynamic model was adjusted so that the load size and direction matched the experimental values. Figs. 16-19 compare the simulated dynamic response of the ring with the experimental results.
The curves show that the lateral displacement and rotation angle in the simulation closely matched the test results at an angle of 70°. This suggests that the parameters identified at 50°can be applied to other working conditions. Thus, the accuracy of the model and applicability of the parameter identification results were verified.
In summary, the dynamic characteristics of the saddle ring under other working conditions can be accurately simulated by firstobtaining the experimental data of the ring under any working condition. Then, parameters can be identified with the PSO algorithm, and the data are then inputted into the model.

Table 1 Ranges of equivalent parameters.

Table 2 Identification results for the equivalent parameters.
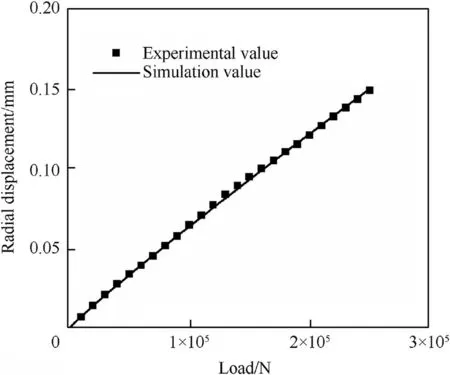
Fig.12. Comparison of radial displacements at a 50° static load.
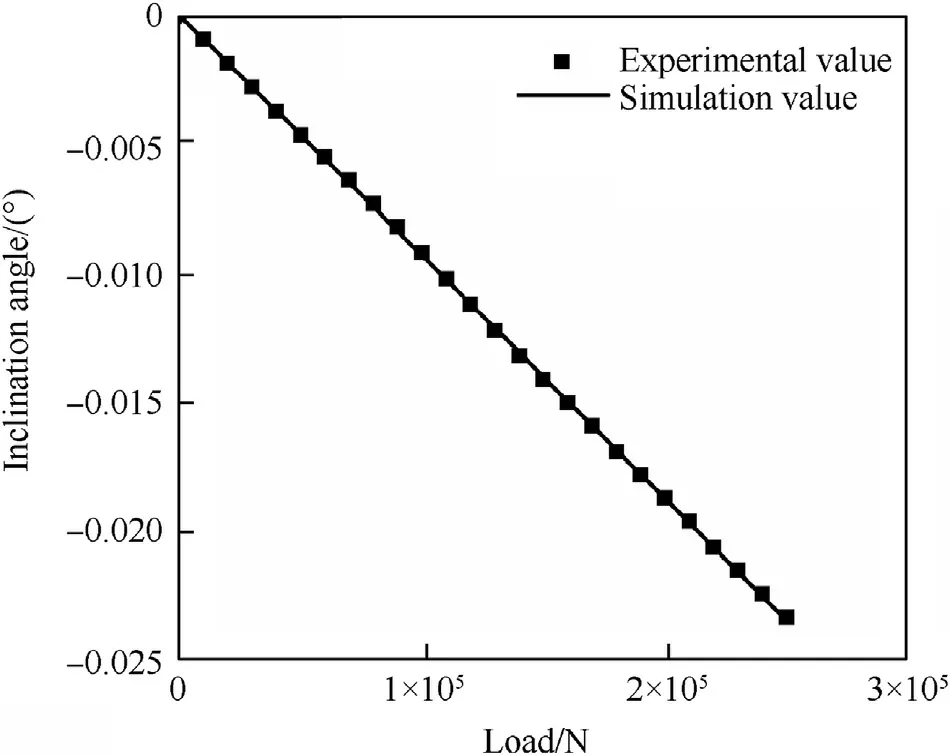
Fig.13. Comparison of inclinations at a 50° static load.
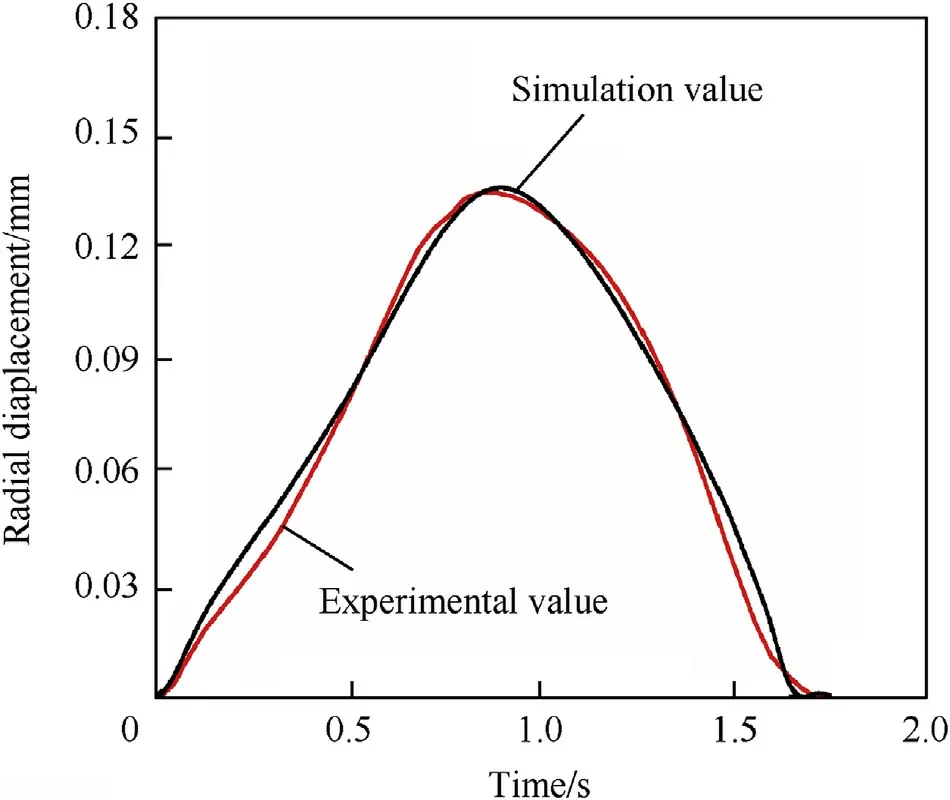
Fig.14. Comparison of radial displacements at a 50° dynamic load.

Fig.15. Comparison of inclinations at a 50° dynamic load.
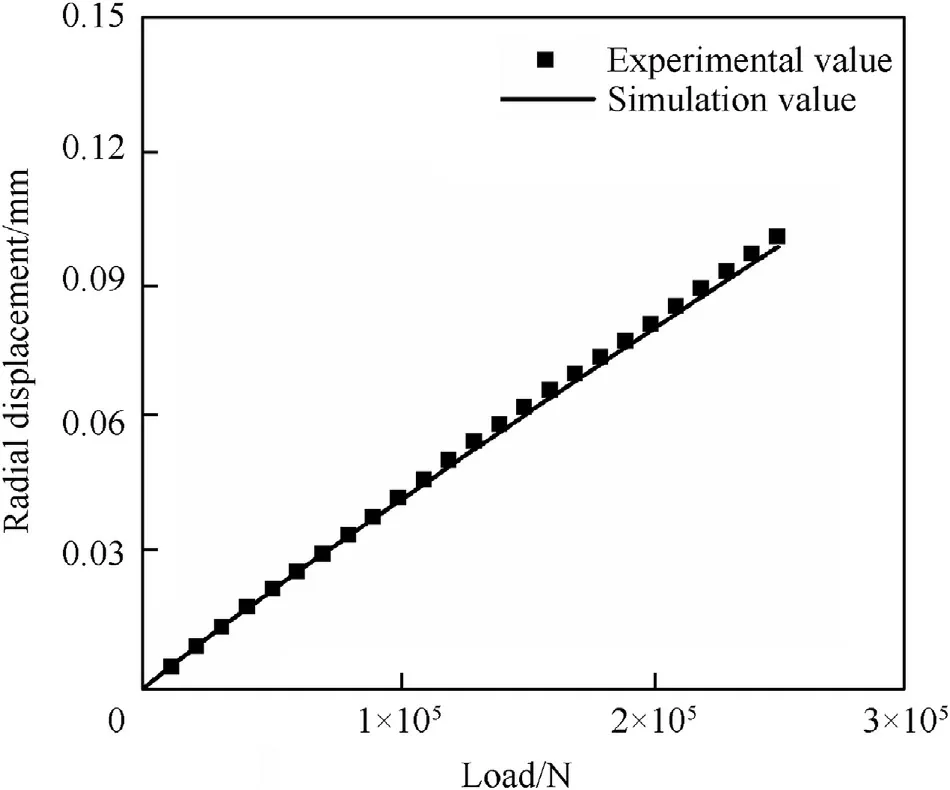
Fig.16. Comparison of radial displacements at a 70° static load.
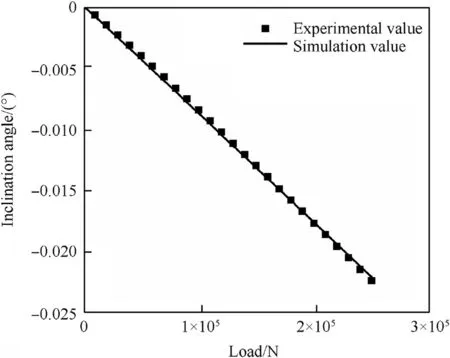
Fig.17. Comparison of inclinations at a 70° static load.
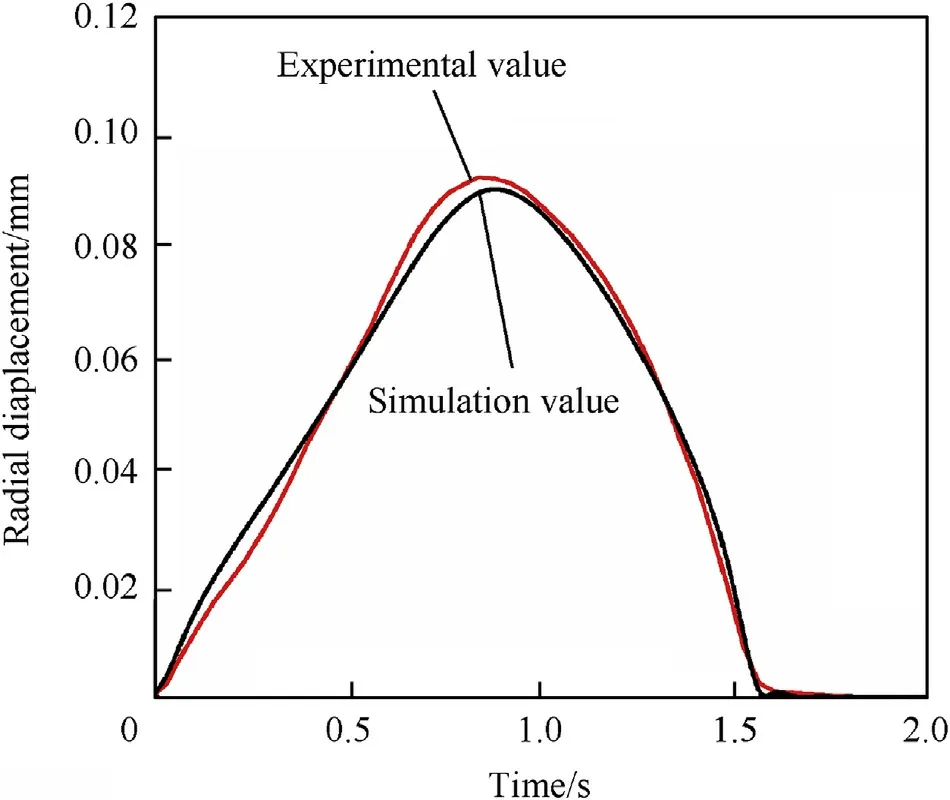
Fig.18. Comparison of radial displacements at a 70° dynamic load.
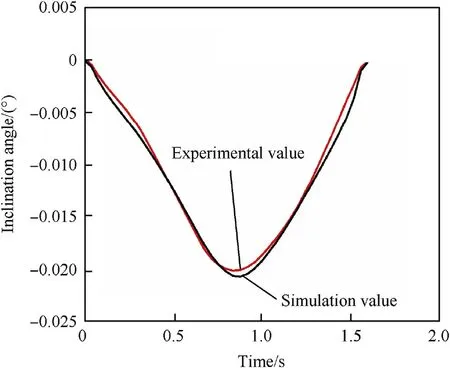
Fig.19. Comparison of inclinations at a 70° dynamic load.
5. Conclusion
This paper describes the basic structure of a saddle ring and a force analysis of the ring during launching. A theoretical dynamic model of the ring was established, and parametric dynamic modeling of the ring was performed with ADAMS. A parameter identification method was proposed for the ring model based on the PSO algorithm. A loading test system was designed, and the parameters of the ring model were identified. The accuracy of the proposed model was verified,and it can be applied in a broad range of situations with loading from different angles. The following conclusions were drawn from an analysis of the experimental results:
(1) Displacement and rotation may occur with loads on the upper and lower rings. At a static load of less than 25 t, the relative displacement of the upper and lower rings, inclination angle, and load have a positive linear correlation.
(2) The simulation results of the dynamic model based on the structure of the saddle ring agreed with the experimental results.Thus,the dynamic model provides a reliable method for saddle rings.
(3) The parameters obtained by data identification under one type of working condition can be used to simulate the dynamic response of the ring under other working conditions.The accuracy of the model and feasibility of the parameter identification were verified.
Acknowledgments
The authors would like to thank the editor and the reviewers'professional comments which help substantially improve the manuscript. The authors also would like to acknowledge helpful discussions with Guang-song Chen from Nanjing University of Science and Technology, China, during the completion of this work. The research work presented in this paper was supported by National Natural Science Foundation of China (11472137)and the Natural Science Foundation of Jiangsu Province, China(BK20140773).
杂志排行
Defence Technology的其它文章
- A comparison of the ballistic behaviour of conventionally sintered and additively manufactured alumina
- Effect of operating temperature on aged single lap bonded joints
- Investigation on energy output structure of explosives near-ground explosion
- Characteristics structure analysis on debris cloud in the hypervelocity impact of disk projectile on thin plate
- A fast-running method for blast load prediction shielding by a protective barrier
- Coating processes towards selective laser sintering of energetic material composites
