Flue Gas Monitoring System With Empirically-Trained Dictionary
2020-05-22HuiCaoYajieYuPanpanZhangandYanxiaWang
Hui Cao,, Yajie Yu, Panpan Zhang, and Yanxia Wang
Abstract—The monitoring of flue gas of the thermal power plants is of great significance in energy conservation and environmental protection. Spectral technique has been widely used in the gas monitoring system for predicting the concentrations of specific gas components. This paper proposes flue gas monitoring system with empirically-trained dictionary (ETD) to deal with the complexity and biases brought by the uninformative spectral data.Firstly, ETD is extracted from the raw spectral data by an alternative optimization between the sparse coding stage and the dictionary update stage to minimize the error of sparse representation. D1, D2 and D3 are three types of ETD obtained by different methods. Then, the predictive model of component concentration is constructed on the ETD. In the experiments, two real flue gas spectral datasets are collected and the proposed method combined with the partial least squares, the background propagation neural network and the support vector machines are performed.Moreover, the optimal parameters are chosen according to the 10-fold root-mean-square error of cross validation. The experimental results demonstrate that the proposed method can be used for quantitative analysis effectively and ETD can be applied to the gas monitoring systems.
I. Introduction
VAST amount of toxic and harmful gases are produced in the operation of the thermal power plants. Monitoring the flue gas of the thermal power plants is obligatory for avoiding the serious damage on ecological environment. The monitoring of the flue gas is also indispensable to build the closedloop control circuit to realize the high efficiency of combustion system. Spectral techniques have become increasingly popular for gas monitoring system, due to their high sensitivity, stability and selectivity [1], [2]. Gas monitoring system based on absorption spectroscopy records the absorption of light that occurs at different wavelengths when the light passes through the gas mixture [3]. The concentration of specific components of the gas can be predicted by the regression models based on absorption spectra [4].
The partial least squares (PLS) [5], [6], the background propagation neural network (BPNN) [7], [8], and the support vector machines (SVM) [9]–[11] are commonly used in quantitative analysis of gas concentrations. PLS is a multivariate statistical technique and builds the linear models by mapping the high-dimensional data into the lowdimensional space [12]. Background propagation is used in BPNN to adjust the weights of each layer to optimize the objects to get the mapping relationship between the inputs and the outputs [13]. SVM is a trainable machine learning, the parameters of which lack theoretical basis [14]. All these methods directly performed on the space of the wavelength absorption. However, the space of the wavelength absorption contains redundant and unrelated information, which might lower the precision of the predictive model. Feature selection[15], [16] and feature extraction [17], [18] are generally employed to eliminate the disturbance produced by the redundant and unrelated information. Feature selection chooses a suitable subset of the wavelength absorptions,which generally is suboptimal because the number of all possible combinations is prohibitive [19], [20], particularly for high-dimensional data. Feature selection also ignores the information contained in the unchosen wavelengths [21]. The advantage of feature extraction above feature selection is that no information from any of the elements of the measurement vector needs to be wasted and the contextual information is considered as well [22].
Sparse representation is one of the feature extraction methods [23], [24] and could be adopted for quantitative analysis of the flue gas. For sparse representation, the original signals are represented only by few fundamental elements[25]. The representationcan be obtained for a original signalwhereis named dictionary,andis the another form of the signaly,Each column in the dictionarycould be regarded as a basis inand named atom [26]. The representation of the signalis sparse, when there are only few nonzero entries inThe sparsity of the representation enforces the important causes of the original signalAn appropriate dictionaryconsisted of the prototype atoms, leads to the sparse representation of the original signaland would improve the precision and effectiveness of the quantitative analysis of the flue gas[28]–[30].
In this paper, flue gas monitoring system with empiricallytrained dictionary (ETD) is proposed to deal with the complexity and biases brought by the uninformative spectral data. Firstly, ETD is extracted from the raw spectral data by an alternative optimization between the sparse coding stage and the dictionary update stage to minimize the error of sparse representation. There are three types of ETD, D1, D2 and D3,obtained by different methods. Then, the predictive model of component concentration is constructed on the ETD. In the experiments, two real flue gas spectral datasets, which are respectively collected from the gas-fired power plant and the coal-fired power plant, are used and the proposed method combined with PLS, BPNN and SVM are performed. The optimal parameters are chosen according to the 10-fold rootmean-square error of cross validation (RMSECV).Furthermore, the squared correlation coefficient of cross validationof the calibration set, the root-mean-square error of prediction (RMSEP) of the validation set and the squared correlation coefficient of predictionof the validation set are adopted to evaluate the methods.
The paper is organized as follows. The preliminaries are introduced in Section II. Flue gas monitoring system with ETD is presented in Section III. Section IV provides the experimental details. The experimental results are analyzed in Section V. Finally, Section VI concludes the paper.
II. Preliminaries
The core of the gas monitoring system is the quantitative analysis of specific components of the gas. Gas chromatography can be used for the analysis of the concentration of specific components of the gas because of its high separation function, high sensitivity and high selectivity.However, the gas chromatograph is relatively expensive and the experimental procedure is complex and with poor repeatability. According to different samples to be tested, the corresponding experimental plan is needed. Hence, gas chromatography is unsuitable for the gas monitoring systems of the thermal power plants.
According to the Beer-Lambert law, the total absorption of light is dependent upon the concentration and the absorptivity of the molecules [31]. Gas monitoring systems can be based on absorption spectroscopy, which records the absorption of light that occurs at different wavelengths when the light passes through the gas mixture. The concentration of specific components of the gas can be predicted by the regression models based on absorption spectra. Some classical regression methods are introduced in the following.
1)PLS:The equations of PLS can be represented by [6]


2)BPNN:An artificial neural network generally consists of an input layer, several hidden layers and an output layer. The network can use different types of activation functions such as the sign function, the linear function and the sigmoid function[32]. The goal of the artificial neural network learning algorithm is to obtain the parameters of the activation functions,that minimize the total sum of squared errors:whereis the real value, theis the network output. The parameter update formula used by the gradient descent method can be written as follows:whereis the learning rate. However, for hidden nodes,is difficult to access. BPNN uses the back-propagation technique to solve this problem. Each iteration of back-propagation has the forward stage and the backward stage. During the forward stage, the weights obtained from the previous iterations are used to compute the output value of each neuron in the network. During the backward stage, the weight update formula is applied in the reverse direction, i.e., the weights at layerare updated before the weights atlayer are updated, so the errors in layercan be used to estimate the weights in layer
3)SVM:The model of SVM can be expressed as the following form [14]:


The optimization problem can be solved by a Lagrange multiple method. The weight vectorcan be written as

All these conventional predictive models directly perform on the space of the wavelength absorption. However, the space of the wavelength absorption contains redundant and unrelated information, which might lower the precision of the predictive model of the flue gas. Therefore, flue gas monitoring system with ETD is proposed to overcome the complexity and biases brought by the uninformative spectral data. Flue gas monitoring system with ETD would be explained in detail in the next section.
III. Flue Gas Monitoring System With ETD
The schematic diagram of flue gas monitoring system with ETD is shown in Fig. 1 . The flue gas is drawn into an explosion-proof heater and heated to a fixed temperature.Then it is transferred to an absorption cell where lights from a predefined light source is shone through the gas onto miniature spectrometers which measure the spectral absorption spectra. The content of the flue gas can be predicted by the ETD model built on the absorption spectra.
For spectral analysis, the input is the absorbance of each wavelengthand the output is the component concentration
A dictionary is consisted of atoms that are used for signal sparse representation. Given a set oftraining signalsinETD is sought to best represent each memberunder strict sparsity constricts.is the corresponding coefficient of the signalThe ETD can be learned by

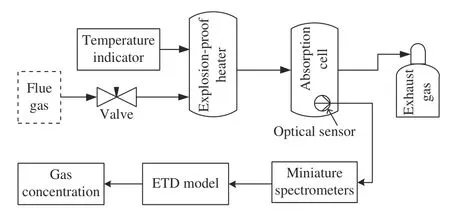
Fig. 1. Flue gas monitoring system with ETD.
On the sparse coding stage,is fixed and the optimization problem changes to

In the dictionary update stage,is sought to minimize the reconstruction error with a fixedThe optimization problem in this stage is

There are three ways to solve (10) and three types of ETD are obtained.
Take the derivative of (10) with respect toThe relation is


For (11), the dictionary can also be updated by the update of atoms one by one. For theatom,is defined as the support ofUpdatingandis equivalent to solve (6)

This problem amounts to finding the closest rank-1 approximation tothat can be easily solved by singular value decomposition. The second type of ETD,is obtained byKsingular value decomposition, whereKis the number of the atoms of the dictionary.


After all the training signals being processed,is obtained.
After the ETD is learned from the original spectral data, the regression models, such as PLS, BPNN, and SVM, could be constructed on the obtained ETD to predict the component concentration..
IV. Experiments
A. Data Collection
To estimate the effectiveness of the proposed method, two real datasets of flue gas are collected respectively from a coalfired power plant and a gas-fired power plant. The first dataset is the spectra of a mixture of nitrogen dioxide (NO2) and sulfur dioxide (SO2) collected from a coal-fired power plant.There are 150 samples. The absorption spectrum is measured by a USB2000+ fiber optic spectrometer of the Ocean Optics Company. Each spectrum contains 489 wavelengths, ranging from 200 nm to 700 nm. Fig. 2 shows a spectrum of the flue gas dataset of coal-fired power plant. The second dataset is the spectra of flue gas collected from a gas-fired power plant with a total of 150 samples. The flue gas is made of carbon monoxide (CO), carbon dioxide (CO2), and methane (CH4).The absorption spectrum is measured by a GASMET DX4000 Fourier transform infrared (FTIR) gas analyze. Each spectrum has 476 wavelengths and ranges from 549.44 cm−1to 4238.28 cm−1with a resolution of 7.72 cm−1. A spectrum of the flue gas dataset of gas-fired power plant is shown in Fig. 3. The standard concentrations of the flue gas are measured by an SP-3400 gas chromatograph from Beijing Beifen-Ruili Analytical Instrument Co. Ltd.

Fig. 2. The spectrum of the flue gas dataset of coal-fired power plant.

Fig. 3. The spectrum of the flue gas dataset of gas-fired power plant.
B. Experimental Procedure
In this study, the three types of ETD, D1, D2 and D3, are obtained from the three solutions. PLS, BPNN and SVM are combined with D1, D2 and D3, respectively, to predict the gas concentration of the gas sensing system. PLS, BPNN, SVM,PLS based on D1 (D1-PLS), BPNN based on D1 (D1-BPNN),SVM based on D1 (D1-SVM), PLS based on D2 (D2-PLS),BPNN based on D2 (D2-BPNN), SVM based on D2 (D2-SVM), PLS based on D3, (D3-PLS), BPNN based on D3 (D3-BPNN), and SVM based on D3 (D3-SVM) are built. The shutters strategy is employed to separate both datasets into the calibration set and the validation set [34]. Every five samples are divided as a group. The first four samples of each group are divided into the calibration set to build the prediction models and the last sample of each group is divided into the calibration set to evaluate the precision of these models. The predictive capability of the models has great correlations with the parameters. In our experiments, the optimal parameters are chosen according to the 10-fold RMSECV. For PLS, D1-PLS,D2-PLS, and D3-PLS, the optimal number of the latent variables (LVs) is searched from [1, 40] and the number of atoms in the ETD from [100, 200]. For BPNN, D1-BPNN,D2-BPNN, and D3-BPNN, three-layer net is adopted in our experiments and the optimal number of nodes of the hidden layer is searched from [1, 10]. The number of iteration is 100.The tansig function and the purelin function are respectively used in the hidden layer and the output layer. The search interval of the optimal number of atoms in the ETD is [100,200]. For SVM, D1-SVM, D2-SVM, and D3-SVM, the search ranges are [2−1, 215] in steps of 20.5for the penalty parameter[2−4, 26] in steps of 20.5for the non-sensitive lossand[100, 200] for the optimal number of atoms in the ETD. The performance of the models are discussed according to the RMSECV of the calibration set,of the calibration set, the RMSEP of the validation set andof the validation set.
V. Results and Discussion
A. The Flue Gas Dataset of a Coal-fired Power Plant
The RMSECV of PLS, BPNN, SVM, D1-PLS, D1-BPNN,D1-SVM, D2-PLS, D2-BPNN, D2-SVM, D3-PLS, D3-BPNN, and D3-SVM for SO2are presented in Fig. 4. The parameters of various prediction models of SO2are chosen by the minimal RMSECV. Table I summarizes the analytical results of SO2. For SO2, D2-PLS, D2-BPNN and D2-SVM all achieve the lower RMSEP than the original PLS, BPNN and SVM. The RMSEP of D2-PLS is 2.13% lower than that of PLS; The RMSEP of D2-BPNN is 6.63% lower than that of BPNN; The RMSEP of D2-SVM is 1.54% lower than the RMSEP of SVM. It is demonstrated that D2 can be applied to improve the precision of prediction models of SO2. The solution to (2) is susceptible to local minimum. Both D1 and D3 update the whole set of atoms at once, while D2 updates the atoms one-by-one and replaces the atom that being not used enough with the least represented data elements. The replacement is effective in avoiding the local minima and over-fitting. The appropriate ETD improves the precision of prediction models.
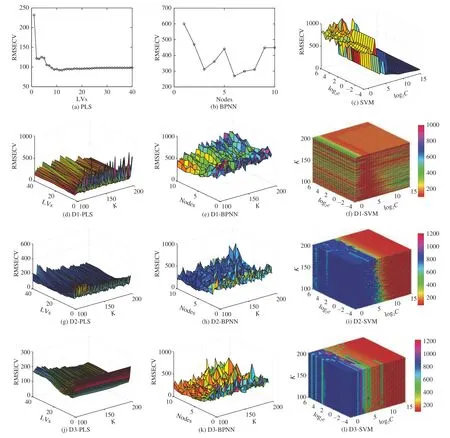
Fig. 4. Cross validation errors of SO2.
The RMSECV of PLS, BPNN, SVM, D1-PLS, D1-BPNN,D1-SVM, D2-PLS, D2-BPNN, D2-SVM, D3-PLS, D3-BPNN, and D3-SVM for NO2are presented in Fig. 5. The parameters of various prediction models of NO2are also chosen by the minimum RMSECV. The analytical results of NO2are summarized in Table II . For NO2, D3-PLS, D3-BPNN and D3-SVM all achieve the lower RMSEP than the original PLS, BPNN and SVM. The RMSEP of D3-PLS is 0.69% lower than that of PLS; The RMSEP of D3-BPNN is 39.31% lower than that of BPNN; The RMSEP of D3-SVM is 1.08% lower than that of SVM. Therefore, D3 is proposed to improve the precision of prediction models of NO2. Although D1 is obtained from a closed-form expression but with trouble in matrix inversion. It is not suitable for constructing the prediction models of NO2. The choice of the appropriate ETD is crucial, because sometimes the approximate solution of (3)can introduce noises and corrupt the data.
B. The Flue Gas Dataset of a Gas-fired Power Plant
Figs. 6–8 present the RMSECV of PLS, BPNN, SVM, D1-PLS, D1-BPNN, D1-SVM, D2-PLS, D2-BPNN, D2-SVM,D3-PLS, D3-BPNN, and D3-SVM for CO, CO2, and CH4,respectively. The parameters of various prediction models of the flue gas dataset of the gas-fired power plant are decided by the minimum RMSECV. Table III summarizes the analytical results of the flue gas dataset of a gas-fired power plant.BPNN is proved inappropriate for the flue gas dataset,because the RMSEP of BPNN are much higher than that of PLS and SVM. Therefore, BPNN, D1-BPNN, D2-BPNN and D3-BPNN are not discussed in the following analysis. PLS is employed as a benchmark for the comparison because the RMSEP of PLS is lowest among the three classical models for the flue gas dataset of the gas-fired power plant.

TABLE I Analytical Results of SO2

Fig. 5. Cross validation errors of NO2.

TABLE II Analytical Results of NO2
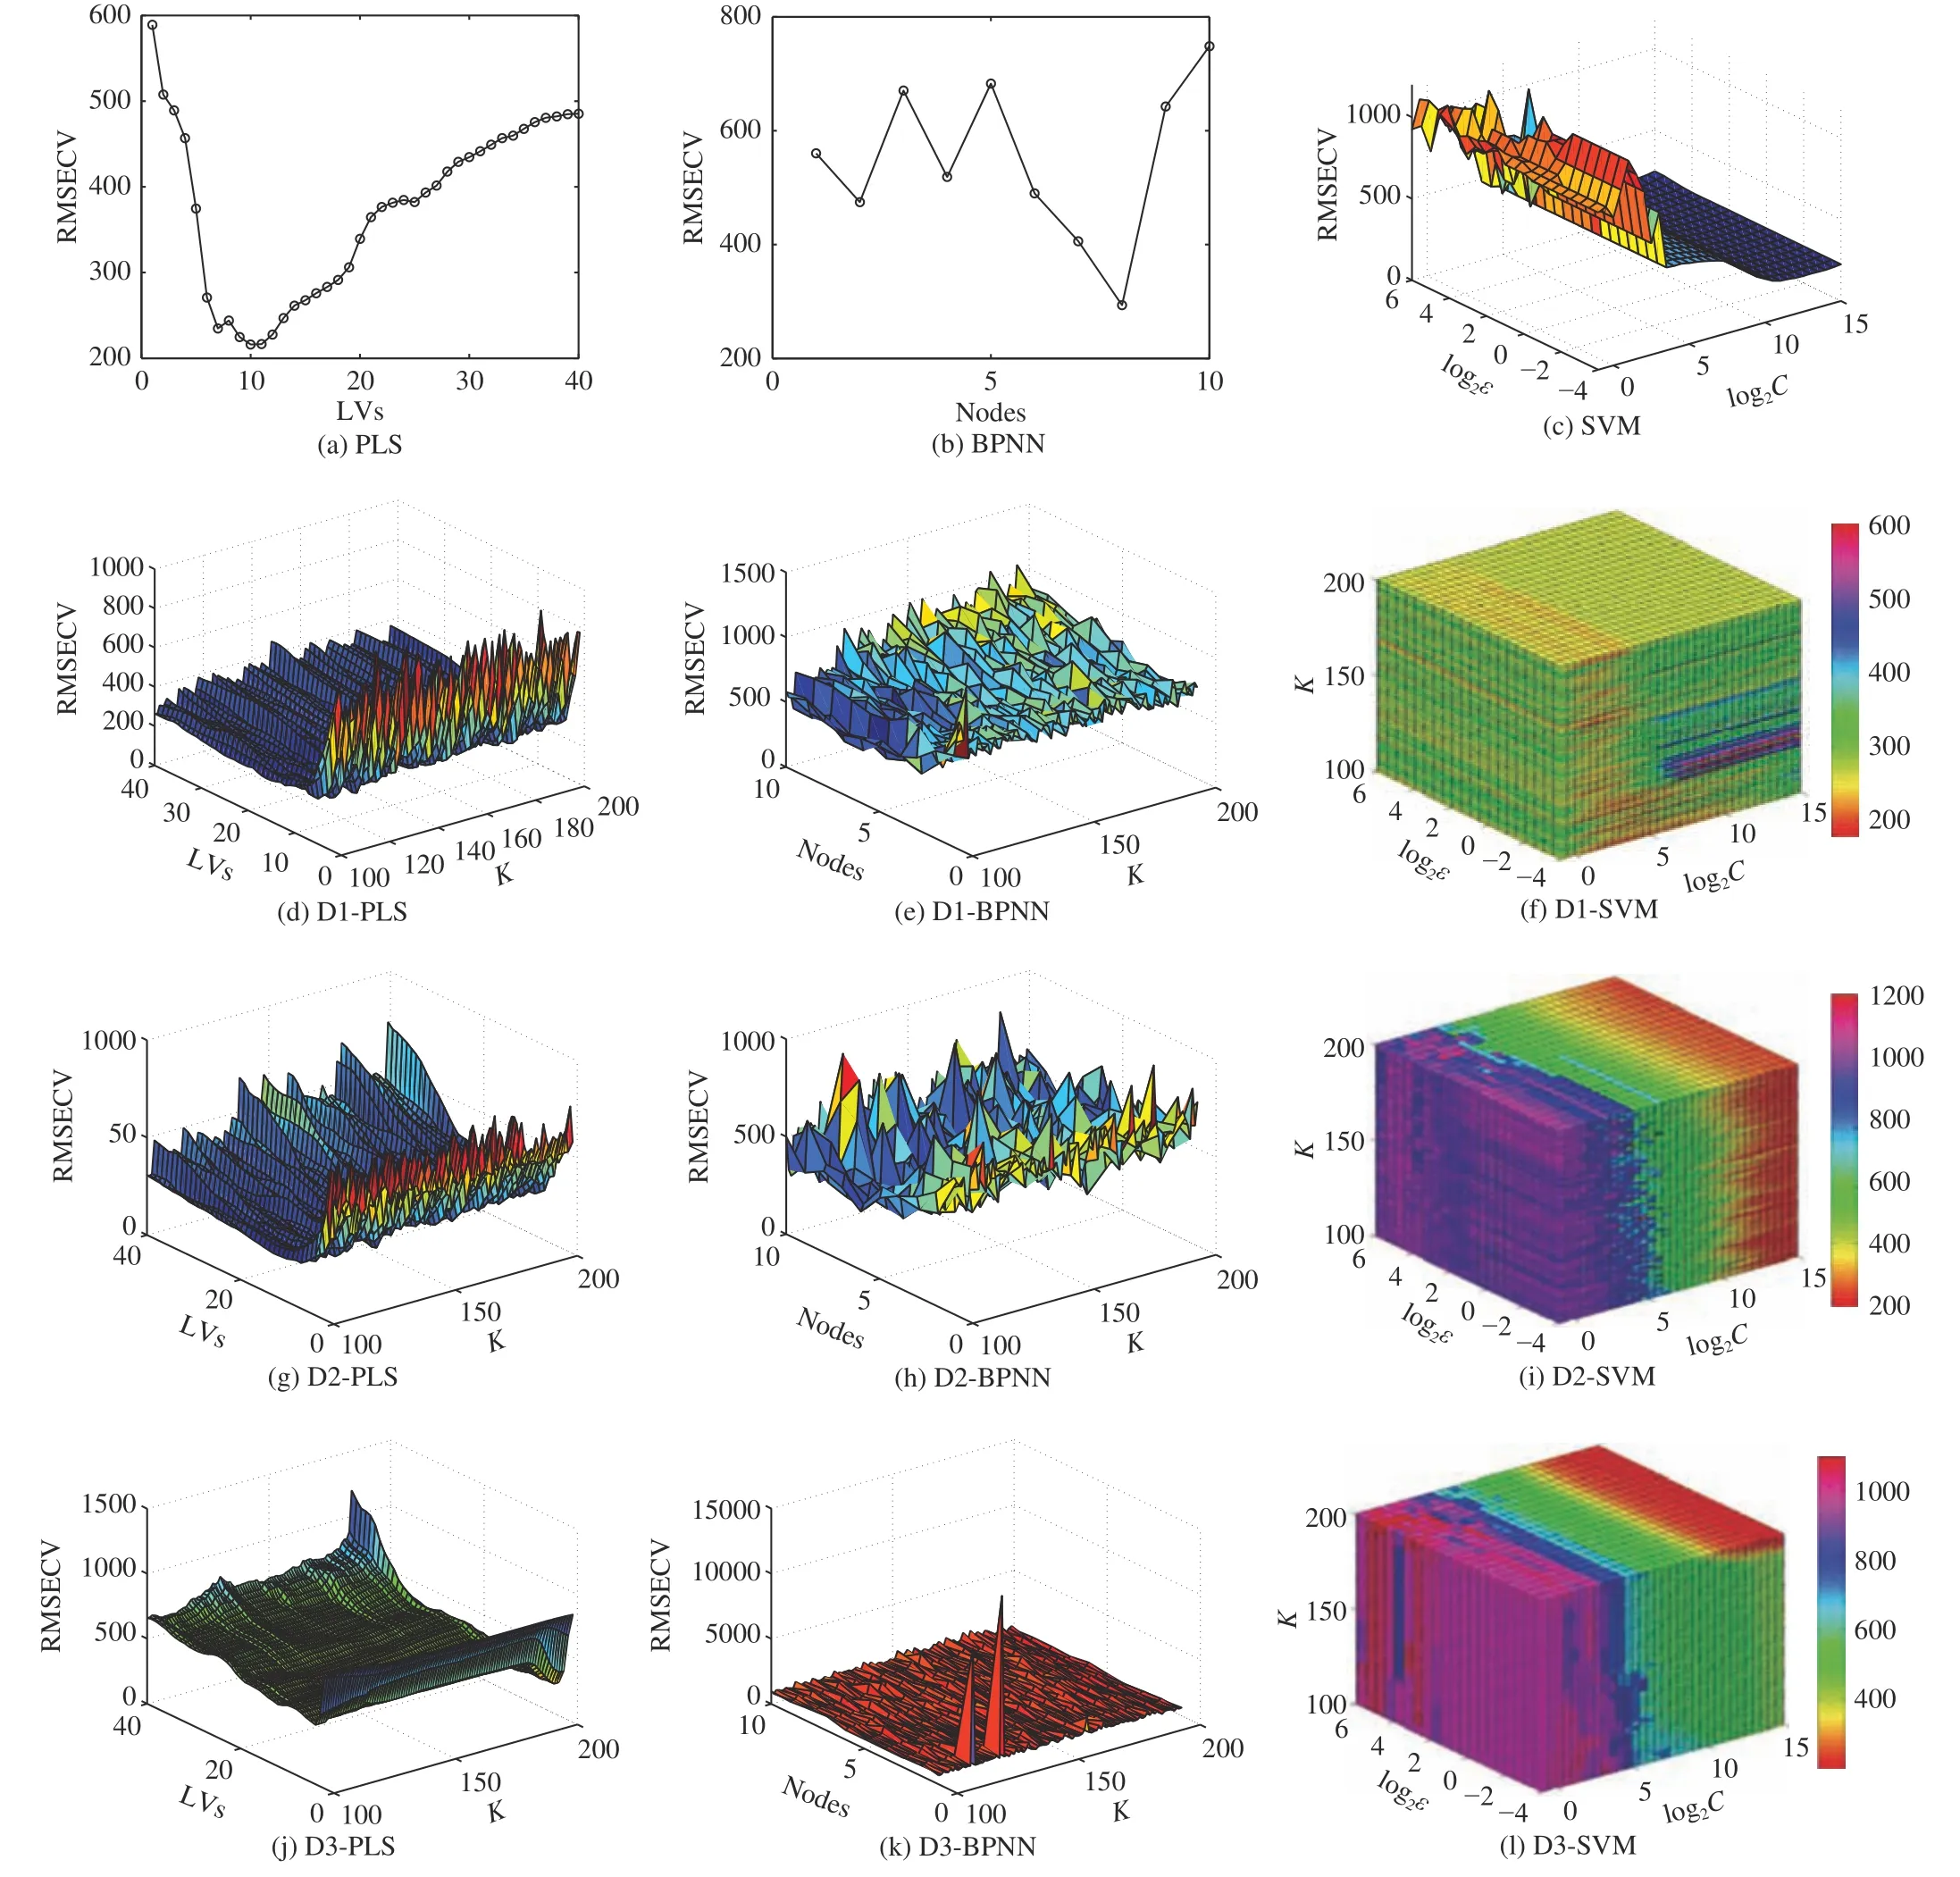
Fig. 6. Cross validation errors of CO.

Fig. 7. Cross validation errors of CO2.
For CO, the RMSEP of D1-PLS and D2-PLS are both lower than that of PLS. Moreover, the RMSEP of D1-SVM is 14.51% lower than that of SVM and 11.28% lower than that of PLS. It is proved the adoption of the ETD improve the predictive results in a large margin. For CO2, the D1-PLS has achieved the best predictive results with the RMSEP 3.33%lower than that of PLS. Although the RMSEP of D1-SVM is 4.27% higher than that of PLS, it is 16.7% lower than that of SVM. Hence, D1 is proposed to improve the precision of prediction models of CO2. For CH4, the D2-PLS has achieved the best predictive results with the RMSEP much lower than that of PLS. Furthermore, the RMSEP of D1-PLS is also much lower than that of PLS and the RMSEP of D1-SVM is 7.49% lower than that of SVM. Therefore, D1 is proposed to improve the precision of prediction models of CH4.
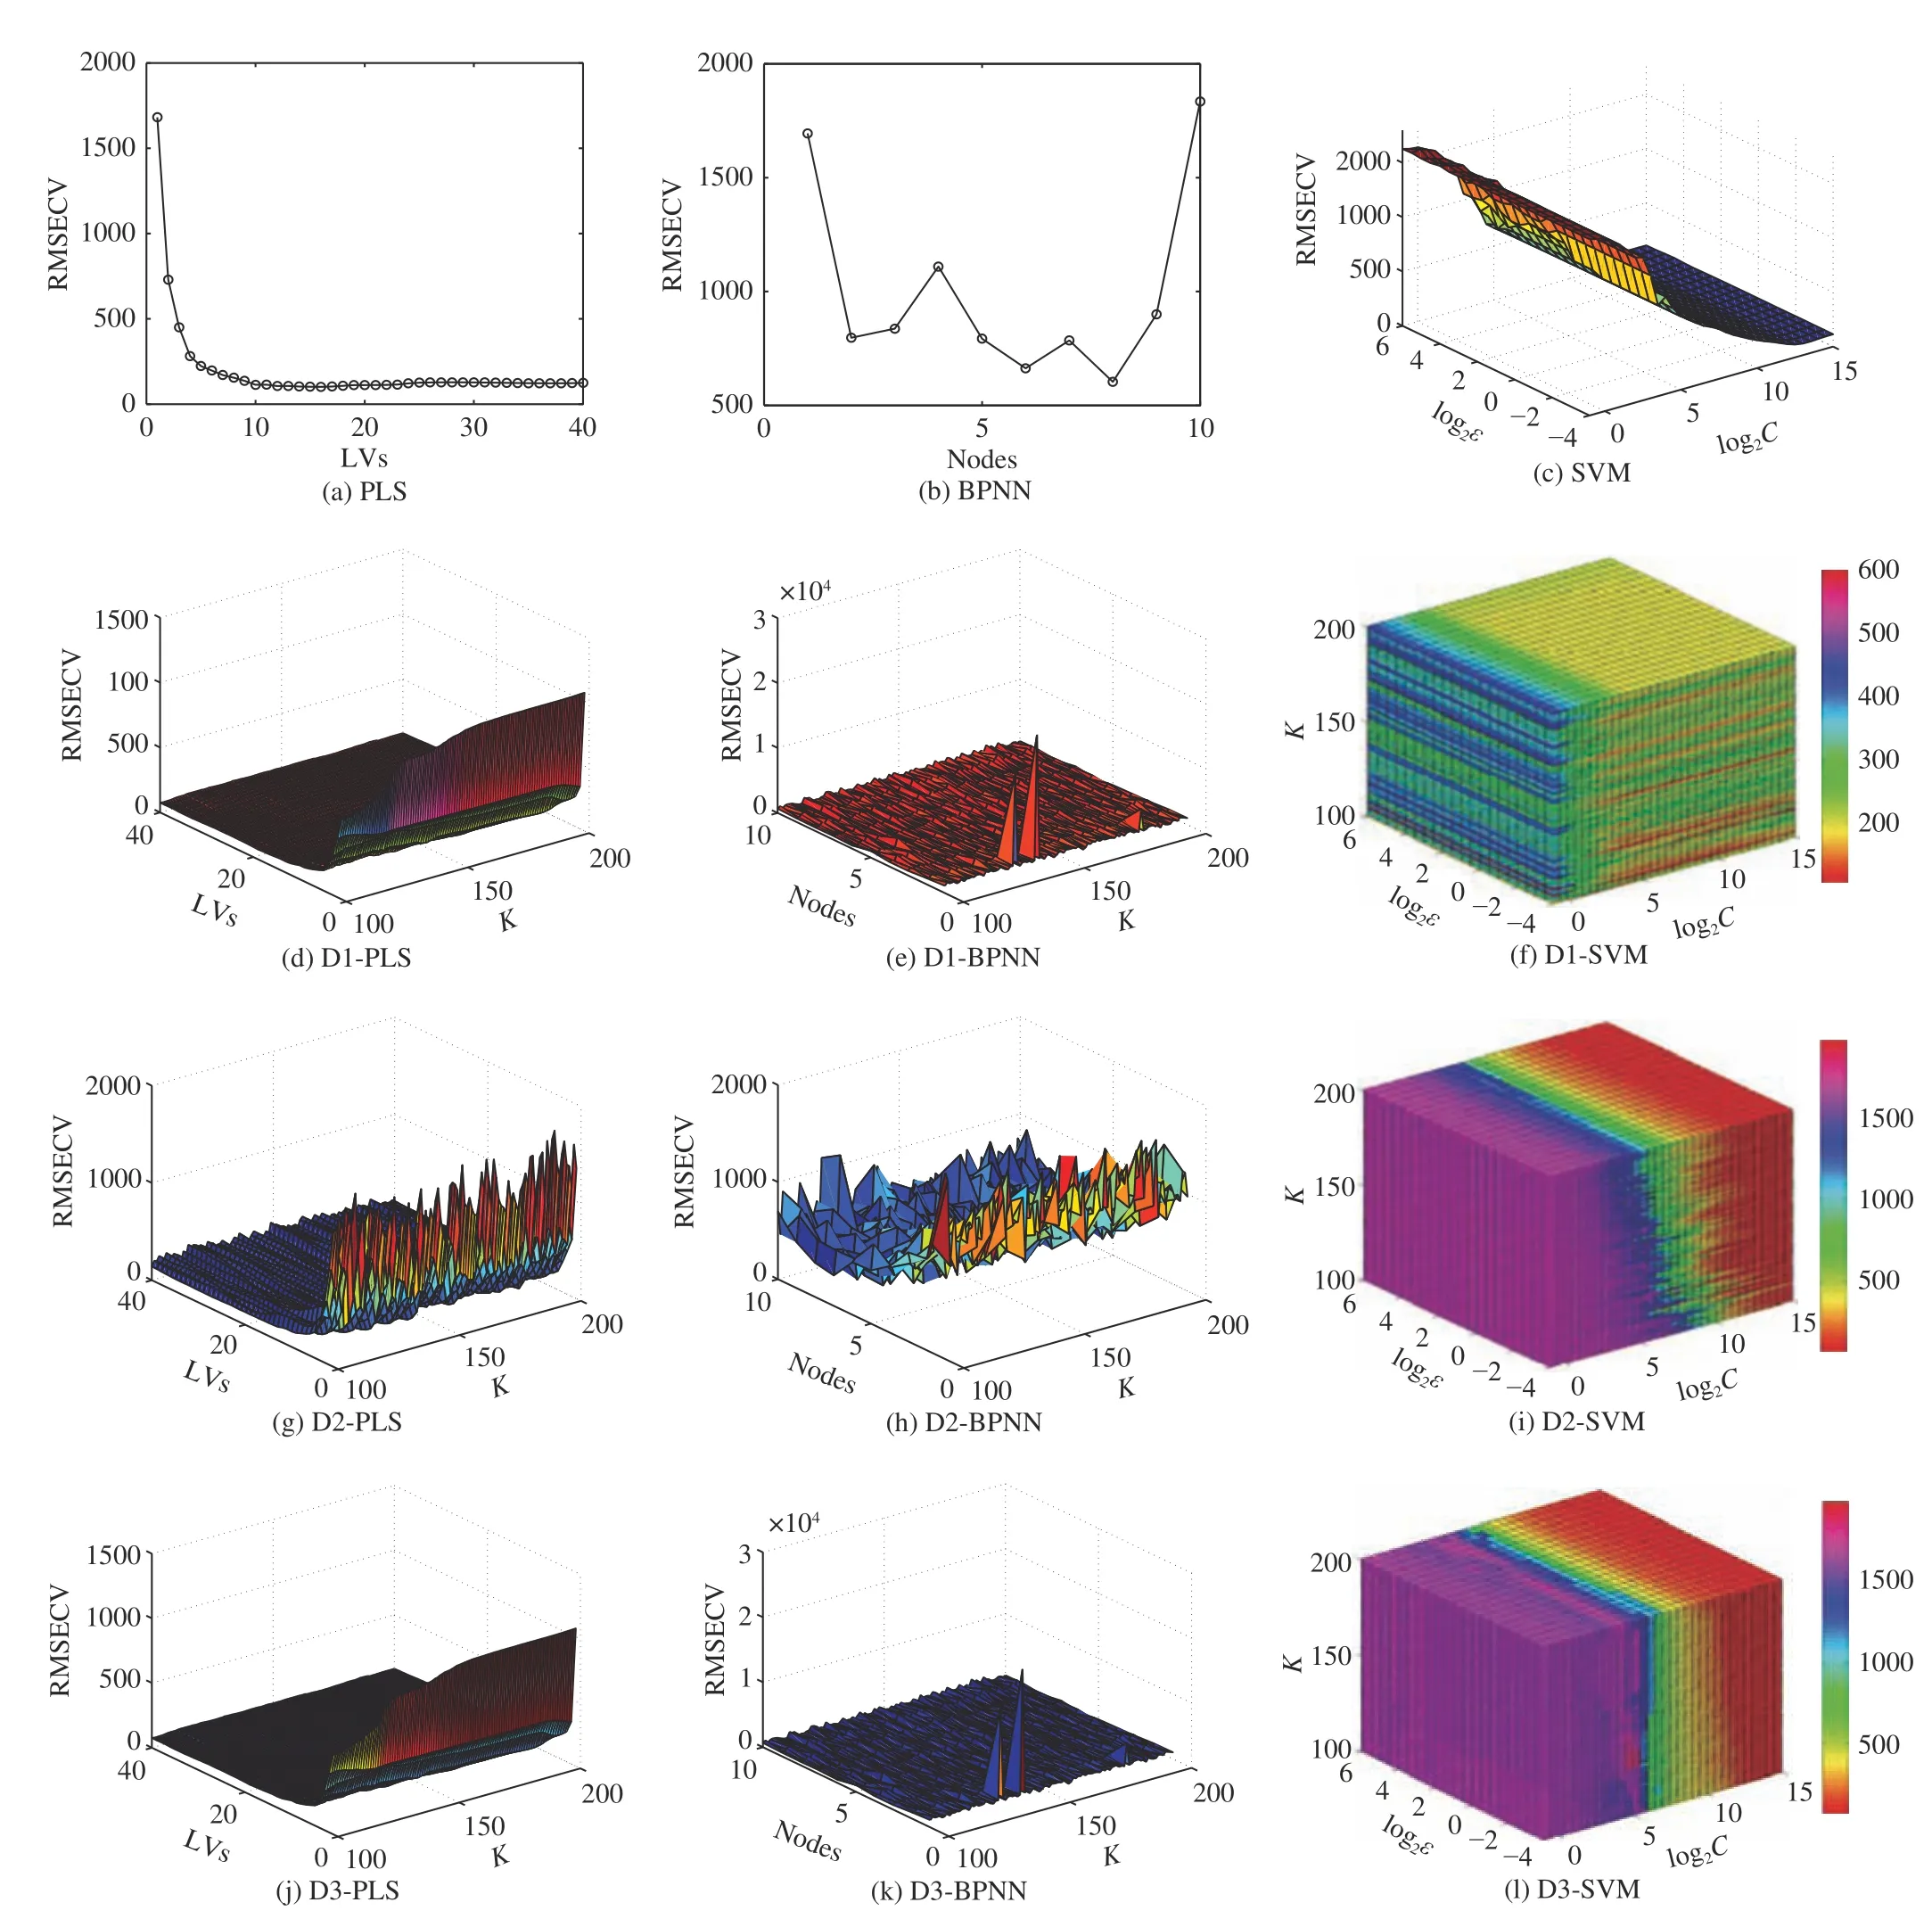
Fig. 8. Cross validation errors of CH4.
In a conclusion, ETD could be adopted for the quantitative analysis of the flue gas effectively and the choice of the proper ETD is crucial. The appropriate ETD can improve the precision of the prediction models of flue gas significantly.
VI. Conclusions
In this paper, flue gas monitoring system with ETD is proposed. This proposed method has the following advantages. Firstly, ETD contains the most significant causes of the original spectral data and represents the optimal subspace of the original data based on sparsity. Secondly, the dimensionality of the data is reduced for the ETD, which is consisted of compelling features, and can realize the sparse representation for spectral signals. Thirdly, the prediction models based on the ETDs have a higher predictive ability.Two real flue gas spectral datasets are adopted in our experiments. The experimental results verify that the proposed method can be used for the quantitative analysis of flue gas effectively and ETD can be applied to the gas monitoring systems.

TABLE III Analytical Results of the Flue Gas Dataset of Gas-Fired Power Plant
杂志排行
IEEE/CAA Journal of Automatica Sinica的其它文章
- Parallel Reinforcement Learning-Based Energy Efficiency Improvement for a Cyber-Physical System
- Post-Processing Time-Aware Optimal Scheduling of Single Robotic Cluster Tools
- Unified Smith Predictor Based H∞ Wide-Area Damping Controller to Improve the Control Resiliency to Communication Failure
- Optimal Neuro-Control Strategy for Nonlinear Systems With Asymmetric Input Constraints
- Adaptive Output Regulation of a Class of Nonlinear Output Feedback Systems With Unknown High Frequency Gain
- A Method for Deploying the Minimal Number of UAV Base Stations in Cellular Networks
