Spectral Characteristics and Quantitative Analysis of Troxerutin-Cu2+ Complex
2020-05-06
Faculty of Pharmacy, Guangxi University of Chinese Medicine, Nanning 530001, China
Abstract [Objectives] This study aims to establish a simple, convenient, fast, low-cost, low-consumption and efficient method for quality control of troxerutin. [Methods] In NaAc-phosphate buffer at pH=8, troxerutin could react with Cu2+ to form complex, which had a characteristic absorption peak at 408 nm in the ultraviolet spectrum. The content of troxerutin could be determined indirectly by measuring the absorbance of the complex. [Results] Within the linear range of 27.82-74.19 μg/mL, the absorbance of the complex has a good linear relationship with the concentration of troxerutin. The regression equation is A=0.011 9C-0.138 4 (r=0.999 1), and the detection limit is 1.59 μg/mL. This method used to determine the content of troxerutin in samples from different manufacturers, and the recovery is 100.9%-102.7%. [Conclusions] The ultraviolet spectrophotometry is used in this experiment to indirectly determine the content of troxerutin by measuring the absorbance of troxerutin-Cu2+ complex, and the results are accurate, reproducible and highly precise. This method can be used for quantitative analysis of troxerutin.
Key words UV-visible spectrophotometry, Troxerutin, Content determination
Supported by Basic Ability Enhancement Project for Young and Middle-aged Teachers in Colleges and Universities of Guangxi in 2017 (2017KY0284); Guangxi Key Laboratory of Zhuang and Yao Ethnic Medicine (GXZYKF2019-7); Collaborative Innovation Center of Zhuang and Yao Ethnic Medicine[(2013) No.20].
*Corresponding author. Yu LIN (1988-), female, lecturer, engaged in spectroscopy-based drug analysis.
1 Introduction
Troxerutin tablet can inhibit platelet aggregation and prevent thrombosis, and it can effectively treat lower extremity arteriosclerosis, varicose veins and other diseases. According to current statistics, the methods for determining the content of troxerutin include high-performance liquid chromatography[1-6], UV spectrophotometry[7-10], thin-layer chromatography[11], capillary electrophoresis[12], atomic absorption indirect measurement, electrochemical voltammetry[13], fluorescence spectrophotometry[14-20], and so on. In addition to advantages, these methods also have some disadvantages, such as expensive equipment, high maintenance costs, long duration, low sensitivity and need to use toxic organic reagents. Troxerutin can react with Cu2+to form complex, and the intensity of absorbance of the complex increases with the concentration of troxerutin. Based on this principle, a simple, efficient, low-consumption and environmentally friendly indirect UV-Vis method was established for quality control of troxerutin, and it was successfully applied to the content determination of troxerutin in preparation samples.
2 Experimental methods
2.1InstrumentsandreagentsThe instruments and reagents used mainly included UV-1780 UV-visible spectrophotometer (Shimadzu Instruments (Suzhou) Co., Ltd.) and troxerutin standard (National Institutes for Food and Drug Control, batch No.100416-201607, labeled amount of 97.5%). The other reagents were of analytical grade.
2.2Preparationofsolutions
2.2.1Troxerutin standard solution. 0.278 4 g of troxerutin standard was dissolved in pure water to 100 mL. 3.40 mL of the solution was diluted to 50 mL to prepare into troxerutin standard solution of 2.50×10⁻⁴mol/L.
2.2.2Troxerutin sample solution. A total of ten troxerutin tablets were weighed and ground finely. A certain amount of the powder, equivalent to 74.27 mg of troxerutin, was dissolved in water to 100 mL. After filtration, 25.00 mL of the subsequent filtrate was transferred to a volumetric flask and diluted to 100 mL. Thus, a sample solution of 2.50×10⁻⁴mol/L was obtained.
2.2.3Cu2+solution. 0.250 0 g of copper sulfate pentahydrate was dissolved in water to 100 mL. 2.50 mL of the solution above was diluted to 100 mL to obtain a Cu2+solution of 2.50×10⁻⁴mol/L.
2.3OperationmethodCertain amounts of troxerutin, Cu2+solution and NaAc-phosphate buffer were added into a colorimetric tube in order, and diluted to 10 mL. The absorbance (A) of the mixture was measured at 408 nm with an ultraviolet spectrophotometer, taking the sample without Cu2+as the reference blank.
3 Results and discussion
3.1SelectionofmetalionFixed amount of troxerutin standard solution is reacted with same amount and same concentration of Mg2+, Cu2+, Ni2+, Co2+, Mn2+and Al3+, respectively, and the absorbance of the mixtures is determined using UV-visible spectrophotometry. It is found that troxerutin and Mg2+, Mn2+, Al3+do not produce new characteristic peaks; although troxerutin and Ni2+, Co2+show new characteristic absorptions, they are not sensitive; and troxerutin and Cu2+generate large characteristic absorption at 280 and 400 nm. Therefore, Cu2+is selected for research.
3.2AbsorptionspectrogramsDistilled water is used as a blank, and different composition solutions are measured, and Fig.1 is obtained. The results show that before and after adding the buffer solution, the spectral characteristic peak positions (curves a and b) of troxerutin are basically unchanged; the curves c and d overlap, indicating that the buffer solution do not react with Cu2+; the curve e produces new absorptions around 285 and 400 nm, indicating that in the NaAc-phosphate buffer solution, troxerutin and Cu2+form a complex.
The troxerutin solution without Cu2+is used as a blank, and determination is conducted. As shown in Fig.2, the troxerutin-Cu2+complex has obvious characteristic absorption peaks atλ285andλ408nm. Due to the interference of drug absorption atλ285nm,λ408nm is selected as the working wavelength in this experiment.
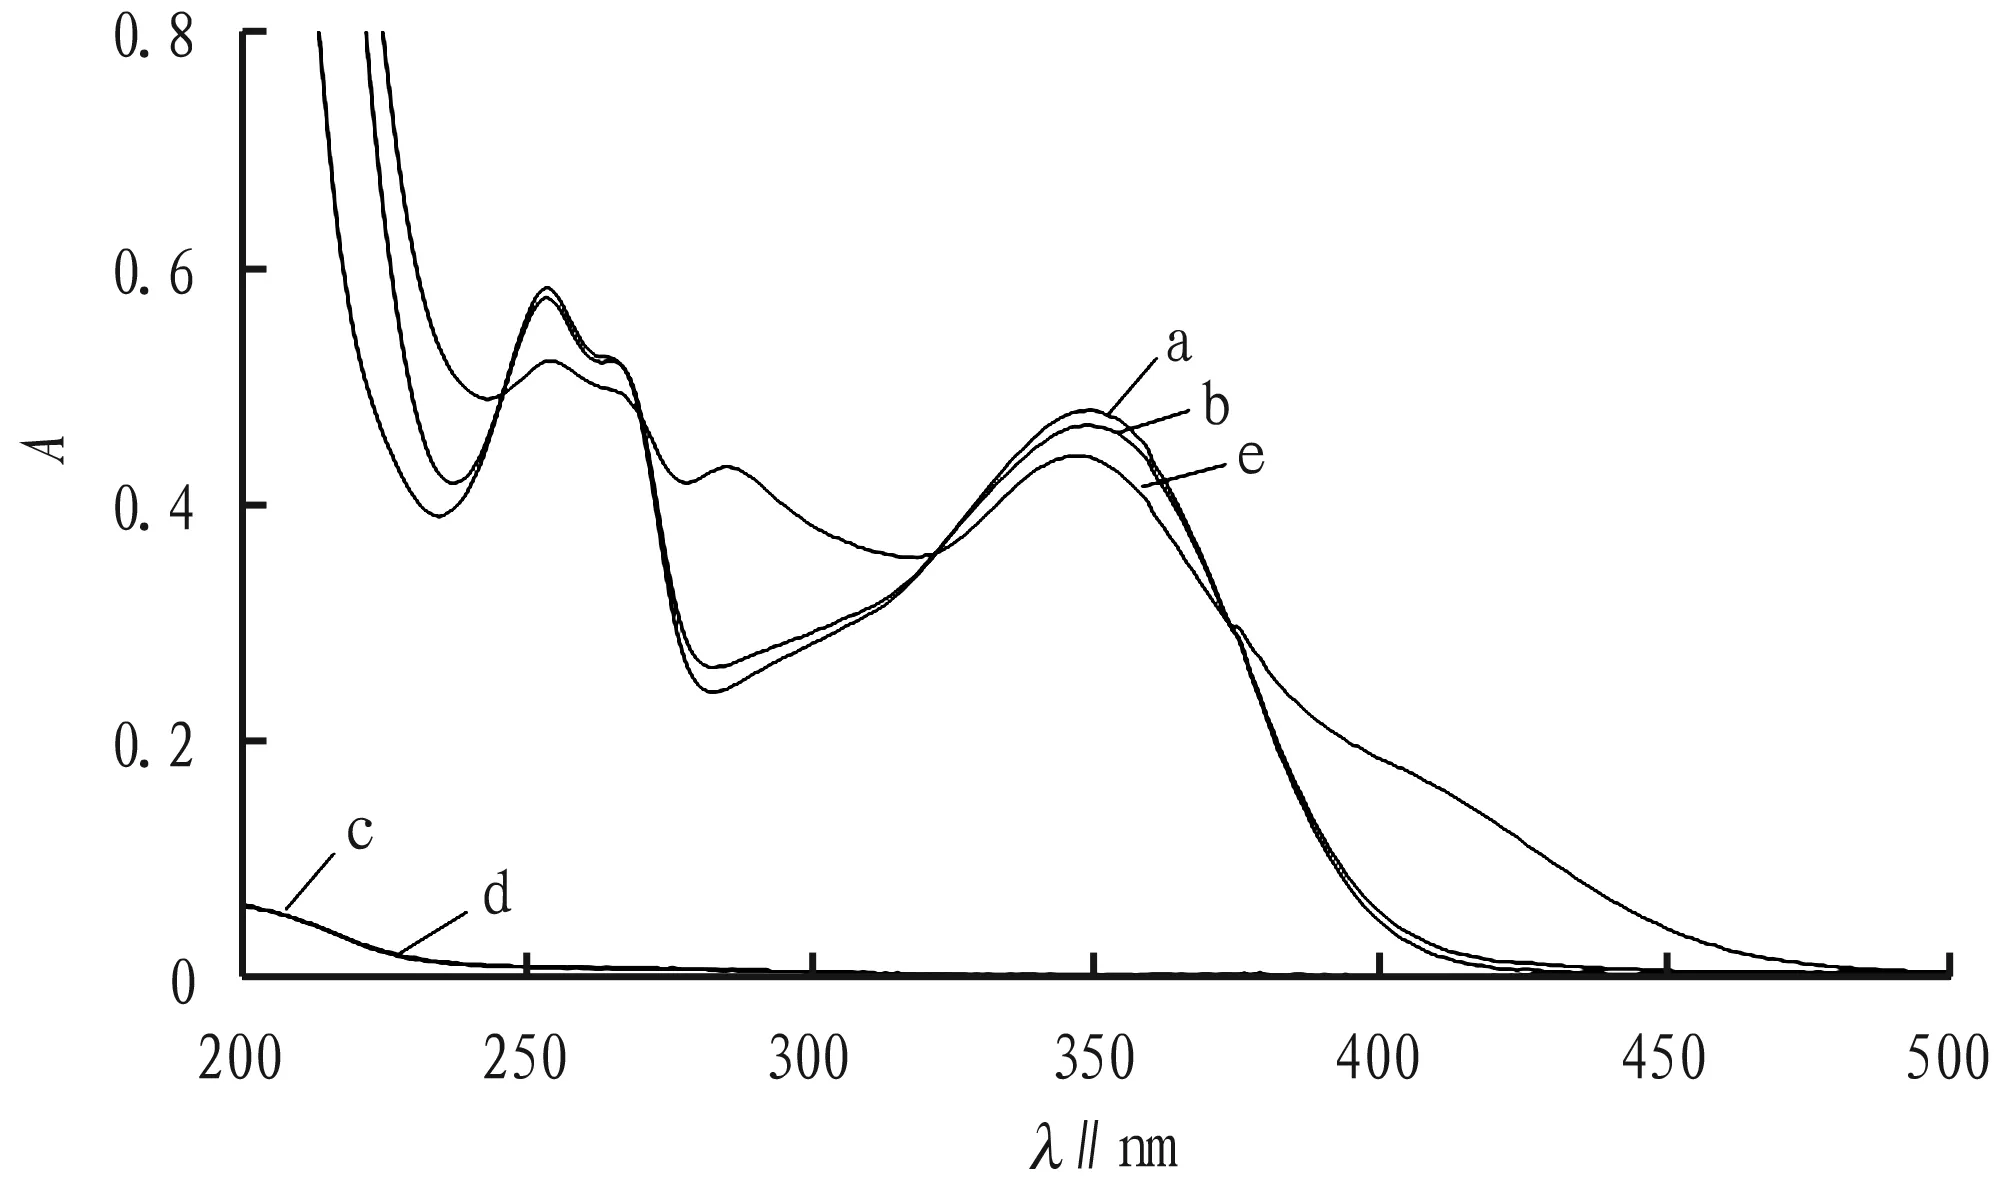
Note: a. troxerutin; b. troxerutin+NaAc-phosphate buffer solution; c. Cu2+solution; d. Cu2+solution+NaAc-phosphate buffer solution; e. troxerutin+Cu2+solution+NaAc-phosphate buffer solution.
Fig.1Absorptioncurvesofdifferentsubstances

Fig.2Absorptioncurveoftroxerutin-Cu2+complex
3.3OptimizationofpH1.00 mL of 2.50×10⁻⁴mol/L troxerutin solution and an equal volume of Cu2+solution are transferred into a 10 mL colorimetric tube. The pH is adjusted with 0.1 mol/L sodium hydroxide solution and hydrochloric acid solution. When pH<5, the mixed solution shows no absorption peak at 408 nm; and when pH is 6-8, the mixed liquid shows an obvious characteristic absorption at 408 nm, indicating that troxerutin-Cu2+complex is formed under the conditions, and the absorbance of the complex increases with increasing pH; when pH ≥ 9, part of Cu2+ions form copper hydroxide precipitation, and OH-competes with troxerutin for Cu2+, resulting in a decrease in the absorbance of the complex. Therefore, pH=8 is chosen for research. The amounts of other reagents are fixed, and solution is prepared according to Section2.3, and NH3-NH4Cl buffer and NaAc-phosphate buffer are added respectively to investigate the effect of buffer solution on the complex. It is found that NaAc-phosphate buffer has less interference with troxerutin-Cu2+complex. The absorption intensity of the complex is greater than that in the NH3-NH4Cl buffer solution, so NaAc-phosphate buffer solution is chosen to adjust the pH. In addition, the effect of NaAc-phosphate buffer on the experiment is investigated.
When VNaAc-phosphateis less than 0.50 mL, the buffer capacity of the solution is insufficient due to the small amount, so the absorption intensity of the complex is unstable; when VNaAc-phosphate=0.50 mL, the absorption intensity of the complex is the largest and stable; and when VNaAc-phosphate>0.50 mL, since the buffer competes with troxerutin for Cu2+, the absorption intensity of the complex decreases with the increase of buffer. Therefore, the amount of NaAc-phosphate buffer is chosen as 0.50 mL.
3.4Influenceofreactiontemperatureandreactiontime1.00 mL of 2.50×10⁻⁴mol/L troxerutin standard solution, 1.00 mL of 2.50×10⁻⁴mol/L Cu2+solution and 1.0 mL NaAc-phosphate buffer are mixed together, diluted to 10 mL in a colorimetric tube and shaken well. Multiple replicates are arranged. Other conditions are fixed, and the colorimetric tubes are bathed in water of different temperatures for 10 min, and then their absorbances are measured immediately after cooled. The results show that when T≤80 ℃, the absorbance of the complex is stable and there is no significant difference. Therefore, it is determined that measurement is performed at room temperature. According to the description in Section2.3, other conditions are fixed, and the reaction time is changed. It is found that with the increase of time, the absorbance of the complex does not change significantly, suggesting that the coordination reaction between troxerutin and Cu2+is rapid and stable. Therefore, solution can be measured immediately after its preparation
3.5OptimizationofreagentadditionsequenceOther conditions are fixed, and the adding order of the reagents is changed: (i) troxerutin, Cu2+solution, NaAc-phosphate solution; (ii) troxerutin, NaAc-phosphate solution, Cu2+solution; (iii) Cu2+solution, NaAc-phosphate solution , troxerutin. According to the experimental method, the absorbance (A) of the complex at 408 nm was measured. The results show that among different addition order, the absorption intensity of the complex rank as (i)>(ii)>(iii), and therefore, the optimal adding order is the follows: troxerutin, Cu2+solution, NaAc-phosphate solution.
3.6InfluenceofinterferenceTroxerutin tablet contains pregelatinized starch, magnesium stearate, microcrystalline cellulose, talc, starch,etc., which may interfere with the experimental determination. Therefore, they need to be investigated. Under the experimental conditions optimized, within the range of relative error of±5%, the same amount of troxerutin solution with the same concentration is measured. The results show that microcrystalline cellulose, magnesium stearate and Mg2+have relatively little interference with the coordination reaction, and the interference of starch and talc are greater. Since starch and talc are insoluble in water, they can be removed by filtration.
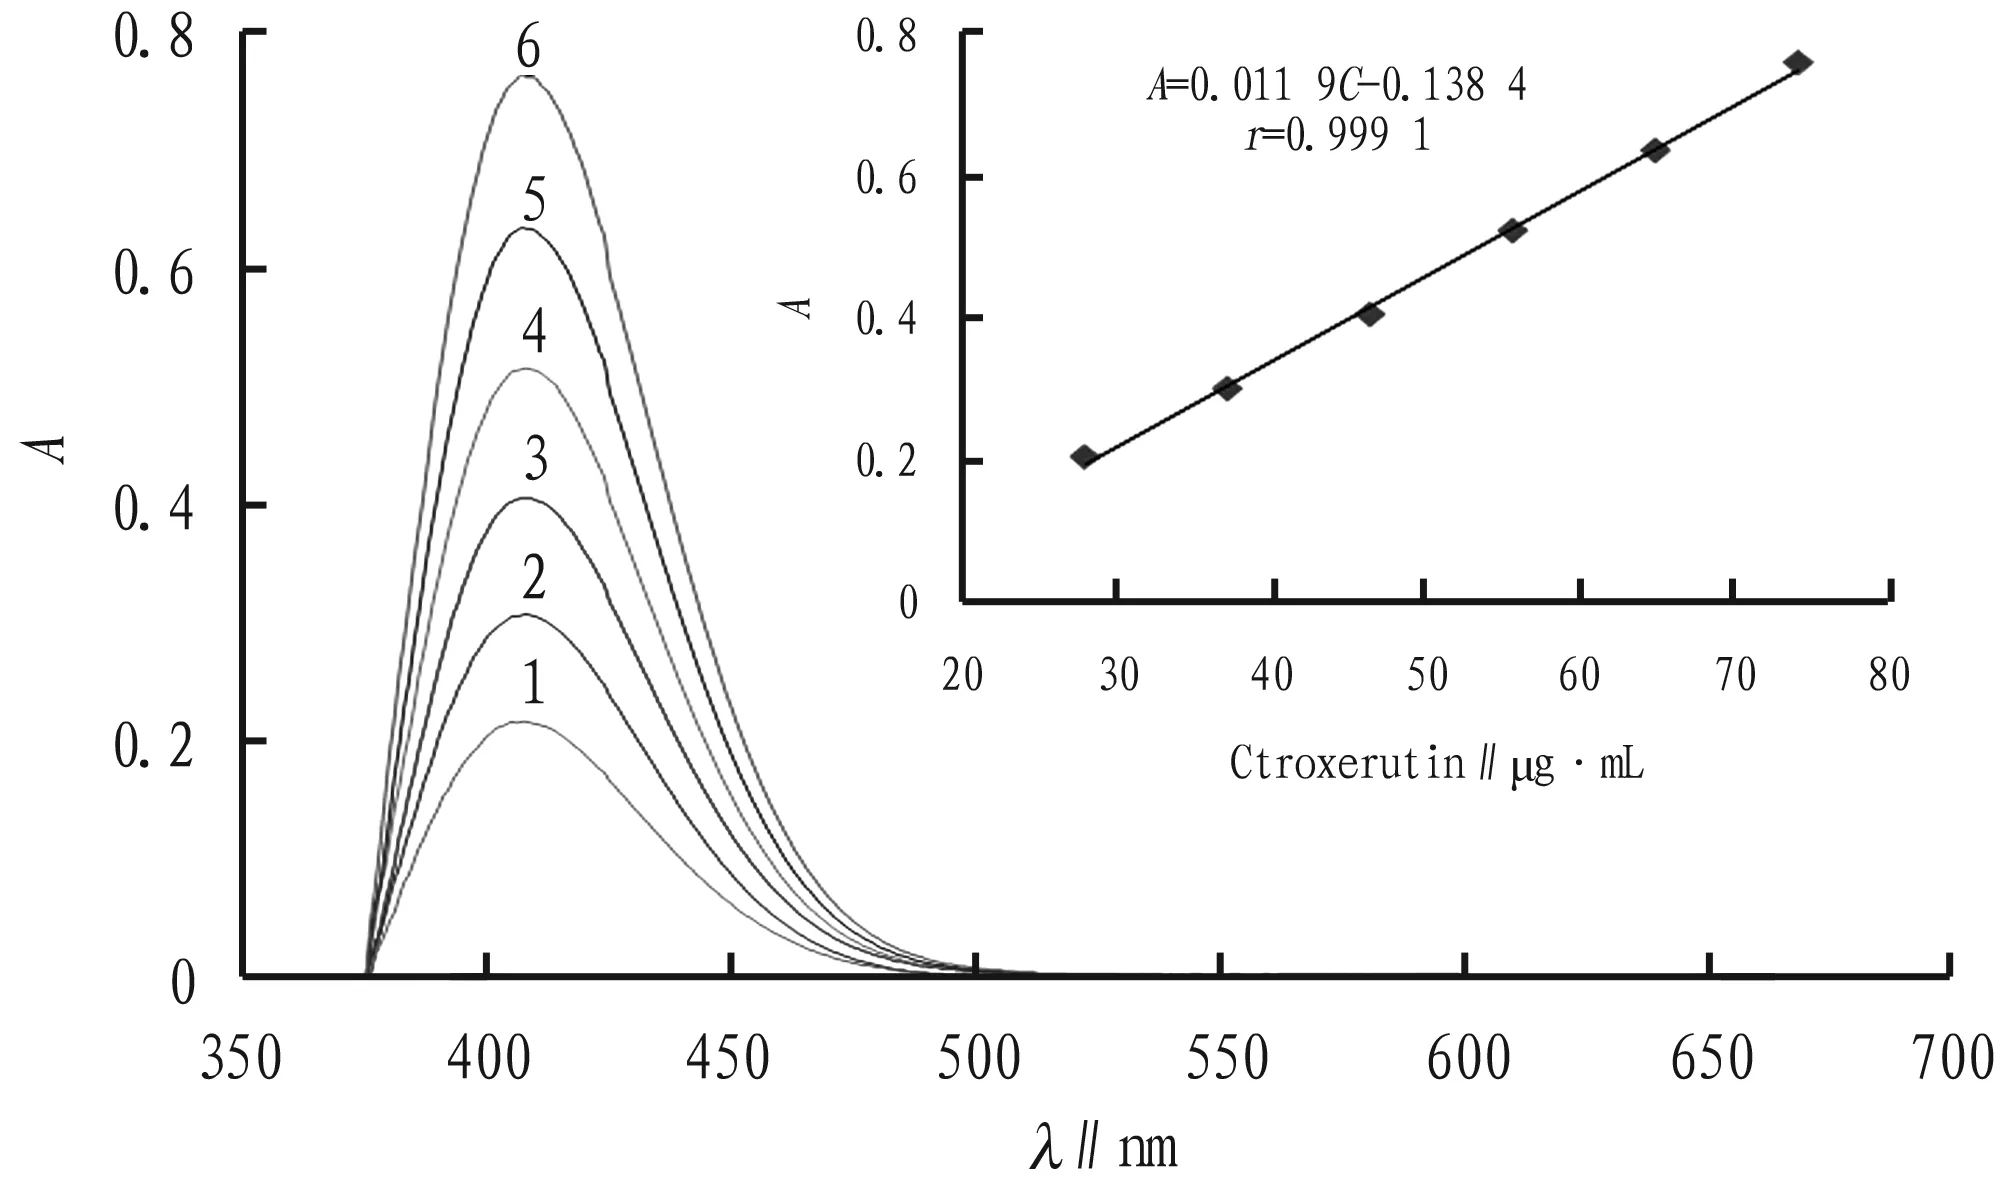
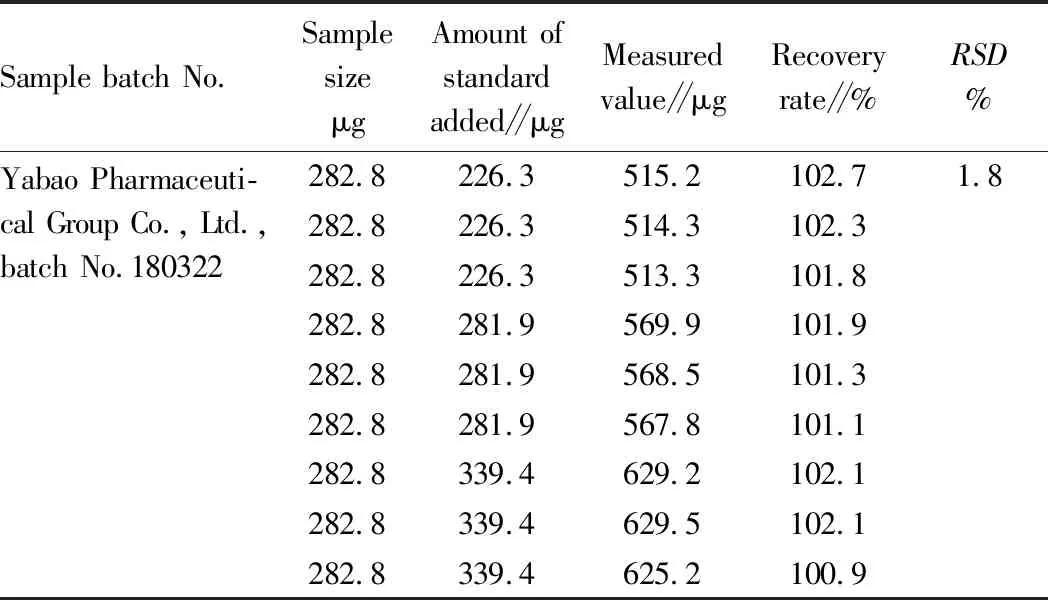
3.7StabilityconstantofcomplexThe amounts of other reagents are fixed, and the amount of troxerutin standard solution is changed to determine the coordination ratio of troxerutin to Cu2+with molar ratio method. As shown in Fig.3, when Ctroxerutin∶CCu2+=2∶1, the coordination reaction is complete and saturated, and at this time,A α=(Amax-A)/Amax, Kstable=CCu2+(1-α) /[αCCu2+(2CCu2+α)2], AsAmax=0.761 andA=0.723, it can be calculated that α= 0.049 9 and Kstable=3.8×10¹⁴. It indicates that troxerutin-Cu2+complex is more stable under these conditions. Fig.3MolarratiooftroxerutintoCu2+inthecomplex 3.8DeterminationoflinearrangeanddetectionlimitAccording to the experimental method described in Section2.3, 1.00 mL of 2.50×10⁻⁴mol/L Cu2+solution and 0.5 mL of pH=8 NaAc-phosphate buffer solution are mixed and added with different volume of 2.50×10⁻⁴mol/L troxerutin standard solution, respectively. The absorbance of the final liquid is measured. Regression analysis is performed between absorbance and concentration of troxerutin solution, and the following regression equation is obtained (Fig.4): A=0.011 9C-0.138 4 (r=0.999 1). The linear range is 27.82-74.19 μg/mL. The molar absorption coefficient (ε) is 7.26×10³L/mol/cm. The detection limit is 1.59 μg/mL. TheRSDis 0.18%. 3.9Samplerecoverytest20 tablets of each of the three commercially available troxerutin preparations are sampled. After weighed accurately, the troxerutin tablets are ground finely. A certain amount of the troxerutin powder, equivalent to 185.5 mg of troxerutin, is transferred to a beaker, added with appropriate volume of distilled water, subjected to ultrasonic treatment until dissolved completely, diluted to 100 mL, and filtered. 10.00 mL of subsequent filtrate is diluted to 100 mL. 2.50 mL of sample 3 solution is taken, and the content of troxerutin is determined according to the method in Section2.3. Accurate volumes of troxerutin standard solution, equivalent to 80%, 100% and 120% of the test sample, are used for the recovery test. The results are shown in Table 1. At the same time, the contents of troxerutin in the three test solutions are determined, the results are shown in Table 2. Note: 1-6, add with 1.50, 2.00, 2.50, 3.00, 3.50 and 4.00 mL of troxerutin of 2.50×10⁻⁴mol/L, respectively. Fig.4Absorptionspectraofcomplexeswithdifferentconcentrations Table1Recoveryoftroxerutinstandard Sample batch No.SamplesizeμgAmount ofstandardadded∥μgMeasuredvalue∥μgRecoveryrate∥%RSD%Yabao Pharmaceuti-cal Group Co., Ltd.,batch No.180322282.8226.3515.2102.71.8282.8226.3514.3102.3282.8226.3513.3101.8282.8281.9569.9101.9282.8281.9568.5101.3282.8281.9567.8101.1282.8339.4629.2102.1282.8339.4629.5102.1282.8339.4625.2100.9 Table2Determinationresultsoftroxerutincontentinthesamples Samplecode.Labeledamountmg/tabletMeasuredvaluemg/tabletEquivalentto labeledamount∥%RSD∥%16058.898.00.7159.699.359.599.126061.3102.20.4460.9101.560.8101.336062.0103.30.5562.5104.262.6104.4 In NaAc-phosphate solution at pH=8, troxerutin can form a stable complex with Cu2+at a ratio of 2∶1, which has a distinct characteristic absorption peak at 408 nm. Based on this, an indirect UV-Vis method is established. The content of troxerutin is determined by measuring the absorption intensity of the complex. The method is easy to operate, non-toxic and low-consumption, and has low detection limit and good reproducibility, and it has achieved good results in the content determination of troxerutin preparations.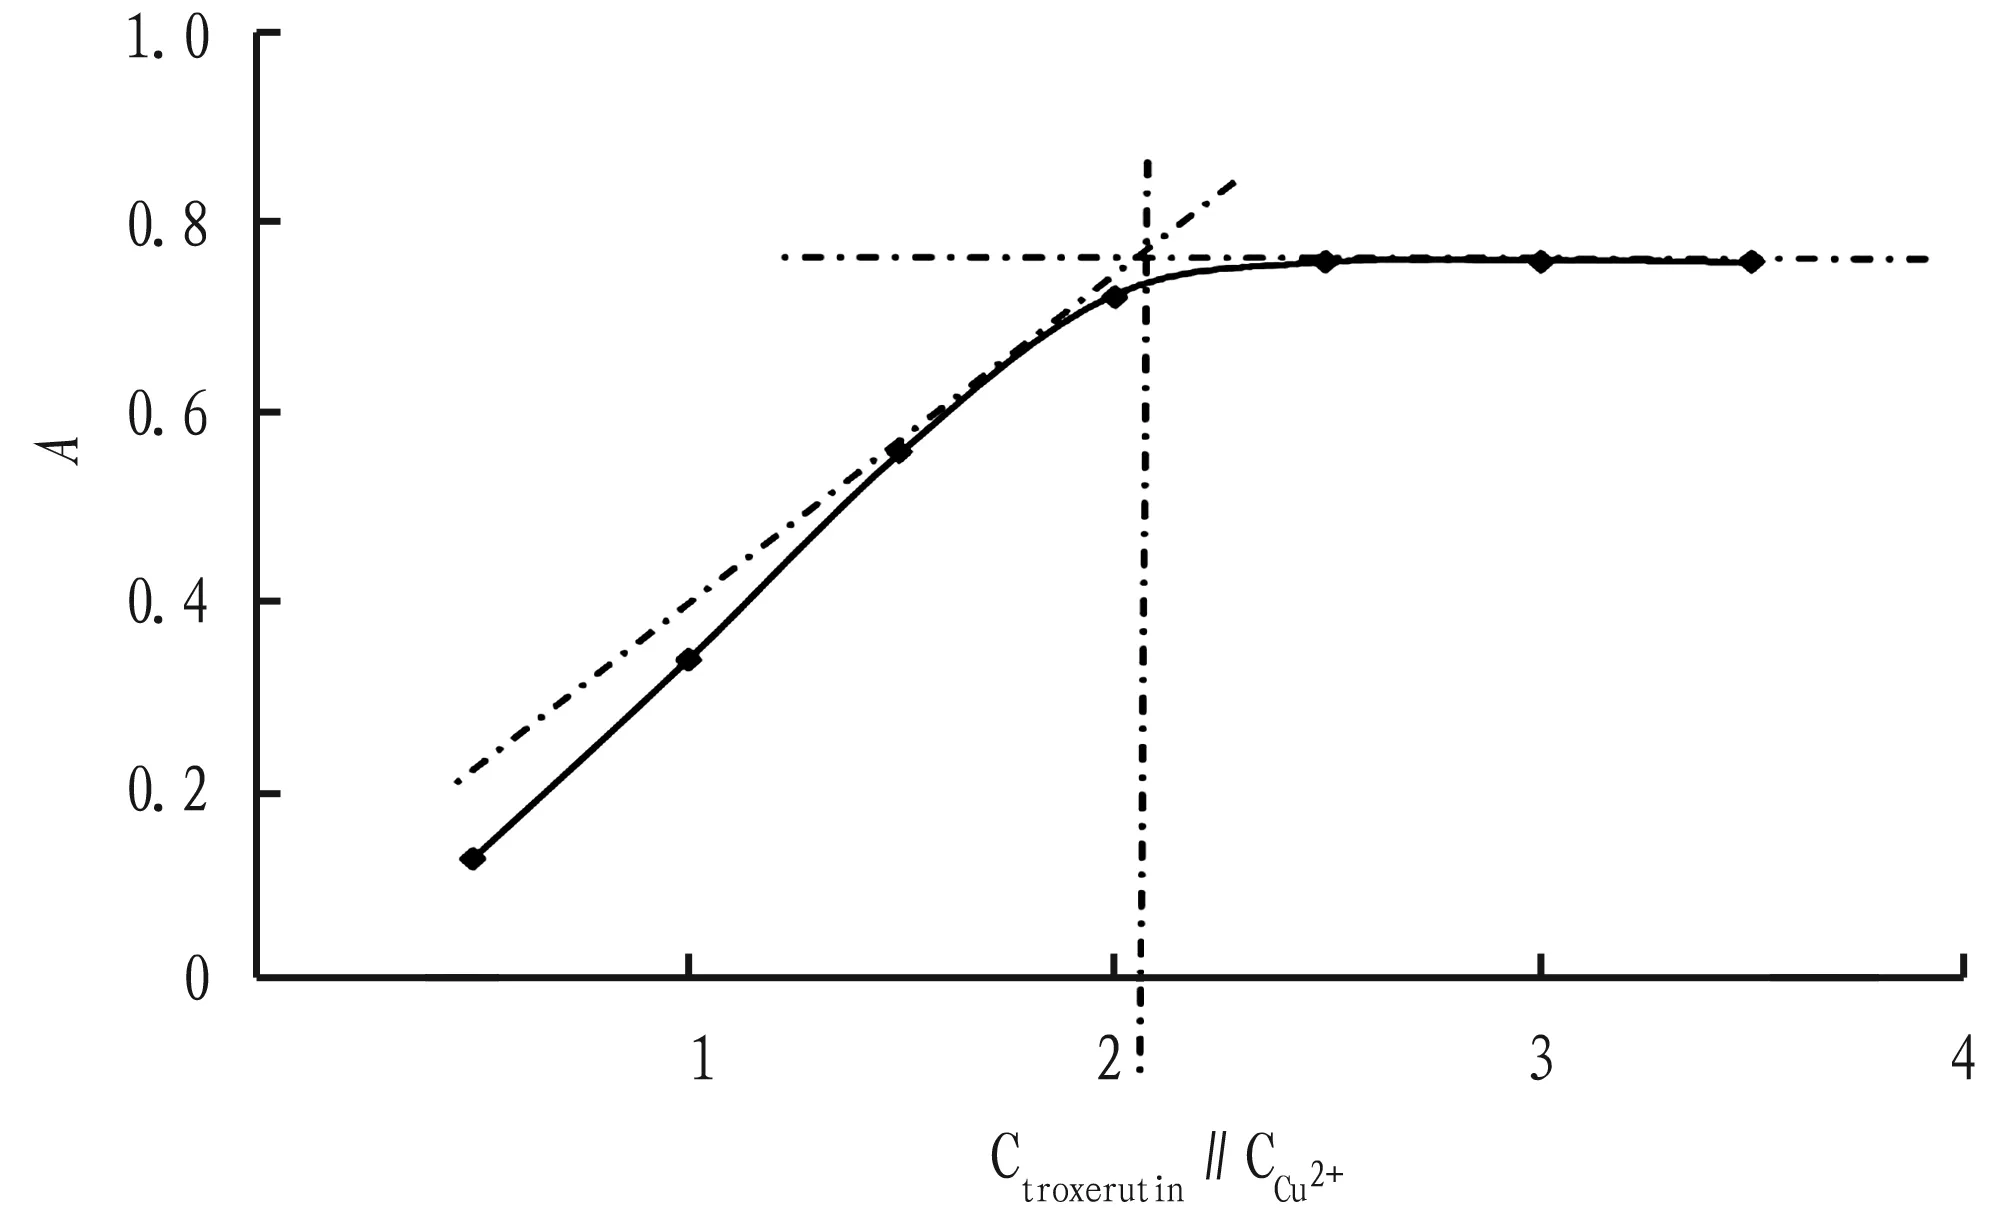

4 Conclusions
杂志排行
Asian Agricultural Research的其它文章
- Organic Connection between Small Farmers and Modern Agriculture Development Based on Farmers’ Cooperatives in China
- Research on the Development of Rural Collective Economy in Shandong Province
- Effects of Partial Replacement of Chemical Fertilizer by Bio-organic Fertilizer Kunyijian on Yield and Quality of Tobacco Leaves
- Progress in Research on Propagation Technology of Machilus Nees
- Effects of Soil Testing and Formulated Fertilization on Yield and Economic Benefit of Major Crops in Burundi
- Application of Genetic Rules of Quality Traits in the Selection of Watermelon Inbred Lines
