Hot deformation of Mg-Y-Zn alloy with a low content of the LPSO phase studied by in-situ synchrotron radiation diffraction
2020-04-29KludiHorvthFktDriDrozdnkoJnpkKristithisDomonkosTolniAndrsStrkGrrdoGrcPtrikDobro
Kludi Horváth Fkt, Dri Drozdnko, Jn Čpk, Kristián Máthis,Domonkos Tolni, Andrs Strk, Grrdo Grcés, Ptrik Dobroň,b
a Department of Physics of Materials, Faculty of Mathematics and Physics, Charles University, Ke Karlovu 5, 121 16 Prague, Czech Republic
b Nuclear Physics Institute of the CAS, 250 68 ˇRež, Czech Republic
cMagnesium Research Center, Kumamoto University, 2-39-1 Kurokami Chuo-ku, 860-8555 Kumamoto, Japan
d Laboratory for Neutron Scattering and Imaging, Paul Scherrer Institute, Villigen PSI, 5232, Switzerland
e Institute of Materials Science, Helmholtz-Zentrum Geesthacht, Max-Planck Str. 1, Geesthacht, D21502, Germany
fDepartment of Physical Metallurgy, CENIM-CSIC, Avenida Gregorio del Amo 8, E-28040 Madrid, Spain
Abstract The compressive deformation behavior of the extruded WZ42 (Mg98.5Y1Zn0.5 in at.%) magnesium alloy containing a low amount of longperiod stacking ordered(LPSO)phase was studied by in-situ synchrotron radiation diffraction technique.Tests were conducted at temperatures between room temperature and 350°C. Detailed microstructure investigation was provided by scanning electron microscopy, particularly the backscattered electron imaging and electron backscatter diffraction technique. The results show that twinning lost its dominance and kinking of the LPSO phase became more pronounced with increasing deformation temperature. No cracks of the LPSO phase and no debonding r at the interface between the LPSO phase and the Mg matrix were observed at temperatures above 200°C. At 350°C, the LPSO phase lost its strengthening effect and the deformation of the alloy was mainly realized by the dynamic recrystallization of the Mg matrix.
Keywords: Magnesium alloy; LPSO phase; Kinking; High temperature; Synchrotron radiation diffraction.
1. Introduction
Considering energy saving and material recyclability,magnesium (Mg) alloys gain interest in the last decades.However, for their wide application, besides the reduction of the tension-compression yield asymmetry, the improvement of the high-temperature performance of wrought Mg alloys is required. Recently, Mg-Y-Zn alloys received significant attention thanks to their excellent mechanical properties at both room and elevated temperatures [1–6]. The addition of transition metals and yttrium (Y) in a ratio of 1:2 leads to a formation of a long-period stacking ordered (LPSO) phase[7], which was found to be beneficial for the strengthening of Mg alloys at ambient temperatures [8–11].
The room temperature (RT) deformation of the Mg-LPSO alloys has been intensively studied earlier, for example in[1–3,5,9–12]. The LPSO phase reinforces the Mg matrix since it has higher hardness and Young´s modulus than that of the Mg [9,13]. It was shown, that the presence of the LPSO phase increases the critical resolved shear stress (CRSS)for the basal slip in the Mg matrix and thus contributes to the strengthening of the alloy [14]. On the other hand, the dynamically recrystallized grains are essential to enhance the ductility of the alloy [1]. Therefore, to find a balance in the volume fraction of the LPSO phase and recrystallized Mg grains is crucial to obtain high strength alloy with reasonable ductility. This idea also motivates our research of the material with a low volume fraction of the LPSO phase.
On the other hand,extruded round bars of Mg alloys have a characteristic texture with basal planes oriented preferentially parallel to the extrusion direction(ED).In extruded Mg-LPSO alloys, the presence of elongated grains having their basal planes parallel to the ED cause a strong basal texture. Such a texture promotes the nucleation of {10¯12} extension twins in the Mg matrix when compressive loading is applied along ED [15,16]. However, in the LPSO phase, twinning is rarely observed and deformation kinking receives high importance to maintain homogenous deformation [2].
At temperatures above 200°C, the CRSS of the non-basal slip systems is reduced [17,18] what compensates the impact of twinning. At the same time, Oñorbe et al. [6] have shown that the hardening effect of the LPSO phase during tensile testing is effective up to 523K (250°C). Moreover, the delay or restriction of the dynamic recrystallization due to the presence of the 18R LPSO phase in Mg-Zn-Zr-Y alloys was observed by several authors [19,20]. Nevertheless, the role of the LPSO phase during high-temperature compression of Mg-LPSO alloys is still unclear.
The above-mentioned results were mainly observed in alloys with at least 2 at.%of Y and/or rare-earth(RE)elements.However, there is a new policy proposal in Europe, the USA,and Japan [21] to reduce the content of the RE since their future availability is not guaranteed. The present study is focused on the investigation of hot deformation behavior and resulting microstructural evolution of an Mg-Y-Zn alloy with a reduced Y content and therefore, with a low content of the LPSO phase. To investigate the active deformation mechanisms in-situ synchrotron diffraction measurements were carried out. In addition, in order to get more information about the evolution of twinning, the postmortem characterization of samples after 2% of the plastic strain was provided by scanning electron microscopy.
2. Materials and methods
The WZ42 (Mg+3.5wt.% Y+1.6wt.% Zn, or Mg98.5Y1Zn0.5in at.%) magnesium alloy with an addition of 0.5wt.% of CaO was cast in the Korea Institute of Industrial Technology (KITECH). The cast billet of the master ingot was extruded with a speed of 0.5mm/s and a ratio of 18:1 at 350°C in Centro Nacional de Investigaciones Metalúrgicas (CENIM) Madrid.
For the compression experiments, cylindrical specimens with a diameter of 5mm and a length of 10mm were fabricated along ED. The in-situ synchrotron radiation diffraction measurements were carried out at the P07 beamline of Petra III, DESY (Deutsches Elektronen-Synchrotron). A monochromatic beam with the energy of 98.5keV (λ=0.01258nm)and with a cross-section of 1×1 mm2was used. To collect the diffraction patterns a PerkinElmer XRD1621 flat panel detector with a pixel size of (200μm)2was placed at a sample-to-detector distance of 1621mm from the specimen.The acquisition time for each image was 1s.A standard LaB6powder sample was used to calibrate the diffraction data. The specimens were placed in the chamber of a dilatometer DIL 805A/D (TA Instruments) combined with a modified heating induction coil in order to enable the beam passing only through the sample [22]. The specimens were compressed at RT, 200°C, 300°C, and 350°C with an initial strain rate of 10−3s−1in the air without any protected environment.For the tests at elevated temperatures, the specimens were heated to the test temperature at a rate of 30°C/s and held for 3min before the compression start to ensure temperature homogeneity. The tests were terminated at an engineering strain of 30%. The Debye-Scherrer rings were transformed into diffraction line profiles using the Fit2D® software [23].Afterward, to determine the peak position and its intensity the acquired data were fitted using the Gaussian function and Wolfram Mathematica software.
Samples with the same dimension were compressed using a universal testing machine INSTRON® 5882 up to 2%of strain in order to study deformed microstructure after the yielding. At least three samples were deformed at each temperature together with the sample deformed at the synchrotron facility. The difference in the measured yield stresses was around ±2MPa.
For microstructure investigation,the middle part of the longitudinal section of the extruded bars was used. The sample surfaces were polished by standard methods down to a particle size decreasing down to 0.25μm. Prior to the electronbackscattered diffraction (EBSD) measurements, the surface of the samples was finally ion-beam polished using a Leica EM RES102 system. EBSD measurements were conducted in a scanning electron microscope (SEM) FEI Quanta at a working distance of 13mm with a step size of 0.4μm and an acceleration voltage of 15kV. For the EBSD data, a confidence index (CI), as a degree of confidence that the orientation calculation is correct, was used [24]. Moreover, based on the EBSD data, the evaluation of misorientation parameters within each grain can be calculated. One of these parameters, namely the grain orientation spread (GOS), is used in the present work. The characteristic calculation is based on the values of the misorientation angles between pixels for the specific grain. For the grain i, the GOS is calculated as:

where J(i) is the number of pixels in the grain i, and ωijis the misorientation angle between the orientation of pixel j and the mean orientation of grain i [25]. The high GOS value indicates a grain distortion as the result of the deformation of the material [25]. Thus, this approach is useful for separate the deformation-free recrystallized grains with low GOS value from non-recrystallized grains having high values of GOS.
3. Results
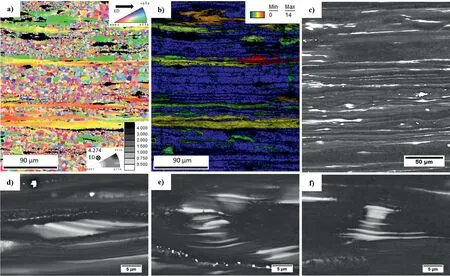
Fig. 1. Initial microstructure of the WZ42 alloy: (a) OIM of the longitudinal section with the orientation triangle and the calculated texture in the form of inverse pole figure (IPF) in the ED; the scale of the texture intensity is carried out as the multiples of a random density (m.r.d.) from 0 to 4.000 with a maximum intensity of 4.274m.r.d.; (b) GOS map with GOS scale in the upper right corner; (c) BSE image; (d–f) detailed BSE images of the LPSO phase.
The orientation image map (OIM), texture in form of the inverse pole figure (IPF), the GOS map and back-scattered electron (BSE) image of the WZ42 alloy in the as-extruded state are presented in Fig. 1. The Mg matrix is characterized by a bimodal microstructure, which consists of worked grains elongated along ED and of fine recrystallized grains. The elongated grains have a strong basal texture with the basal planes oriented parallel to ED, while recrystallized grains are more randomly oriented. In general, the alloy exhibits a texture with the c-axis perpendicular to ED. The dark areas in Fig. 1a and b correspond to places with a CI < 0.1 for Mg crystallography structure, i.e. the OIM system cannot confidently analyze the Kikuchi-diffraction pattern and correlate these to the Mg phase. By comparing the results obtained by the EBSD technique with those of SEM, it was confirmed that the dark regions correspond to the LPSO phase. The LPSO phase elongated along the ED is represented by white contrast in the BSE image (Fig. 1c). As it is shown in the high-magnification BSE images (Fig. 1d–f.), different shapes and sizes of the LPSO phase can be observed. It is clearly seen that the LPSO phase fractions are dispersed in the microstructure. Neither kinks nor cracks were identified in the LPSO phase in the as-extruded condition.Some TEM analysis(not presented here) revealed that there are regions with not fully grown LPSO phases (block-shaped), but rather stacking faults dispersed in the grain interior. In case of block-shaped LPSO phase, the majority of them were identified as the 18R polytype[26].Several BSE images were analyzed by software ImageJ to measure the volume fraction of the LPSO phase,which was estimated to be around 10%.
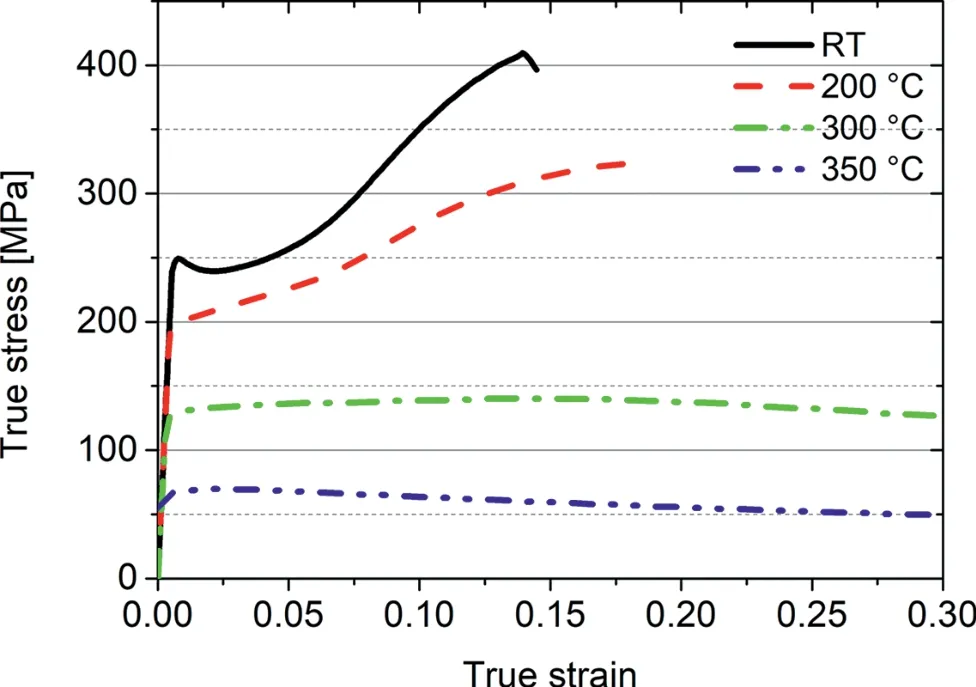
Fig. 2. True strain-true stress deformation curves of the WZ42 alloy deformed at RT, 200°C, 300°C, and 350°C along the ED.
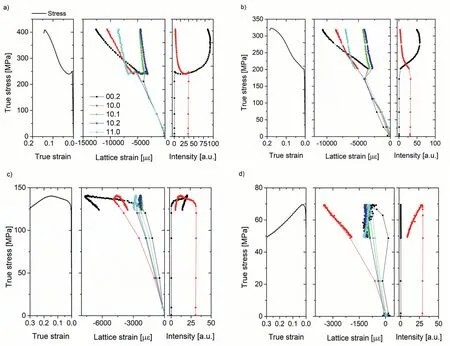
Fig. 3. Macroscopic stress-strain curves, the axial lattice strains as a function of the applied stress and evolution of the intensity of the major diffracted peaks of the Mg matrix during the compression test of the WZ42 alloy at (a) RT, (b) 200°C, (c) 300°C, and (d) 350°C.
The true stress-true strain deformation curves obtained at RT, 200°C, 300°C, and 350°C are shown in Fig. 2. The yield stress decreases with increasing deformation temperature and the shape of the deformation curves changes. The yield stress of the WZ42 alloy is 248MPa, 196MPa, 130MPa, and 69MPa for deformation at RT, 200°C, 300°C, and 350°C,respectively.At RT and 200°C,the alloy undergoes significant strain hardening resulting in a concave, so-called S-shaped,deformation curve. With further increase of temperature, the hardening slope decreases. The sample deformed at 300°C is characterized by hardening up to 15% of strain. However,the hardening slope is significantly lower comparing to the one at 200°C. With further loading softening takes place.The deformation curve at 350°C has a convex shape: after reaching the yield stress, a dynamic softening is observed.
The deformation curves, the evolution of the lattice strains on the Mg planes in the axial direction and change of the intensities for the (0002) and {10¯10} peaks as a function of the applied stress are shown in Fig. 3a–d for RT, 200°C, 300°C,and 350°C, respectively. Due to the diffraction geometry, the grains with their plane-normal oriented along the loading direction contribute to the data in the axial direction. However,the grains contributing to the given diffraction peak in the radial direction could be oriented at any rotational angle with respect to the loading axis [27]. Therefore, it is impossible to analyze the data obtained in the radial direction without micromechanics modeling. On the other hand, the information obtained in the axial direction can be in reasonable approximation analyzed and discussed without modeling. This is the main reason why the data obtained from the axial direction is used in the present study.
Since the diffraction peaks of the LPSO phase are very close to those of the Mg, and thanks to the basal texture characteristic for both the Mg matrix and LPSO phase and to the low volume fraction of the LPSO phase present in the material, no LPSO peaks can be fitted from the synchrotron radiation diffraction data.Therefore,presented diffraction data corresponds to the Mg matrix.
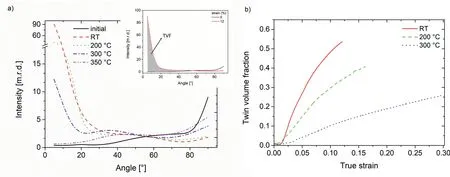
Fig 4. (a) The axial distribution function variation for the (0002) pole in the as-extruded (initial) state and after compression at RT, 200°C, 300°C, and 350°C for the WZ42 alloy; (b) the calculated twin volume fractions as a function of the applied strain for compression at RT, 200°C, and 300°C.
During RT deformation, the lattice strains on the {10¯11}- and {10¯12} planes oriented parallel to the loading direction lose their elastic linearity in the vicinity of the macroscopic yield point. The lattice strain on the (0002) plane loses its elastic linearity below the macroscopic yield point, around 209MPa, see Fig. 3a middle plot. During microyielding, the absolute value of the (0002) lattice strain decreases, while after the macroscopic yield point a linear increase with a slope lower than that in the elastic regime is observed. The lattice strain on the {11¯20} plane increases intensively after reaching the macroscopic yield point. The intensive strain hardening of the alloy slightly increases the slope of the lattice strain curve compared to the elastic regime. The intensity of the(0002) peak increases slightly in the microyielding region (till 250MPa)followed by a large increment after the macroscopic yield point, Fig. 3a right plot.
At 200°C, the lattice strains on the {10¯11} - and {10¯12}planes lose their elastic linearity between 175 and 200MPa,similarly to that observed at RT. However, the behavior of the (0002) peak is different from that at RT. No deviation from the linearity below the macroscopic yield point is observed neither in the lattice strain nor in the intensity. After the yielding, the (0002) intensity increases. In both cases, RT and 200°C, at the later stage of deformation the intensity of the (0002) peak slightly decreases.
At 300 °C, the lattice strains on the {10¯11}– {10¯12} conjugated planes deviate from the ideal elastic response virtually in the macroscopically elastic deformation range. The absolute value of the lattice strain on the (0002) plane increases until a strain around 15%. Up to this point, a hardening of the alloy is observed.Afterward,softening takes place and the absolute value of the lattice strain of the (0002) plane starts to slightly decrease. At 300°C, the peak intensity changes for the (0002) peak is similar to that at lower temperatures, i.e.there is an intensity increase at the initial stage of the deformation, followed by a decrease when the maximum stress value is reached. The drop of (0002) intensity in the softening stage is sharper than that at RT and 200°C most probably due to significant kinking, as it is shown in the discussion.The lattice strains on the {10¯11}, {10¯12}, and {11¯20} planes are nearly constant during the plastic deformation.
At 350 °C, after reaching the yield point, the alloy undergoes significant softening and the absolute value of the lattice strain on the {10¯10} plane decreases. Only the absolute value of the lattice strains on the (0002) and {11¯20} planes show a slight increase. Contrary to the deformation at low temperatures, the intensity of the (0002) peak is nearly constant during the entire deformation at 350°C.
Fig.4.a shows the axial distribution function for the(0002)peak before the deformation (in the as-extruded state) and at 13% of strain at RT, 16% of strain at 200°C and at 30% of strain at 300°C and 350°C. The axial distribution function is a cut through the pole figure at a line from the center to the perimeter, thus the x-axis (angle) represents the tilt from the loading direction (0° is along the ED). In the initial state, the intensity of the (0002) peak is concentrated at 90°(radial direction). With the ongoing deformation, the intensity at 90°decreases while a strong increase at 5°(axial or loading direction) is observed at RT and 200°C. A similar tendency is observed at 300°C, but the change in the intensity is much smaller, compared to tests at lower temperatures. Moreover,a local maximum around 40° is formed. The evolution of the (0002) diffraction peak during deformation at 350°C is completely different from the previous cases. The intensity in the axial direction does not increase, and intensity in the radial direction decrease in expense of a steadier distribution of the intensity within 20–90° range.
The calculated twin volume fractions (TVF) are plotted in Fig. 4.b. The TVF is determined by the integration of the area under the axial distribution function of the (0002) peak till the cross-over point, which is always texture specific (see the inserted graph in Fig. 4.a) [28]. The details of the TVF calculations are described in [28–30]. The calculated TVF of the Mg matrix at RT deformation is 55%, at 200°C–40%,and at 300°C–26%.The TVF at 350°C cannot be calculated since there is no sign in the intensity change of the {10¯10}–(0002) conjugated planes related to extension twinning. The calculation of the TVF with this method assumes that the change in the texture is the result of the extension twinning,which well applies at RT and 200°C. On the other hand, at 300°C, the additional local maximum at 40° is the result of another mechanism, which will be discussed later. Therefore,the calculated TVF is rather the upper limit of the real TVF present in the material.
The microstructure deformed at RT up to 2% of plastic strain and till fracture is presented in Fig. 5a and b, respectively.In the sample deformed till 2%of strain a lot of narrow twins can be observed, not only in the elongated grains but also in the recrystallized grains well oriented for the activation of extension twins. The boundaries of the {10¯12} extension twins are plotted also in Fig. 5a. The activation of this twin system is also obvious from the calculated IPF (lower right corner of Fig. 5a), where an intensity at the (0001) pole is formed. With further deformation, the twins proceed to develop and after fracture, the whole elongated grains are reoriented by nearly 90° resulting in the strong texture component at the (0001) pole, Fig. 5b. No other twin type was observed in the alloy. From the GOS map (Fig. 5b), it can be assumed that the deformation is homogeneously distributed in the recrystallized grains, while in the elongated grains relative high deformation is stored.
The microstructure deformed up to 2%of plastic strain and till fracture at 200°C is shown in Fig. 5c and d, respectively.Compared to the RT deformation, fewer twins are formed in the recrystallized grains. The final texture is similar to that at RT but with a lower intensity.
At 300°C after the yielding, shown in Fig. 5e, twins are observed only in the elongated grains, which leads to the formation of the texture component at the (0001) pole. However,after 30% of deformation (Fig. 5f), this texture component is not the dominant one anymore. The intensity is distributed along the ring from (10¯10) to (2¯1¯10) pole. In the GOS map,shown in Fig. 5f, some deformation free grains (color-coded as blue) can be observed. The volume fraction of the grains with GOS < 1° is 18%.
At 350°C, no twins were observed in the microstructure(Fig. 5g and h). The texture of the sample deformed to 30%of strain is significantly weaker than that after the extrusion.In the GOS map, besides a high fraction of recrystallized grains with low internal strain, some large grains with high deformation can be found. The volume fraction of the grains with GOS < 1° is 38%.
BSE images of the deformed samples were analyzed to obtain information about the deformation of the LPSO phase,see Fig. 6. Each sub-figure was chosen (from a number of images at different places) to be representative from the point of view of the observed deformation mechanism. Therefore,although the images presented in Fig. 6. may indicate a variation of the morphology of the LPSO phase as the result of the temperature, it is rather the result of the scale of the SEM observations. Previous research has shown, that the 18R polytype of the LPSO phase remains stable during heating up to 500°C [8,31–33]. It was a case of the alloy with high amount of LPSO phase. Therefore, it was concluded that in present investigated alloy, the high temperature deformation should not change the structure of the LPSO phase.
After the RT deformation, a lot of micro-cracks, marked by red arrows in Fig. 6, were found in the LPSO phase.On the other hand, no kinks (the most reported deformation mode of the LPSO phase) were found in the microstructure.In the sample deformed at 200°C,both kinks and cracks were discovered throughout the microstructure. At 300°C, kinking was the main deformation mode revealed by BSE images. In the case of deformation at 350°C, only a few kinks were observed. No cracks or debonding of the LPSO phase during compressive deformation up to 30% at temperatures above 200°C were found.
4. Discussion
The basal texture formed during extrusion is not surprising since this kind of texture was observed in extruded Mg alloys containing only α-Mg as well as in Mg alloys with the LPSO phase [5,6,9,11,34]. The observed bimodal microstructure of the Mg matrix occurs very probably due to the low extrusion speed of 0.5mm/s [35].
The plastic deformation is usually connected to the loss of the linearity of the lattice strains. At RT, the lattice strains on the {10¯11} and {10¯12} planes oriented parallel to the loading direction, lose their elastic linearity at the macroscopic yield point. These grains have a high Schmid factor for the basal slip [36], thus, it is expected that the macroscopic yielding is controlled by the operation of basal dislocation slip. At the same time, the Schmid factor of the prismatic slip is 0.34, therefore its contribution cannot be excluded. However,the lattice strain on the (0002) plane loses its elastic linearity already below the macroscopic yield point. These planes are oriented parallel to the axial axis, i.e. loading axis, thus,the Schmid factor for the basal slip is zero for these grains.Consequently, the deformation should proceed by the activation of the non-basal slip or extension twinning. Extension twins rotate the crystal lattice by 86.3°, which increases the intensity of the (0002) diffraction peak and the concurrent decrease of the intensity of the {10¯10} diffraction peak in the axial direction [37]. The heavy increase of the intensity of the (0002) indicates a significant role of extension twinning in strain accommodation. The concave (i.e. S-shaped)deformation curve also indicates the twinning activity. After the yielding, the lattice strain on the {11¯20} planes deviates to negative values from the linear response. In these grains,the activation of basal slip (having zero Schmid factor) and twinning are rather difficult. It was shown by Angew et al.[38] that the non-basal prismatic slip can be activated in these conditions. The microscopic findings, Fig. 5a and b, well support the diffraction results. At 2% of plastic strain, extension twins are found not only in the elongated grains but also in the recrystallized ones. Therefore, it can be summarized that twinning plays a key role in strain accommodation. Although the elongated grains begin to deform before the recrystallized ones, their volume fraction is lower compared to the recrystallized ones and thus,the macroscopic yielding of the sample is controlled by the basal slip in the randomly oriented recrystallized grains. At the later stage of deformation (around 350MPa), the intensity of the (0002) peak slightly decreases,while the absolute value of the lattice strain continues to increase. This behavior is most likely linked to the rotation of these grains as the result of the operation of
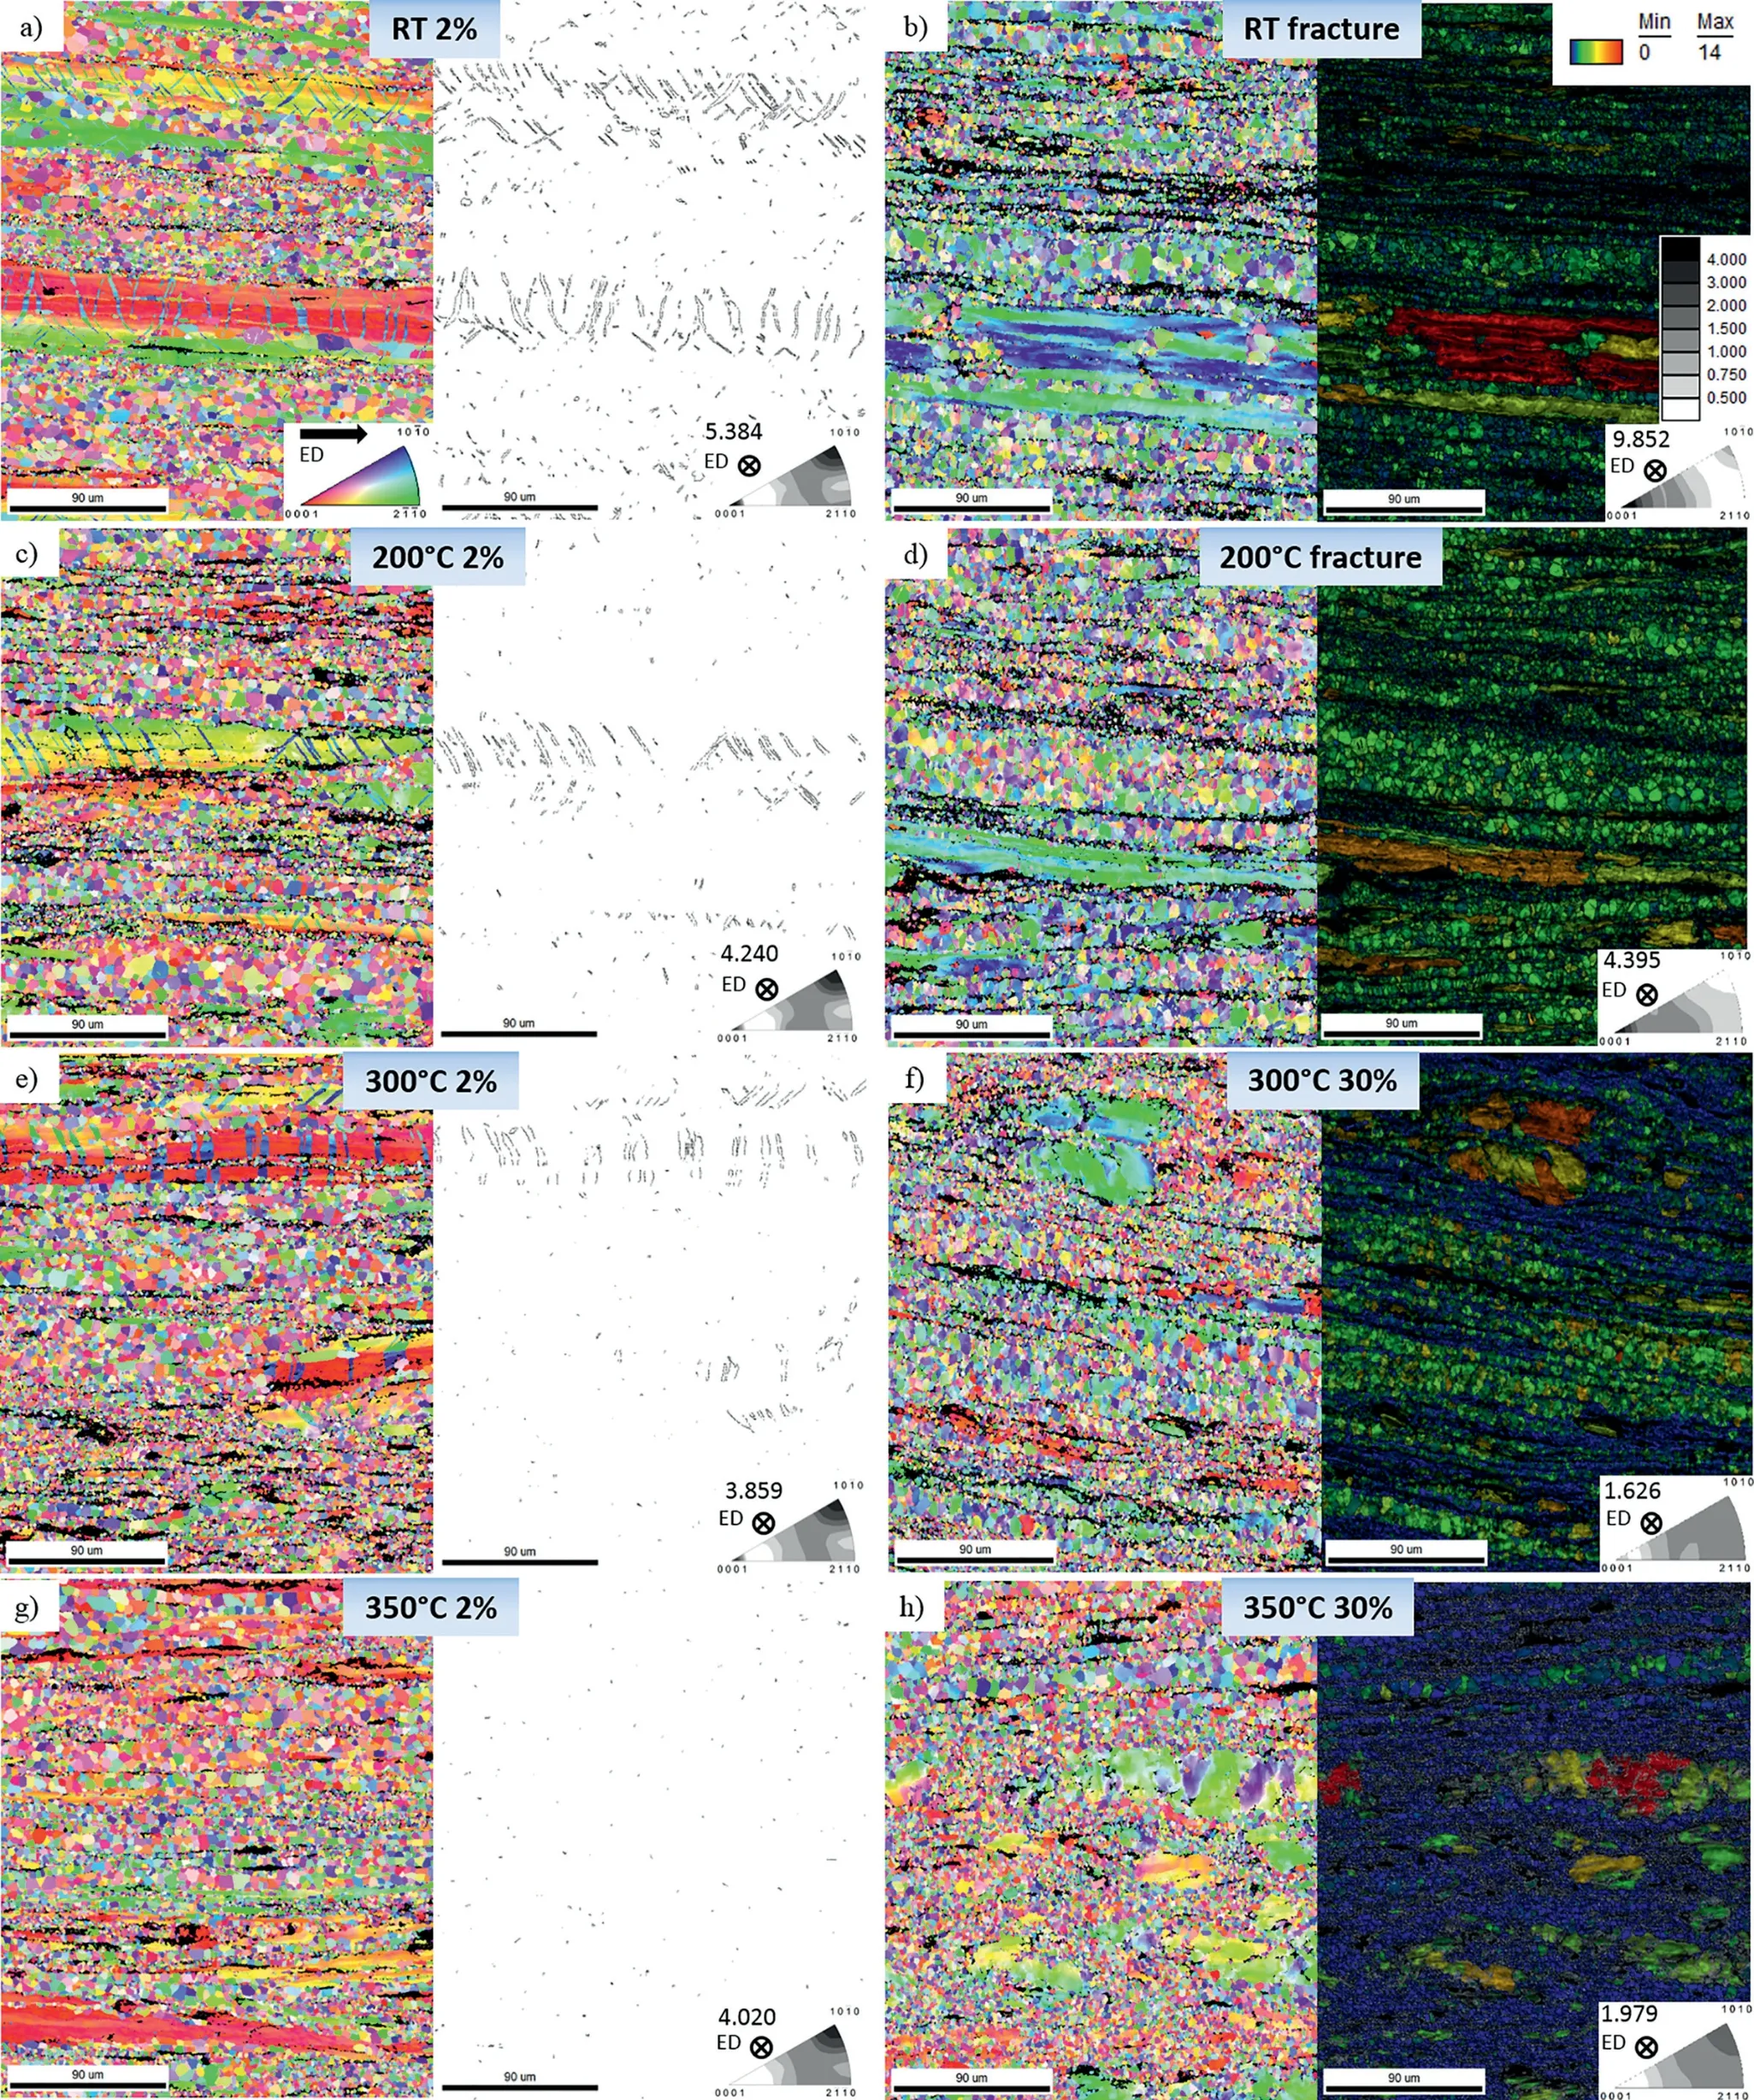
Fig. 5. The OIMs, the corresponding map with marked extension twin boundaries and calculated texture (IPF) for the WZ42 alloy deformed up to 2% of strain at (a) RT, (c) 200°C, (e) 300°C, and (g) 350°C. The OIM of the alloy deformed till fracture at (b) RT, (d) 200°C and up to 30% of strain at (f) 300°C,and (h) 350°C with the corresponding GOS map and calculated texture. The scale of the texture and the GOS scale is depicted in the upper right corner. The numbers in the IPFs mark the maximum texture intensity as the multiple of random density (m.r.d.).

Fig. 6. BSE images after the deformation till fracture at (a) RT, (b) 200°C and up to 30% of strain at (c) 300°C, and (d) 350°C. The red arrows mark the cracks of the LPSO phase while the red circles mark the deformation kinks.
At 200°C,similarly to deformation at RT,the lattice strains on the {10¯11} and {10¯12} planes lose their elastic linearity at the macroscopic yield point which indicates the involvement of the basal slip in strain accommodation. Contrary to RT, at 200°C no evidence of the microyielding was observed, see Fig. 3b. However, after the yielding the evolution of the intensities of the (0002) and {10¯10} diffraction peaks and the redistribution of the (0002) peak in Fig. 4a indicates a strong twinning activity. It is also proved by the microscopic observation including texture development during the deformation.The involvement of a
The convex shape of the compression curve, observed at 300°C, is a typical sign for the dislocation-dominated deformation. The observed strain hardening could be the result of the increasing number of obstacles, such as forest dislocations or twin boundaries, for free dislocation motion.Extension twinning still plays some role at the beginning of the plastic deformation, as reflected in the evolution of the intensities of the {10¯10} −–(0002) conjugated planes.However, its change is much smaller compared to that at lower temperatures. The presence of the extension twins in the elongated grains was confirmed by the EBSD analysis in Fig. 5.e. On the other hand, the CRSS value for
As expected from the synchrotron diffraction results, especially form the intensity changes, at 350°C, no twinning is observed in the microstructure (Fig. 5g and h). On the other hand, in the GOS map, a high fraction of recrystallized grains free of deformation can be found. It is in good agreement with the results shown in Fig. 4a, where the axial distribution function of the (0002) peaks intensity is more random, compared to the previous cases. Moreover, the decrement of the absolute values of the lattice strains after the yield point also suggests the domination of the dynamic recrystallization.
The recrystallization process can be discussed based on obtained EBSD data and its analysis, particularly GOS maps[47]. The initial microstructure of the investigated alloy(Fig.1).represents high fraction of recrystallized grains.After deformation at RT (Fig. 5b) and 200°C (Fig. 5d) microstructure is characterized by only high value of GOS.With increasing deformation temperature, microstructure of investigated alloy after 30% of strain at 300°C and 350°C (Fig. 5f and h,respectively) represent fraction of grain with low GOS, what is the results of dynamic recrystallization process during high temperature deformation. Moreover, the fraction of the initial coarse grains was reduced due to the continuous dynamic recrystallization.During this type of recrystallization new grains are formed progressively within the deformed original grains from a continuous increase of subgrain boundary misorientations, as a result of the dislocation accumulation in low angle boundaries. A nice example can be seen in Fig. 5h, where the initial green grain and purple parts are separated by low angle grain boundaries. However, the microstructure was observed only after 30% of deformation, it is challenging to extract the dynamic recovery process. For more detail analysis of dynamic softening further investigation should be performed,which is beyond the scope of the present work.
It is obvious that at RT the deformation proceeds mainly in the Mg matrix. Further, with increasing deformation temperature the preference in deformation area transfers from the Mg matrix in case of RT to the LPSO phase at higher temperatures. The activation of kinking deformation becomes more likely with increasing temperature. According to Matsumoto and Uranagase [48], a large number of edge dislocations generated on the basal plane as a result of cross-slip of prismatic dislocation is needed for kink band formation. The increase of the test temperature decreases the CRSS of the non-basal systems and therefore, it can explain the favor of the kinking process at elevated temperatures. On the other hand, at 350°C, only a few kinks were observed.It was already reported previously [6,45,49] that the LPSO phase loses its strengthening effect at temperatures over 250–300°C. Therefore, at this temperature, the deformation of the alloy is mainly controlled by the dynamic recrystallization of the Mg matrix.
The absence of cracks or debonding of the LPSO phase during above 200°C can be related to the coherent interface between the Mg matrix and the LPSO phase along both the basal and prismatic planes as it has been proposed by Tahreen et al. [4].
5. Conclusions
In the present paper, the high-temperature deformation behavior of the WZ42 magnesium alloy containing a long-period stacking ordered(LPSO)phase with a volume fraction of 10%has been investigated. It was shown that:
• The yielding is controlled by activation of extension twin system in elongated grains and by a basal slip in the dynamically recrystallized grains up to 300°C. Although twinning is still active at 300°C, its impact on the deformation is smaller compared to that at lower temperatures.
• Dynamic recrystallization is evident already at 300°C. A local maximum of the intensity of the (0002) diffraction peak at 40° tilted from the axial direction could be linked to the continuous dynamic recrystallization and the activation of a
• Kinking becomes more significant at elevated temperatures even in an alloy with a low volume fraction of the LPSO phase. The coherent interface between the Mg matrix and the LPSO phase also reduces the chance of micro-cracks or debonding of the LPSO phase above 200°C.
Declaration of Competing Interest
The authors declare that they have no conflict of interest.
Acknowledgments
The authors acknowledge the Deutsches Elektronen-Synchrotron for the provision of facilities within the framework of the proposal I-20170459 EC. The authors are also grateful for support from the Grant Agency of the Charles University, grant number 1262217; the grant SVV-2019-260442; the Czech Science Foundation under grant 17-21855S; the Operational Programme Research, Development and Education, The Ministry of Education, Youth and Sports (OP RDE, MEYS), grant number CZ.02.1.01/0.0/0.0/16_013/0001794. GG thanks the support of the Spanish Ministry of Economy and Competitiveness,grant number MAT2016-78850-R.
杂志排行
Journal of Magnesium and Alloys的其它文章
- Latest research advances on magnesium and magnesium alloys worldwide
- Advances in coatings on biodegradable magnesium alloys
- Stability of twins in Mg alloys – A short review
- A review on thermal conductivity of magnesium and its alloys
- Effect of Ca addition on the microstructure and the mechanical properties of asymmetric double-sided friction stir welded AZ61 magnesium alloy
- Effect of pre-deformation on microstructure and mechanical properties of WE43 magnesium alloy II: Aging at 250 and 300 °C
