Current Status and Main Scientific Results of In-flight CSES Mission*
2020-04-16SHENXuhuiZERENZhimaHUANGJianpingYANGYanyanZHAOShufanYANRuiZHANGZhenxiaLIUDapengWANGQiaoCHUWeiLUHengxinXUSongGUOFengTANQiaoLIWenjingZHOUNaSONGFuxi
SHEN Xuhui ZEREN Zhima HUANG Jianping YANG Yanyan ZHAO Shufan YAN Rui ZHANG Zhenxia LIU Dapeng WANG Qiao CHU Wei LU Hengxin XU Song GUO Feng TAN Qiao LI Wenjing ZHOU Na SONG Fuxi
Current Status and Main Scientific Results of In-flight CSES Mission*
SHEN Xuhui ZEREN Zhima HUANG Jianping YANG Yanyan ZHAO Shufan YAN Rui ZHANG Zhenxia LIU Dapeng WANG Qiao CHU Wei LU Hengxin XU Song GUO Feng TAN Qiao LI Wenjing ZHOU Na SONG Fuxi
(100085)
The CSES (China Seismo-Electromagnetic Satellite) is the electromagnetism satellite of China’s Zhangheng mission which is planned to launch a series of microsatellites within next 10 years in order to monitor the electromagnetic environment, gravitational field. The CSES 01 probe (also called ZH-1) was launched successfully on 2 February 2018, from the Jiuquan Satellite Launch Centre (China) and is expected to operate for 5 years in orbit. The second probe CSES 02 is going to be launched in 2022. The scientific objectives of CSES are to detect the electromagnetic field and waves, plasma and particles, for studying the seismic-associated disturbances. To meet the requirements of scientific objective, the satellite is designed to be in a sun-synchronous orbit with a high inclination of 97.4° at an altitude around 507 km. CSES carries nine scientific payloads including Search-coil magnetometer, Electric Field Detector, High precision Magnetometer, GNSS occultation Receiver, Plasma Analyzer, Langmuir Probe, two Energetic Particle Detectors (including an Italian one), and Tri-Band Transmitter. Up to now, CSES has been operating in orbit for 2 years with stable and reliable performance. By using all kinds of data acquired by CSES, we have undertaken a series of scientific researches in the field of global geomagnetic field re-building, the ionospheric variation environment, waves, and particle precipitations under disturbed space weather and earthquake activities, the Lithosphere-Atmosphere-Ionosphere coupling mechanism research and so on.
CSES mission, Magnetic field model, Waves, Particles, LAIC, Geomagnetic storm
1 Introduction
On 2 February 2018, the China Seismo-Electromagnetic Satellite (CSES), also called ZHANGHENG-1 (ZH-1), was launched successfully in orbit by CZ-2D vehicle from Jiuquan Satellite Launching Site[1,2]. CSES is the first space-based platform in China for both earthquake observation and geophysical field measurement, which was first proposed early in 2003 and was approved in 2013 after ten years’ scientific and engineering demonstration. During the past 15-year, the pre-studies and development of CSES have been continuously funded by CNSA, the Ministry of Sciences and Technologies (MOST), and China Earthquake Administration (CEA). Back to the cross point of the century, there occurred a hot scientific dispute in the community about whether an earthquake is predictable accompanied with a series of devastating earthquakes including the 2001 China Kunlunshan M8.1, 2004 Indonesia M9.2, 2008 China Wenchuan M8.0, and 2011 Japan M9.0 and so on. Regarding that earthquake prediction is a natural science based on observations, at the beginning of 2003, Chinese government decided to develop space- based observation system so as to help to develop new methods and theory on earthquake forecasting science, and to improve the understanding of physical processes in the preparation, occurrence, and development of earthquake. After ten yours’ re-studies on science and engineering, the mission was finally initiated in 2013. In the middle of 2014, the development of Electrical Model was finished which was used to demonstrate the hardware and software design of the platform and payloads, to verify the compatibility between the platform and payloads, to test the payload performance, to validate the structure and mechanical designs as well as the satellite thermal control design and so on. In the middle of 2015, the Qualification Model was developed for the purpose of qualifying all newly built units and calibrating all payloads. The results show that the satellite platform and scientific payloads fulfill all the specifications. In the middle of 2017, the Flight Model was developed and performed as required for flight operation. The commission test had been carried out after the scientific payloads started to operate successively since 13 February 2018.
The CSES mission is the first satellite of Chinese space based geophysical field observation system and provides a lot of application prospects in Earthquake science, geophysics, space sciences, and so on. The scientific objectives of the mission are listed as follows.
(1) To obtain global data of the electromagnetic field, plasma and energetic particles in the ionosphere, especially those real-time data when the satellite passes over the Chinese territory.
(2) To monitor and study the ionospheric perturbations which could be possibly associated with seismic activity, especially with those destructive ones.
(3) To monitor and study the near-Earth space environment, and its disturbance caused by human activities.
(4) To analyze the features of seismic-ionospheric perturbations, therefore, to explore the possibility for short-term earthquake forecasting in terms of satellite observation and to search the new approaches for short-term and imminent prediction.
(5) To support the researches on geophysics, space science as well as radio science and so on.
(6) To provide the data sharing service for international cooperation and scientific community.
To meet the scientific goals, CSES is designed to carry nine scientific payloads including: the High Precision Magnetometer (HPM) for the total magnetic field observations[3-5]; the three-axis Search-Coil Magnetometer (SCM) and the Electric Field Detector (EFD) for the electromagnetic field detection at a broad frequency range from DC to HF[6,7]; a Langmuir Probe (LAP) and Plasma Analyzer Package (PAP) for in-situ plasma parameters measurements[8,9]; the High Energetic Particle Package (HEPP) and Italian Energetic Particle Detector (HEPD) for high energy particles[10,11]; the GNSS Occultation Receiver (GOR) and Tri-Band Beacon (TBB) to measure electron density profiles[12,13].
2 Satellite Platform and Ground Application System
The platform of CSES was remodeled upon the CAST2000 which offers a standard multi-mission platform at a very attractive cost. Technically, the platform architecture is generic, and adaptations are limited to relatively minor changes in several electrical interfaces and software modules. The platform includes eight units: Data Transmission subsystem (DTs), Structure and Mechanism Subsystem (SMs), Thermal Control subsystem (TCs), Attitude and Orbital Control subsystem (AOCs), Power Supply subsystem (PSs), Telemetry and Tele-Command subsystem (TTCs), on Board Data Handling subsystem (OBDHs) and scientific payloads. Satellite structure construction uses the dual-layer cabin design: payload layer cabin and platform layer cabin. Satellite is flying in the direction of the satelliteaxis, the satelliteaxis is pointing nadir, the satelliteaxis is then decided by right hand rule. Solar panel locates on the +side of the satellite with 12° offset angle and rotates around the satelliteaxis. Housekeeping data are exchanged through CAN bus onboard, the OBDH Center Computer is used as a host for all other equipment. Onboard telemetry uses TM package to communicate. Satellite AOCs use earth oriented 3-axis stabilization. Three star-trackers, two groups of gyros, and one digital sun sensor are used to measure the attitude. Reaction wheel and magnetic torque are used to maintain the zero-momentum control. A propulsion system is used for attitude complementary control and orbit maintenance. An S-B and Telecommunication system assisted by GPS positioning is used for TMTC subsystem. The power supply subsystem is composed of 80 A·h Li-ion battery and GaInP2/GaAs/Ge solar cell panel.
The commissioning phase of the satellite was completed by November 2018 after 9 months of launch. Up to now, CSES has been operating in orbit for 2 years and has collected scientific data for more than 10000 orbits. Except some unknown contamination sources for Plasma Analyzer Package, the entire set of payloads and platform are all working in good condition. The configuration of CSES satellite platform is represented in Figure 1.
The main orbit parameters of CSES are listed in Table 1. The distance between neighboring orbit trajectories is around 2650 km in one day and is reduced to 530 km in a revisit period of 5 days (Table 1). The payloads and physical parameters of CSES satellite are listed in Table 2.
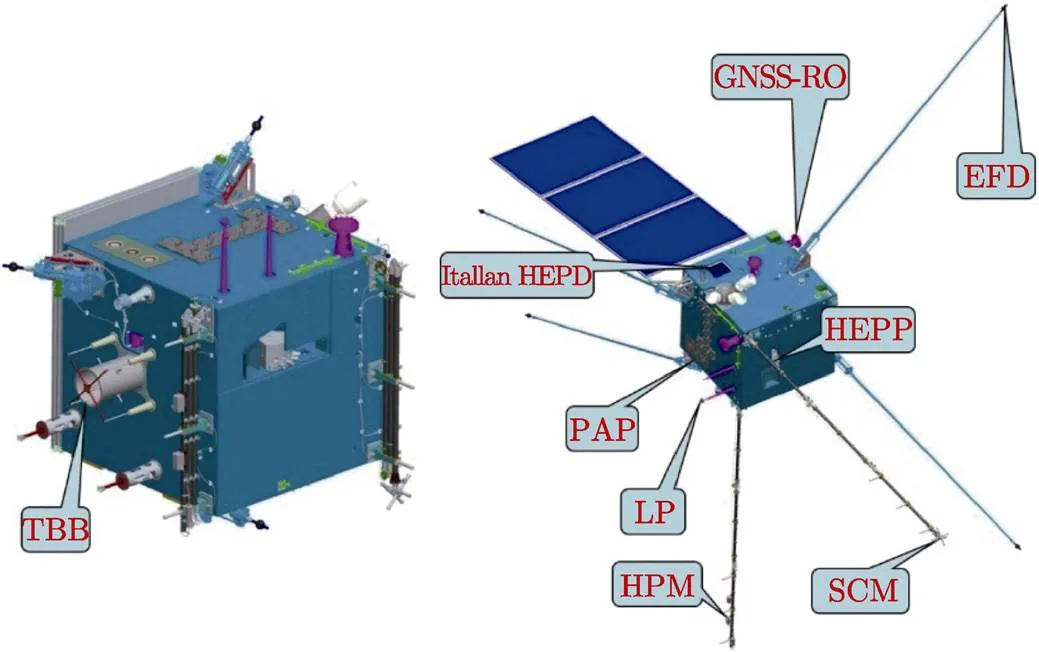
Fig. 1 Configuration of CSES satellite platform
The ground segment (as shown in Figure 2) of CSES consists of a science and application center, the satellite ground receiver networks, the field verification field, and comparison system for satellite-ground measurement. The science and application center is responsible for mission operation and control, data management, and data sharing service, as well as Earthquake Scienceapplication, operated by China Earthquake Administration.
After the commission phase, every 3~4 months the satellite performs an orbit maneuver for ground track control so as to have a perfect recursive visit relative to all geophysical locations. The latest ground track keeping maneuver was performed on 20 January 2020. The remaining fuel of the satellite is about 35 kg (42 kg before launch), according to the current usage, the fuel is sufficient to support the entire life span.
The satellite establishes 6~8 times data transmission downlink and 4 times TMTC duplex links to the ground segment at each day, and both the data transmission link and TMTC link work steadily and efficiently.
Normally all payloads switch off over ±65° of latitude, however, the satellite can extend the working zone to cover the polar region for the specific experiments.

Table 1 Main parameters of CSES platform

Table 2 Status of the scientific payloads

Fig. 2 Data flow between satellite and ground units
In order to provide reliable assistant information for all payloads, the performance of the satellite platform is evaluated every 6 months in terms of positioning accuracy, attitude information accuracy, and potential charging control, meanwhile the thermal control system and timing system are monitored all the time. So far, major specifications for CSES mission meet the expectations. The satellite is working stably and continuously providing scientific data with great duty cycle percentage.
The ground receiving system consists of four stations, which are Miyun Station, Kashi Station, Sanya Station, and Southwest Station. Orbit prediction error keeps <30 s. All interfaces between satellite and ground stations such as coding, data rate, and modulation satisfy the requirement, and the transmission efficiency from all ground stations to data station meets the requirement.
Data Application system, which is in charge of the mission operation center, running control management subsystem, and data processing subsystem, is generally running stably, in which parallel processing architecture is embedded to realize automatic data process, and manual interactive process is optional. So far, the success rate for level-0 to level-2 data process could reach more than 90%. Data distribution website (www.leos.ac.cn) is established and ready for user to access.
3 Preliminary Results of CSES Satellite
3.1 Global Geomagnetic Field Reference Model
The International Geomagnetic Reference Field (IGRF)model is used to describe the main field and the secular variation of Earth’s geomagnetic field. The building of IGRF model is an international behavior organized by International Association of Geomagnetism and Aeronomy (IAGA). IGRF is updated every five years, and 2019 is the final year for 12th generation IGRF. In March of 2019, IAGA announced the new call for 13th generation IGRF. Thanks to China Seismo-Electromagnetic Satellite (CSES) mission[1-2], this is the first time that China response to the open call from IAGA and started to build a candidate model. Until the final submission of IGRF-13 candidate model (1 October 2019), CSES has accumulated one and half a year dataset. Using this dataset, the main field for 2020 totally based on CSES’s data was built, becoming the only one without using Swarm data in all the 12 candidate models of IGRF-13. The independent data source from CSES provides an opportunity for the cross-check with other models.
For the building of this proposed candidate model, the 1 Hz level 2 scientific HPM data were used. The data were calibrated using the procedure described in Zhou.[4]and provided by the Institute of Crustal Dynamics, China Earthquake Administration. It should be noted that, determined by the working mode of the satellite, HPM consists of two types data. The type 1 data is in geographic latitudes between 65°S and 65°N, which are down sampled to 1Hz from the original 60 Hz FGM and 30 Hz CDSM data. The data is carefully calibrated and opened for public. The type 2 data is available for North and South geographic latitudes higher than 65°. This dataset hasn’t been opened yet because of continuous magnetic disturbance caused by the magnetic torque. To build the model entirely based on CSES data, however, some efforts still have to be made to make such data available.
For the model submitted to IAGA, we selected CSES data from 3 March 2018 (the date that CDSM successfully turned on to work) to 20 September 2019, which lasts about 19 months. In this work, however, we have updated the model using more data to 30 November 2019. Data selection criteria are similar to those typically used for dedicated internal field modeling[14](where some of the quantities used below are defined) with some special considerations related to the CSES mission.
(1) Common selection to all data: (i)dark region only (solar elevation angle at least 10° below horizon); (ii) magnetically quiet conditions, based onindex <2 nT·h–1and<2+; (iii) FLAG_MT=0 to remove data with disturbance from the magnetic torques. This flag is not used for type 2 data, as all data are affected by MT.
(2) Additional selection for scalar data: (i) for QD latitude above 55°, the merging electric field at magnetopause Em should be less than 0.8 mV·m–1; (ii) decimation: 1 point every 30 points for Type 1 data, no decimation for Type 2 data.
(3) Additional selection for vector data: (i) only vector data for QD latitudes less than 20° are selected; (ii) FLAG_TBB=0 to remove data with disturbance from Trip-Band Beacon; (iii) A final decimation (1 out of 15 data points) is being used to avoid over-representation along tracks.
Then, using the selected dataset, the model parameters were computed by minimizing the mismatch between data and model prediction[14], using iteratively reweighted least-squares with Huber weights, without any regularization, as shown in Figure 3. To validate our candidate model, we decided to rely on some comparison between the prediction of our parent model with that of the CHAOS6-x9 model[15]. The result illustrates that the difference in the Br values predicted by our CSES parent model and CHAOS6-x9 at Earth’s surface, for the central epoch 11 December 2018 is about 20 nT in amplitude. The largest differences are in the zonal component. These differences most likely reflect some of the systematic boom deformations along the CSES orbits. We note, however, that such differences remain within a reasonable level acceptable by typical IGRF candidate models. More detailed information about modeling will be found in Yang. (in preparation).
3.2 ELF/VLF Electromagnetic Waves
The upper ionosphere is a highly dynamic region with a variety of intense electromagnetic emissions, especially the whistler-mode emissions at Extremely/ Very Low Frequency (ELF/VLF) range[16]. The most common and typical ELF/VLF whistler-mode waves in the high-latitude ionosphere mainly include hiss[17,18], chorus[19,20], and Quasiperiodic (QP) waves[21,22],.Figure 4 shows two QP wave events represented by the sum of Power Spectral Density values (PSD) of three components of the magnetic field and electric field at frequency from 200 Hz to 2 kHz. These two events were captured on 25 August (Figure4a), 18 December (Figure 4b), at dayside upper ionosphere, respectively. It can be seen that there exist fixed time-separations (., periods) between adjacent wave elements during each event at a broad frequency range fromcp(the proton cyclotron frequency, see the black dashed lines) predominantly up to 1.5 kHz, occasionally up to about 2 kHz. The proton cyclotron frequencycpis computed by the scalar value of the total magnetic field measured by HPM.
CSES’s observations are consistent with previous understanding that the QP wave is almost a dayside phenomenon[21], however, compared to the similar technically designed satellite DEMETER in the upper ionosphere, CSES seems that can record more well pronounced rising-tone structures. The DEMETER is a synchronous circular Low Earth Orbit (LEO) satellite with an altitude about 660 km[23], measuring generally the same space environment as CSES (507 km) in the upper ionosphere. To our knowledge, there are two reasons that might explain for less rising-tone QP events from DEMETER’s observations. One reason might be due to the measurement capability of satellites: the frequency resolution of electromagnetic field measurement of DEMETER is 19.5 Hz in all time survey-mode, and 2.5 Hz only in short time burst-mode (so the observation chance is very limit), while the frequency resolution of CSES is 2.5 Hz in all time survey mode; another reason might be due to the observational time window: DEMETER operates at dayside around 10:30 LT while CSES around 14:00 LT. It is widely accepted that the QP emissions predominately occur around noon, but no further investigations on the occurrence of rising-tone QP waves have been reported. Considering CSES has recorded well pronounced rising-tone structures around 14:00 MLT, we speculate that 14:00 MLT might be a suitable time window for excitation of rising-tone QP structures, we will leave this topic for future study after CSES collects adequate evidence.

Fig. 3 Magnetic field center component (a) and inclination (b) calculated from CSES-IGRF 2020.0 candidate model

Fig. 4 Quasi-periodic electromagnetic waves recorded by CSES in the high-latitude upper ionosphere.(a) The event of 25 August 2018; (b) the event of 18 December 2018; the waves are represented by the sum of Power Spectral Density (PSD) values of three components of magnetic field (a) and the electric field at frequency band from 200 Hz to 2 kHz
3.3 Particle Precipitations Induced by Wave-particle Interaction
The Earth’s radiation belts, filled with energetic particles, consist of inner and outer radiation belts separated by a region known as the slot region with electron flux minimum, which lies around=3. The electron enhancements in the radiation belts can be caused by wave heating or radial diffusion during storms by wave-particle interaction mechanism. Killer electrons, especially with energies greater than 1 MeV, are the main environmental hazard to Earth orbiting satellites and astronauts. And the energetic particle burst is closely related with the disturbance of the geomagnetic field. Therefore, it is very important and meaningful to study the high energy electron precipitation mechanism.
The onboard high energy particle detector (HEPP-L, H)[11]can measure the electron fluxes with energy ranging from 0.1 keV to 55 MeV with an energy resolution≤8.9% at 1 MeV and wide pitch angles. The maximum field of view of HEPP-L is 100°×30°. So the launch of CSES satellite and the good performance of HEPP-L particle detector provide a good opportunity for studying the electron precipitation phenomenon. Here we introduce two kinds of electron precipitations associated with chorus acceleration during geomagnetic storms and ground VLF transmitters.
3.3.1 Electron Precipitation in Extremely Low-Shell Induced by Chorus Waves during Storms
Whistler-mode waves are often observed during the geomagnetic storm and possibly excited by the energetic electron injection outside plasmasphere near the equator. Magnetospheric chorus wave can rapidly accelerate relativistic radiation-belt electrons. However, all the electron enhancements reported in the past located in the region of high-shell (>4) corresponding to outer radiation belts.
In the paper[24], based on ZH-1 satellite, for the first time, we provided compelling evidence that an intense and deep MeV electron penetration in extremely low-shell is attributable to the chorus acceleration during the storm (Figure 6). Here we focus on the relativistic electron flux enhancement in lowshell (=2.5~4) during August 2018 geomagnetic storm (minimum=–190 nT). Strong whistler-mode (chorus and hiss) waves, with amplitudes 81~126 pT, were also observed in the extremely low L-shell simultaneously (reaching≈2.5) where the plasmapause was suppressed. And then we explained this phenomenon by electron phase space density distribution and quasi-linear diffusion theory of wave-particle interaction.

Fig. 5 Overview of the electron evolution during the storm of August 2018 measured by ZH-1. (a) The geomagnetic storm index Dst. (b)~(d) The electron evolution for the energy range of 0.1~0.5, 0.5~1, and 1~3 MeV, respectively. (e)~(g) Daily-averaged flux distributions in the L-shell. (h) and (j) The flux distributions of 1~3 MeV electrons in local pitch angle and equatorial pitch angle with L=2~5. (i) The number of observed electrons in each pitch angle channel. The solid black line in panel (d) denotes L=3[24]
Fig. 6(b)~(d) show the dynamical evolution of radiation belt relativistic (0.1~3 MeV) electrons observed by HEPP-L detectors onboard ZH-1 (including descending and ascending orbits). The electron measurements are color coded in logarithm and sorted in-shell (bin width: 0.1). The-shell here used in HEPP-L data is McIlwain’s-shell, which is calculated based on the IGRF model with the external field OP77 model. Before the occurrence of a storm, the slot region, inner and outer radiation belts were clearly exhibited in those plots. The slot region lies around=3~3.8. The fact that there is a lack of measurable >1 MeV electrons in the inner belt agrees with previous longer-term measurements. The apparently periodic feature of fluxes is caused by the characteristic of Sun-synchronous orbits of the ZH-1 satellite.
3.3.2 Electron Precipitation Induced by Ground VLF Transmitter
Ground-based Very-Low-Frequency (VLF) EM signals can transmit across the atmosphere, expands into the ionosphere[25-27], and interacts with the energetic particles in the radiation belt[28]. This interaction accelerates the particles by changing their momentum or scattering their pitch angle, which causes them to enter the bounce or drift loss cones. As a result, a mass of energetic particles accumulates within a certain-shell and yields particle-flux enhancement, which can be observed by the onboard particle detectors of satellites. The electron precipitation belts induced by VLF transmitter, which has attracted much attention in the past decades, is also observed by the particle detectors onboard ZH-1 satellite.
Figure 6 shows the North West Cape (NWC) electron precipitation between-shells of=1.4 and=1.8 labeled by the blue dots-line on the top panel observed by ZH-1. The flux level, energy spectra, pitch angle distribution is displayed on the lower panels of Figure 7. We can find the clear electron precipitation wisp structures distributing in the energy range of 0.1~0.3 MeV in Figure 7. The electron precipitation induced by ground NWC VLF transmitter can be explained by pitch angle and momentum diffusion of the wave-particle interaction mechanism.
3.4 Seismo-lithosphere-atmosphere-ionosphere Coupling Mechanism
Earth, atmosphere, ionosphere, and magnetosphere are physically coupled together. Mantle convection drives plate movement, which leads to seismic activities, and will have a response in the near Earth space[29-32]. There are mainly three kinds of Seismo- Lithosphere-Atmosphere-Ionosphere coupling mechanisms at present. The electric field mechanism and the electromagnetic wave mechanism used as pre- earthquake mechanisms behave well, while the acoustic gravity wave mechanism could explain the co-seismic phenomena well[33,34].
The formation of LAIC electric field is mainly based on the p-hole mechanism of solid state physics. It is believed that the increase of rock stress before the earthquake will ionize the atmosphere near the surface and generate a large number of additional ions. Ions gather at the bottom of the atmosphere and generate an abnormal atmospheric electric field[35-38]. This atmospheric electric field penetrates into the ionosphere and produces extra×drift, which could cause the abnormal in the above and conjugate areas[38-41].
It is also believed that there are broadband electromagnetic waves from ultra-low-frequency to extra-low-frequency and very-low-frequency radiated from the seismogenic zone because of the piezoelectric and electro-kinetic effects[42,43]. The waves could penetrate the lithosphere and propagate in the ground- ionosphere waveguide for long distance. But there is still some energy linking into the ionosphere and magnetosphere which can be observed by the satellite[44,45].
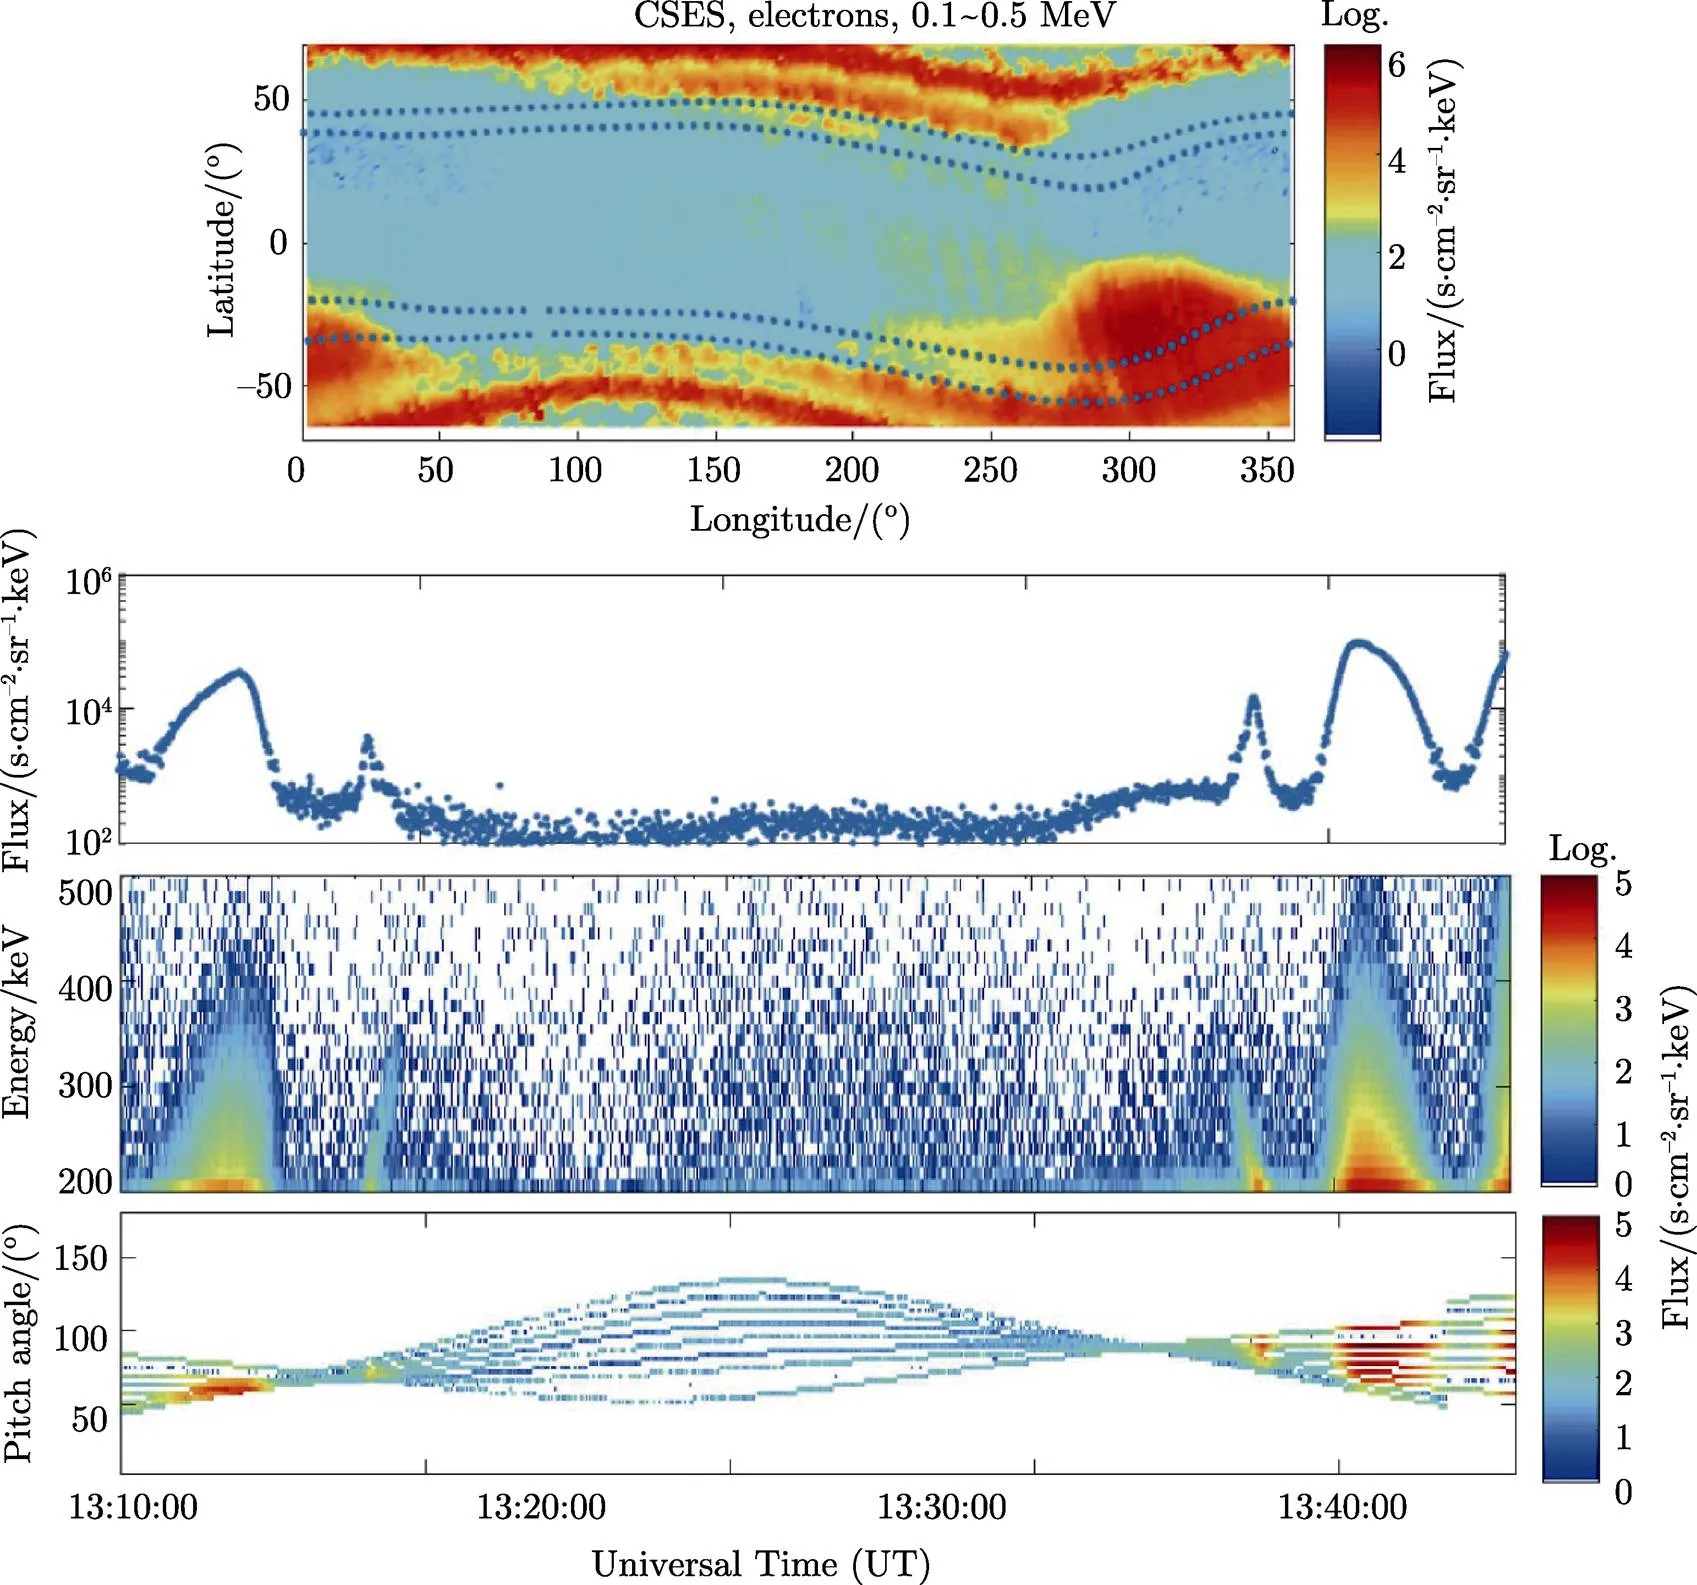
Fig. 6 NWC electron precipitation measured by HEPP-L particle detector onboard ZH-1
There are many ground based VLF transmitters around the world used for submarine communication with constant radiation frequencies and powers. With the help of the VLF signals, the electromagnetic wave LAIC model has been validated by comparing the model results with the satellite observation results. A full-wave method[46,47]seeks a solution of Maxwell equations for waves varying as ejwtin a horizontally- stratified medium. Considering the observation distance from the source to the satellite is just 507 km, which is much smaller than the radius of the Earth, the Earth’s curvature is neglected. The simulation results show that the electromagnetic field attenuates gradually from the near center of VLF transmitters to the far away area, and the wave mode interference in the waveguide is also mapped into the ionosphere.
The VLF signals in the ionosphere propagating from ground-based transmitters are observed by the newly launched CSES satellite[27]. The features of VLF signals in the overhead ionosphere and their geomagnetic conjugate regions by CSES are presented. According to the revisit orbit analysis, it is found that the average values and standard deviations of electromagnetic field excited by the transmitters observed by CSES match well with the simulation results shown in Figure 7. It also shows that the electromagnetic field induced by NWC, NAA, and GBZ in the conjugate area is mainly distributed within 1.5<<2.5. However, NPM in the conjugate area is distributed at about<1.5, implying a non-ducted propagation.
3.5 Ionospheric Disturbances Induced by the Geomagnetic Storms
Geomagnetic storms, last for several days, are the major space weather events. There are whole space disturbances involving thermosphere, ionosphere, and magnetosphere. Storms are thought to be related with activities in the Sun,, solar flares, CME. In the ionosphere, the solar Extreme Ultra Violet (EUV), Ultraviolet (UV) and X-rays related ionization can result in the enhancement of Electron density. Furthermore, the storm time ionosphere changing is also closely related with the physical process from the thermosphere and magnetosphere. During the storm, the increased energy input enhances the convection electric field in the magnetosphere, which can map down along magnetic field lines to high latitude of ionosphere, resulting in the strong plasma drift. The convection electric field can then penetrate into low latitude. At the same time, the energetic particles can inflow from the magnetosphere to ionosphere through Region 1 (R1) and Region 2 (R2) currents, expanding and intensifying the aurora activities, and considerably heating the ionized and neutral gases. The uneven expansion of thermosphere will then drive the neutral wind, altering the thermosphere circulation. This process, along with the penetration of electric fields to low latitude, will change the global dynamics in the ionosphere, resulting in the redistribution of neutral composition and plasma.

Fig. 7 Comparison of electric field (top panel) and magnetic field (bottom panel) excited by VLF transmitters (NWC, NAA, NPM) between CSES satellite observation and simulations. The R value represents the correlation coefficient. The P value represents whether the correlation coefficient has statistical significance. The vertical black solid lines show the geographical position of the transmitter; the black dashed lines show the geographical position of the crossing between the orbit of the satellite and the field line whose foot is at the height of 80 km above NWC transmitter
Low Earth orbit (LEO) can provide a good opportunity to conduct ionosphere observations during the storm. On 25–26 August 2018, CSES met the first intense storm event since its launch. In the work of Ref.[48], ionosphere multi-parameter disturbances observed during this storm are reported using conjunction observations from CSES data from HPM, SCM, LAP, PAP, EFD HEPD, and GOR payloads onboard CSES. The main purpose is to demonstrate the capabilities and performance of these payloads, as well as to reveal the mechanism of this storm event.
During this event, Swarm Alpha has close LT with CSES, so, we can make a comparison for the features detected by two missions. As presented in Figure9, the residual field calculated from HPM/ CDSM data by subtracting CHAOS main and crust field (reflecting currents from the ionosphere and magnetosphere) show very consistent results with Swarm observations. Both residual fields observed from CSES and Swarm shows very similar trends with storm activity,., during the storm initial phase, the residual fields enhanced and then reduced sharply for the storm’s main phase; the value slowly backs to a lower level during the recovery phase. The results indicate that the magnetic fields detected from CSES exhibit very good quality.
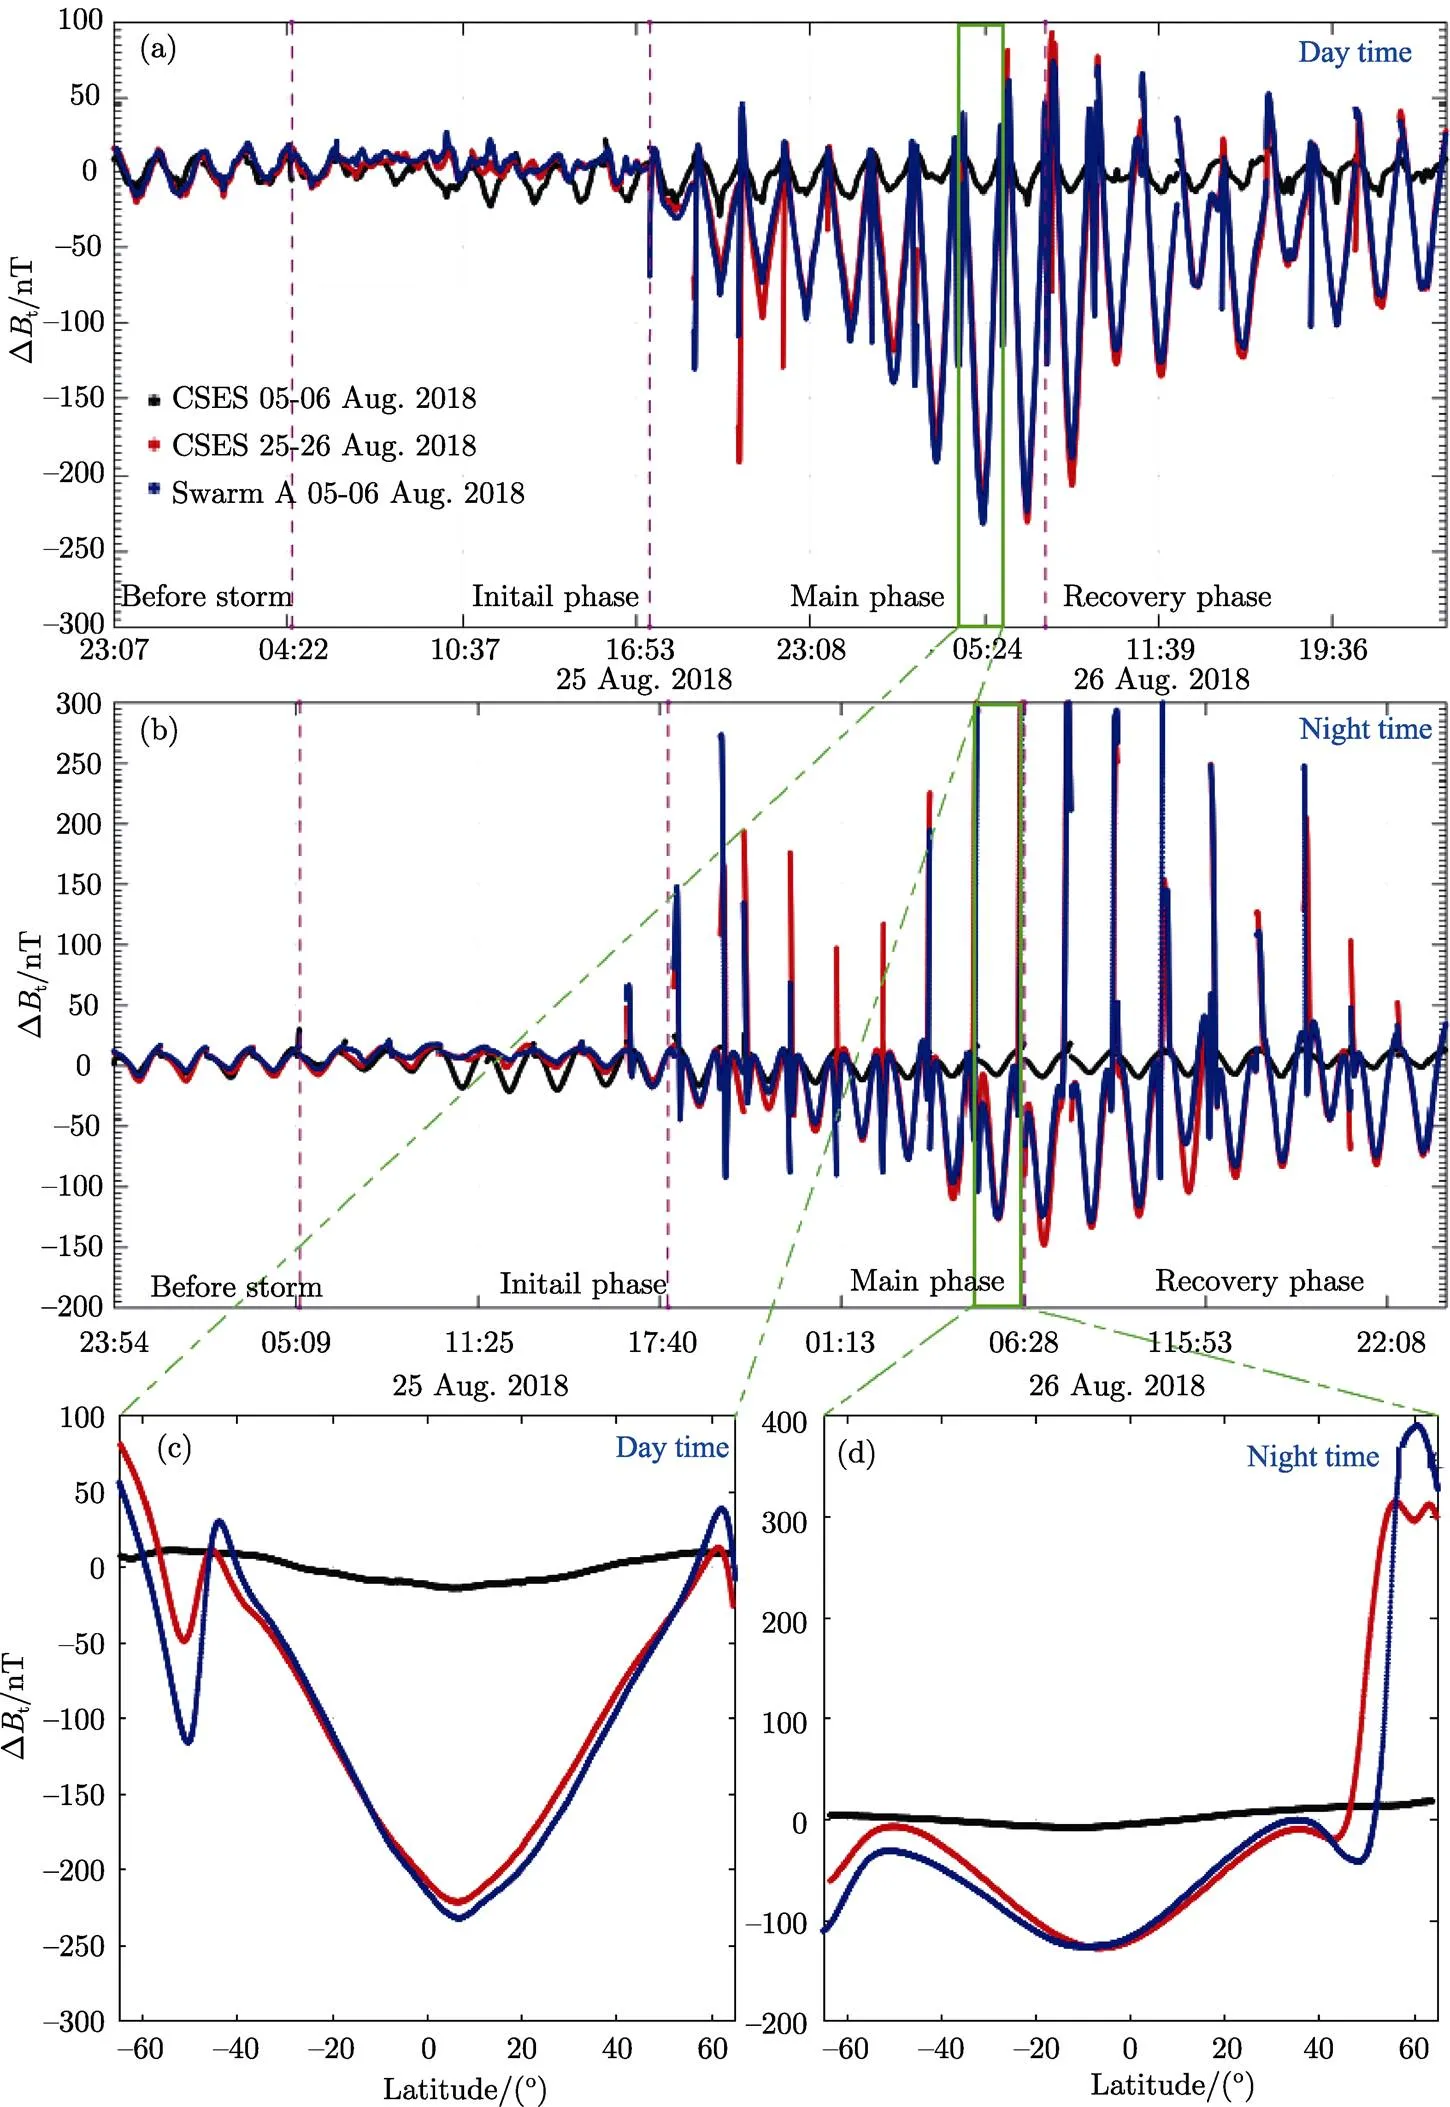
Fig. 8 Residual magnetic field evolution for CSES and Swarm during 25–26 August[48]
The joint observations from LAP, PAP, EFD, and GOR data can be used to investigate the possible mechanisms of this intense storm. Firstly, the plasma intensity (temperature) detected from LAP and PAP clearly increases (decreases) during the storm main phase and early recovery phase, and then backs to quiet time values. At the same time, the ULF PSD of electric field behaves the similar way with plasma density. Besides,m2andm2observed from GOR (see Figure 9) are greatly enhanced and show a large deviation from quiet time. These phenomena imply that electric field penetration might be responsible for the generation of this positive ionosphere storm event.
Then, through SCM data, we observed very clear ELF/VLF waves during this storm event. For the daytime, very clear ELF/VLF waves are observed, which can last from storm main phase to several days of the recovery phase. While for the nighttime, the ELF/VLF waves are very weak during the whole storm event. The global distribution of energetic electron flux from HEPP is also checked in the study. We found a clear enhancement of <1 MeV energetic particles at the SAA, slot region, and outer radiation belt. At the same time, the pitch angle distribution shows that most particles are concentrate around 90°, indicating the locally mirroring (trapped/quasi-trapped) may be the dominant process for this storm time enhancement of energetic particles. These main features observed with SCM and HEPP are highly consistent with previous reported results. These observations also hint high potential applications of EFD/SCM and HEPP data on wave-particle studies.
3.6 Ionospheric Disturbances Associated with Strong Earthquakes
Electromagnetic precursors to seismic events have been reported since 1980s[49,50], serving as a new observing technique for studying seismic electromagnetic effects (. Ref.[51] and references therein). The Lithosphere-Atmosphere-Ionosphere Coupling (LAIC) models explained these anomalous including the positive and the negative variation to a certain degree[52,53]). After CSES satellite was launched on 2 February 2018, the first earthquake with Ms>7.0 recorded by CSES was the Ms7.1 earthquake occurred in Mexico on February 17: the disturbances of low-frequency electromagnetic waves (Figure 10) and ionospheric plasma were found 2 or 3 days before the earthquake.

Fig. 9 Electron density profile obtained from GOR during the quiet time and storm time[49]
Then we examined the strong earthquake with Ms>6.0 in China and earthquake with Ms>7.0 all over the world since CSES launch with some data processing methods, and explored the disturbance characteristics and mechanism in the ionospheric before and after these earthquakes[51].
In this paper, we discussed another Ms 7.6 earthquake, which occurred about 46km southeast of Namatanai, Papua New Guinea on 14 May 2019 at 12:58:28 UT. It is also a shallow EQ with a depth of 30 km. The epicenter is located at geographic 4.15°S and 152.52°E. Ionospheric perturbations ofeduring 10 days before the EQ were studied using the moving median method. The nighttime data collected on one orbit within ±10° around the epicenter were resampled by 0.5° in the direction along the latitude. The background median value (b) and interquartile range () were calculated using data from the previous 10 orbits (about 10 days), and then takingb±as the upper and lower thresholds. We also introduce a similar method in detail in the reference[51]. The current resampled orbit data (o), background data (b), and upper and lower thresholds (b±) are shown at the same time in the upper panel Figure 11. The relative change, [o–(b±)]/(b±), is calculated when the observation value is greater than the upper threshold or smaller than the lower threshold. If observation values are between the upper and lower thresholds, the relative change is then 0 (bottom panel Figure 11). From Figure 11, we can find that increases ofeon 7 May and 11 May are obvious. Firstly, we check theindex during these two days and found that mostindex is equal to 4 and 5 on 11 May. Hence, theeincreases observed on 11 May is probably due to the magnetic storms. Then we found that the orbit on 7 May happened to be orbit passing by the epicenter (Figure 12) and in quiet magnetic days. So, we think theeenhancement is likely to be related to the earthquake (Figure 12) in magnetically quiet days.

Fig. 10 Enhancement of ULF/ELF at 155.5 Hz magnetic field before Mexico earthquake

Fig. 11 Time series analysis of Ne moving average value

Fig. 12 Distribution of ascending revisited orbits close (less than 1000 km) to the epicenter
It is found that CSES could record anomalies probably related to earthquakes after excluding the data disturbances caused by the satellite or payloads, magnetic storms, and disturbances at high latitudes. These findings are similar to those obtained on other satellites over the past decade. We summarized some abnormal phenomena probably related to the global earthquakes with≥7 and depth ≤100 km from February 2018 to February 2020 (not shown). Based on these results, we conclude that during strong earthquakes activities, CSES data are responsive to these earthquake events, the same parameters may not be reflected in each earthquake, perturbations in different parameters can occur at various locations and times. We also find that it is difficult to determine whether the abnormal is caused by an earthquake or not. The measured parameters display similar background variations in absence of seismic activity since the ionosphere is affected by a number of other factors.andcan be used to examine whether perturbations are from earthquakes or magnetic storms, but they cannot be used to rule out other possibilities. This is one of the challenges in studying earthquake precursors[51]. Of course, the mechanism of ionospheric perturbation related to earthquakes still remains poorly understood and needs a long-term further study.
4 Conclusions
The current statuses of CSES platform, ground application system are briefly introduced in this report. Up to now, CSES has been operating in orbit for 2 years and has collected scientific data for more than 10000 orbits, except for some unknown contamination sources of Plasma Analyzer Package, the entire set of payloads and platform are all working in good condition. After the commission phase, every 3~4 months the satellite performs an orbit maneuver for ground track control so as to have a perfect recursive visit relative to all geophysical locations. The latest ground track keeping maneuver was performed on 20 January 2020. The remaining fuel of the satellite is about 35 kg (42 kg before launch), according to the current usage, the fuel is sufficient to support the entire life span. The ground segment of CSES consists of a science and application center, the satellite ground receiver networks, the verification field, and comparison system for satellite-ground measurement. CSES Satellite began its global observation since 13 February 2018,. 10 d after its successful launching, and it has been collecting valuable scientific data. Using these first-hand data, we have achieved some good scientific results including some preliminary results on the global geomagnetic field modelling, the electromagnetic waves, the wave- particle interactions, the seismic-ionospheric mechanism as well as earthquake case study. The preliminary scientific applications indicate that CSES will benefit not only earthquake science but also geophysics, space science, radio wave science, and space weather monitoring.
Acknowledgments We acknowledge the CSES scientific mission which was funded by China National Space Administration (CNSA) and China Earthquake Administration (CEA), the data in this study can be download from the website http://www. leos.ac.cn/.
[1] SHEN X, ZONG Q, ZHANG X. Introduction to special section on the China Seismo-Electromagnetic Satellite and initial results [J]., 2018, 2(6):439-443
[2] SHEN X, ZHANG X, YUAN S,. The state-of-the-art of the China Seismo-Electromagnetic Satellite mission [J].., 2018, 61(5):634-642
[3] CHENG B, ZHOU B, MAGNES W,. High precision magnetometer for geomagnetic exploration onboard of the China Seismo-Electromagnetic Satellite [J]., 2018, 61(5):659-668
[4] ZHOU B, YANG Y, ZHANG Y,. Magnetic field data processing methods of the China Seismo-Electromagnetic Satellite [J]. Earth Planet. Phys., 2018, 2(6):455-461
[5] POLLINGER A, LAMMEGGER R, MAGNES W,. Coupled dark state magnetometer for the China Seismo- Electromagnetic Satellite [J].., 2018, 29(9):095103
[6] CAO J, ZENG L, ZHAN F,. The electromagnetic wave experiment for CSES mission: Search coil magnetometer [J]., 2018, 61(5):653-658
[7] HUANG J, SHEN X, ZHANG X,. Application system and data description of the China Seismo-Electromagnetic Satellite [J]., 2018, 2(6):444-454
[8] YAN R, GUAN Y, SHEN X,. The Langmuir Probe onboard CSES: data inversion analysis method and first results [J]., 2018, 2(6):479-488
[9] LIU C, GUAN Y, ZHENG X,. The technology of space plasma in-situ measurement on the China Seismo-Electromagnetic Satellite [J]., 2019, 62(5):829-838
[10] CHU W, HUANG J, SHEN X,. Preliminary results of the High Energetic Particle Package onboard the China Seismo-Electromagnetic Satellite [J]., 2018, 2(6):489-498
[11] LI X Q, XU Y B, AN Z H,. The high-energy particle package onboard CSES [J]., 2019, 3(3). DOI: 10.1007/s41605-019-0101-7
[12] LIN J, SHEN X, HU L,. CSES GNSS ionospheric inversion technique, validation and error analysis [J]., 2018, 61:669-677
[13] CHEN L, OU M, YUAN Y,. Preliminary observation results of the Coherent Beacon System onboard the China Seismo-Electromagnetic Satellite-1 [J]., 2018, 2(6):505-514
[14] HULOT G, VIGNERON P, L GER J-M,. Swarm's absolute magnetometer experimental vector mode, an innovative capability for space magnetometry [J]., 2015, 42(5):1352-1359
[15] Finlay C C, Olsen N, Kotsiaros S,. Recent geomagnetic secular variation from Swarm and ground observatories as estimated in the CHAOS-6 geomagnetic field model [J]., 2016, 68:112
[16] ZHIMA Z, CAO J, LIU W,. Storm time evolution of ELF/VLF waves observed by DEMETER satellite [J]., 2014. DOI: 10.1002/2013JA019237
[17] CHEN L, SANTOL K O, HAJOŠ M,. Source of the low-altitude hiss in the ionosphere [J]., 2017. DOI: 10.1002/2016GL072181
[18] Zeren Zhima, CHEN L, XIONG Y,. On the origin of ionospheric hiss: a conjugate observation [J]., 2017, 122(11):11784-711793
[19] PARROT M, SANTOL K O, NĔMEC F. Chorus and chorus- like emissions seen by the ionospheric satellite DEMETER [J]., 2016, 121(4):3781-3792
[20] Zeren Zhima, CAO J, LIU W,. DEMETER observations of high-latitude chorus waves penetrating the plasmasphere during a geomagnetic storm [J]., 2013, 40(22):5827-5832
[21] HAYOSH M, NĚMEC F, SANTOL K O,. Propagation properties of quasiperiodic VLF emissions observed by the DEMETER spacecraft [J]., 2016, 43(3):1007-1014
[22] NĚMEC F, BEZDĚKOV B, MANNINEN J,. Conjugate observations of a remarkable quasiperiodic event by the low- altitude DEMETER spacecraft and ground-based instruments [J]., 2016, 121(9):8790- 8803
[23] PARROT M, BERTHELIER J, LEBRETON J,. Examples of unusual ionospheric observations made by the DEMETER satellite over seismic regions [J]., 2006, 31(4-9):486-495
[24] ZHANG Z, CHEN L, LIU S,. Chorus acceleration of relativistic electrons in extremely low-Shell during geomagnetic storm of August 2018 [J]., 2020, 47(4). DOI: 10.1029/2019GL086226
[25] ZHANG Z, CHEN L, LI X,. Observed Propagation Route of VLF Transmitter Signals in the Magnetosphere [J]., 2018, 123(7):5528-5537
[26] Zhao Shufan, Liao Li, Zhang Xuemin. Trans-ionspheric VLF wave power absorption of terrestrial VLF signal [J]., 2017, 60(8):3004-3014 (in Chinese)
[27] ZHAO S, ZHOU C, SHEN X,. Investigation of VLF Transmitter Signals in the Ionosphere by ZH-1 Observations and Full-Wave Simulation [J]., 2019, 124(6):4697-4709
[28] ZHANG Z-X, LI X-Q, WANG C-Y,. North west cape-induced electron precipitation and theoretical simulation [J]., 2016, 25(11):119401
[29] ZHAO B Q, WANG M, YU T,. Is an unusual large enhancement of ionospheric electron density linked with the 2008 great Wenchuan earthquake [J]., 2008, 113, A11. DOI: 10.1029/2008JA013613
[30] LIU J Y, CHEN Y I, PULINETS S A,. Seismo-ionospheric signatures prior to M≥6.0 Taiwan earthquakes [J]., 2000, 27(19):3113-3116
[31] LIU J Y, CHEN Y I, CHEN C H,. Seismoionospheric GPS total electron content anomalies observed before the 12 May 2008 Mw7.9 Wenchuan earthquake [J]., 2009, 114(A4). DOI: 10.1029/2008JA013698
[32] HAYAKAWA M, KASAHARA Y, NAKAMURA T,. A statistical study on the correlation between lower ionospheric perturbations as seen by subionospheric VLF/LF propagation and earthquakes [J]., 2010, 115(A9). DOI: 10.1029/2009JA015143
[33] LIU J Y, TSAI Y B, CHEN S W,. Giant ionospheric disturbances excited by the M9.3 Sumatra earthquake of 26 December 2004 [J]., 2006, 33(2). DOI: 10.1029/2005GL023963
[34] HAO Y Q, XIAO Z, ZHANG D H. Multi-instrument observation on co-seismic ionospheric effects after great Tohoku earthquake [J]., 2012, 117. DOI: 10.1029/2011JA017036
[35] FREUND F. Pre-earthquake signals: Underlying physical processes [J]., 2011, 41(4/5):383-400
[36] FREUND F, KULAHCI I G, CYR G,. Air ionization at rock surfaces and pre-earthquake signals [J]., 2009, 71(17/18):1824-1834
[37] FREUND F, TAKEUCHI A, LAU B W,. Stress- Induced Changes in the Electrical Conductivity of Igneous Rocks and the Generation of Ground Currents [J]., 2004, 15(3):437-467
[38] SOROKIN V M, CHMYREV V M, YASCHENKO A K. Electrodynamic model of the lower atmosphere and the ionosphere coupling [J]., 2001, 63(16):1681-1691
[39] KUO C L, HUBA J D, JOYCE G,. Ionosphere plasma bubbles and density variations induced by pre-earthquake rock currents and associated surface charges [J]., 2011, 116, A10
[40] KUO C L, LEE L C, HUBA J D. An improved coupling model for the lithosphere-atmosphere-ionosphere system [J]., 2014, 119(4):3189-3205
[41] ZHOU C, LIU Y, ZHAO S F,. An electric field penetration model for seismo-ionospheric research [J]., 2017, 60(10):2217-2232
[42] FREUND F, TAKEUCHI A, LAU B W S. Electric currents streaming out of stressed igneous rocks - A step towards understanding pre-earthquake low frequency EM emissions[J]., 2006, 31(4-9):389-396
[43] GAO Y X, HARRIS J M, WEN J,. Modeling of the coseismic electromagnetic fields observed during the 2004 Mw 6.0 Parkfield earthquake [J]., 2016, 43(2):620-627
[44] HAYAKAWA M. Probing the lower ionospheric perturbations associated with earthquakes by means of subionospheric VLF/LF propagation [J]., 2011, 24(6):609-637
[45] NĚMEC F, SANTOLíK O, PARROT M. Possible seismic influence on VLF wave intensity: observations by a low- altitude satellite [C]//WDS'08 Proceedings of Contributed Papers, 2008
[46] LEHTINEN N G, INAN U S. Radiation of ELF/VLF waves by harmonically varying currents into a stratified ionosphere with application to radiation by a modulated electrojet [J]., 2008, 113, A06301
[47] LIAO L, ZHAO S F, SHEN X H,. Characteristic analysis and full wave simulation of electrical field for China seismo-electromagnetic satellite observations radiated from VLF transmitter [J]., 2019, 62(4):1210-1217
[48] YANG Y Y, ZHIMA Z R, SHEN X H,. The first intense storm event recorded by the China seismo-electromagnetic satellite [J]., 2019. DOI: 10.1029/2019SW002243
[49] LARKINA V I, MIGULIN V V, MOLCHANOV O A,. Some statistical results on very low frequency radiowave emissions in the upper ionosphere over earthquake zones [J]., 1989, 57(1):100-109
[50] PARROT M. VLF emissions associated with earthquakes and observed in the ionosphere and the magnetosphere [J]., 1989, 57(1/2):86-99
[51] YAN R, SHEN X, HUANG J,. Examples of unusual ionospheric observations by the CSES prior to earthquakes [J]., 2018, 2(6):515-526
[52] PULLINETS S, OUZOUNOV D. The Possibility of Earthquake Forecasting [M]. Bristol: IOP Publishing, 2018
[53] HAYAKAWA M. Electromagnetic phenomena associated with earthquakes: a frontier in terrestrial electromagnetic noise environment [J]., 2004, 6:81-112
V 524, P 35
SHEN Xuhui, ZEREN Zhima, HUANG Jianping, YANG Yanyan, ZHAO Shufan, YAN Rui, ZHANG Zhenxia, LIU Dapeng, WANG Qiao, CHU Wei, LU Hengxin, XU Song, GUO Feng, TAN Qiao, LI Wenjing, ZHOU Na, SONG Fuxi. Current Status and Main Scientific Results of In-flight CSES Mission., 2020, 40(5): 662-678. DOI:10.11728/cjss2020.05.662
* Supported by National Key R&D Program of China (2018YFC1503501), Research Grant from Institute of Crustal Dynamics, China Earthquake Administration (ZDJ2019-22 and ZDJ2020-06) and the APSCO Earthquake Research Project Phase II
March 31, 2020
E-mail: zsf2008bj@126.com