Extreme Temperature Change of the Last 110 Years in Changchun, Northeast China
2020-04-01XiujingYUGuoyuRENPanfengZHANGJingbiaoHUNingLIUJianpingLIandChenchenZHANGJilinClimateCenterChangchun3006China
Xiujing YU, Guoyu REN, Panfeng ZHANG, Jingbiao HU,Ning LIU, Jianping LI, and Chenchen ZHANGJilin Climate Center, Changchun 3006, China
2Department of Atmospheric Science, School of Environmental Studies,
China University of Geosciences, Wuhan 430074, China 3Laboratory for Climate Studies, National Climate Center, China Meteorological Administration, Beijing 100081, China 4Jilin Province Weather Modification Office, Changchun 130062, China
5Institute of Meteorological Sciences of Jilin Province, Changchun 130062, China
ABSTRACT In China and East Asia, the long-term continuous observational data at daily resolution are insufficient, and thus there is a lack of good understanding of the extreme climate variation over the last 100 years plus. In this study, the extreme temperature indices defined by ETCCDI (Expert Team on Climate Change Detection and Indices) and local meteorological administrations were analyzed for Changchun City, Northeast China, by using the daily maximum temperature (Tmax) and daily minimum temperature (Tmin) over 1909-2018. The results showed that extreme cold events, such as cold days, cold nights, frost days, icing days, and low temperature days, decreased significantly at rates of -0.41 d (10 yr)-1, -1.45 d (10 yr)-1,-2.28 d (10 yr)-1, -1.16 d (10 yr)-1 and -1.90 d (10 yr)-1, respectively. Warm nights increased significantly at a rate of 1.71 d (10 yr)-1, but warm days decreased slightly and the number of high temperature days decreased at a rate of-0.20 d (10 yr)-1. The frequency of cold surge events increased significantly at a rate of 0.25 d (10 yr)-1, occurring mainly from the mid-1950s to late-1980s. The average Tmax, average Tmin and extreme Tmin increased at rates of 0.09°C (10 yr)-1,0.36°C (10 yr)-1 and 0.54°C (10 yr)-1, respectively; and extreme Tmax decreased significantly at a rate of -0.17°C(10 yr)-1. In 1909-2018, 1951-2018 and 1979-2018, the indices related to cold events decreased, while the trends of the indices related to warm events were different for different periods.
Key words: extreme temperature, climate change, long-term series, observation, Changchun, Northeast China
1. Introduction
In recent decades, the frequency and intensity of extreme weather and climate events in the Northern Hemisphere and East Asia have changed significantly (e.g. Alexander et al., 2006; Zhang et al., 2011a; Donat et al., 2013b;Sun et al., 2014). Katz and Brown (1992) argued that extreme climate events are more sensitive to climate change than the climate mean state. Although an extreme climate event has a small probability of occurrence, any change related to the frequency or intensity may have a significant impact on nature and society (Ballou, 2006; Hultman and Bozmoski, 2006; Zhou and Wang, 2009; Sun et al., 2014;Zhang et al., 2015). The European heat wave in 2003 (Stott et al. 2004), western Russia severe heat wave in 2010 (Rahmstorf and Coumou, 2011; Otto et al., 2012; Hauser et al.,2016), Hurricane Katrina in the United States in 2005 (Ballou, 2006), snow and ice event of South China in 2008 (Yin,2008; Zhao et al., 2008), the heat wave in central-eastern China in 2017 (Chen et al., 2019), and the record-breaking cold event in eastern China in 2016 (Qian et al., 2018a), for example, all caused serious disasters. At the same time, with the rapid progress of economic development and urbanization, the integrated disaster-reduction capacity of cities has weakened and the risk of disaster has increased, making the losses caused by extreme climate events increase year by year (Handmer et al., 2012).
Previous works have studied the characteristics of the long-term variation in the frequency and intensity of extreme temperature events in several land areas throughout the world (Easterling et al., 2000; Frich et al., 2002; Alexander et al., 2006; Caesar et al., 2006; Peterson and Manton,2008; Donat et al., 2013a, b), including China and East Asia(Yan and Yang, 2000; Zhai and Pan, 2003; Zhou et al.,2004; Ren et al., 2010; Sun et al., 2011; Zheng et al., 2011;Zhou and Ren, 2011; Qian et al., 2019), over the last half century. These studies found that, on different spatial scales,cold extreme temperature events in the last half century have significantly decreased, while the frequency of warm extreme temperature events has significantly increased.Besides, the extreme values of cold and warm temperatures have also undergone significant long-term changes.
Overall, due to the lack of observation before the 1950s in most parts of the world, current extreme climate research mainly focuses on the period after the mid-20th century,and few studies have been carried out for time scales of more than 100 years. In Europe, North America, Central Asia and South Asia, and Australia, analysis results of extreme temperature variations over the last century have been reported (e.g., Klein Tank et al., 2006; Moberg et al.,2006; Vincent and Mekis, 2006; Donat et al., 2013a), due to the better observation records of long-range daily surface air temperature. In China, several stations, including Shanghai, Tianjin, Hong Kong, and Macao, have been studied for extreme temperature variations for more than 100 years(e.g. Yan et al., 2001, 2002; Cui et al., 2009; Guo et al.,2011; Lee et al., 2011; Qian et al., 2015, 2018b). Currently,however, few studies have focused on extreme temperature changes at individual stations in the northeast and west of China over a longer period. This lack of analyses for periods of more than 100 years leads to a superficial understanding of extreme temperature variation and the long-term trend in northern parts of China.
By supplementing the early observational data record before 1950, this paper forms a daily temperature data series for Changchun Station for the last 110 years. Based on the extreme temperature indices defined by the Expert Team on Climate Change Detection and Indices (ETCCDI)(Alexander et al., 2006; Zhang et al., 2011b), and referring to the definitions of extreme cold and warm events by local meteorological administrations, this paper tests and analyzes extreme temperature variations at Changchun Station since 1909. This study is a useful addition to previous studies on extreme temperature variations in Northeast China,and it can also help in deepening our understanding of the characteristics and causes of local long-term extreme temperature variations.
2. Data and methods
2.1. Data and processing
The daily maximum temperature (Tmax) and minimum temperature (Tmin) data of Changchun Station from 1909 to 2018 were selected for this study. The daily Tmaxand Tmindata from 1951 to 2017 were obtained from the dataset of the National Meteorological Information Center, China Meteorological Administration, which had been processed for quality control and homogenization. Inhomogeneities due to observational system change, relocation and instrumentation, including the shift from manual to automatic observation, had been adjusted (Cao et al., 2016). The data from 1909 to 1950 and 2018 were obtained from the Jilin Province Meteorological Information Center, in which the temperature data from 1943 to 1948 were missing.Changchun Station relocated three times (in 1937, 1957 and 1980) (Fig. 1) and changed observational instruments five times. Before 1979, the surrounding environment of Changchun Station was natural vegetation (see Table 1 for details).
A new data quality control procedure and inhomogeneity test were conducted in this work. The details are as follows:
There were two steps in the quality control. First, if the daily Tminwas larger than the daily Tmax, the data were considered to be unreasonable. Second, if the daily Tmaxor Tmindata deviated largely from the actual situation (exceeding four times the standard deviation), they were defined as outlier values. A total of 108 unreasonable records were found after the testing, which were removed and regarded as missing values.
All the missing and unreasonable records in this study were considered as missing data, and they were no longer interpolated. The method may be slightly conservative for the study of extreme values, but it will make the results more reliable.
Homogeneity detection was carried out. The homogeneity of climate data is crucial for the study of local climate change as well as extreme climate indicators (Yan et al.,2014). The PMF (Penalized Maximal F) method provided by the RHtestsV4 software package (Wang and Yang,2013) was used to test the homogeneity of the monthly mean maximum and minimum temperature series since 1909 with consideration of the information on the change in historical observation locations and practices of the station.It was found that breakpoints of Tmaxand Tminoccurred in both 1952 and 1987 at the significance level of 0.05. As shown in Table 1, however, there were no corresponding relocations, instrument changes or observation height changes in or around 1952 and 1987. Therefore, the data of the detected breakpoints were not adjusted. The break points were considered as naturally caused abrupt changes. Indeed, the abrupt warming in 1987 in northern China has been widely reported (e.g., Ren et al., 2005; Cao et al., 2016).
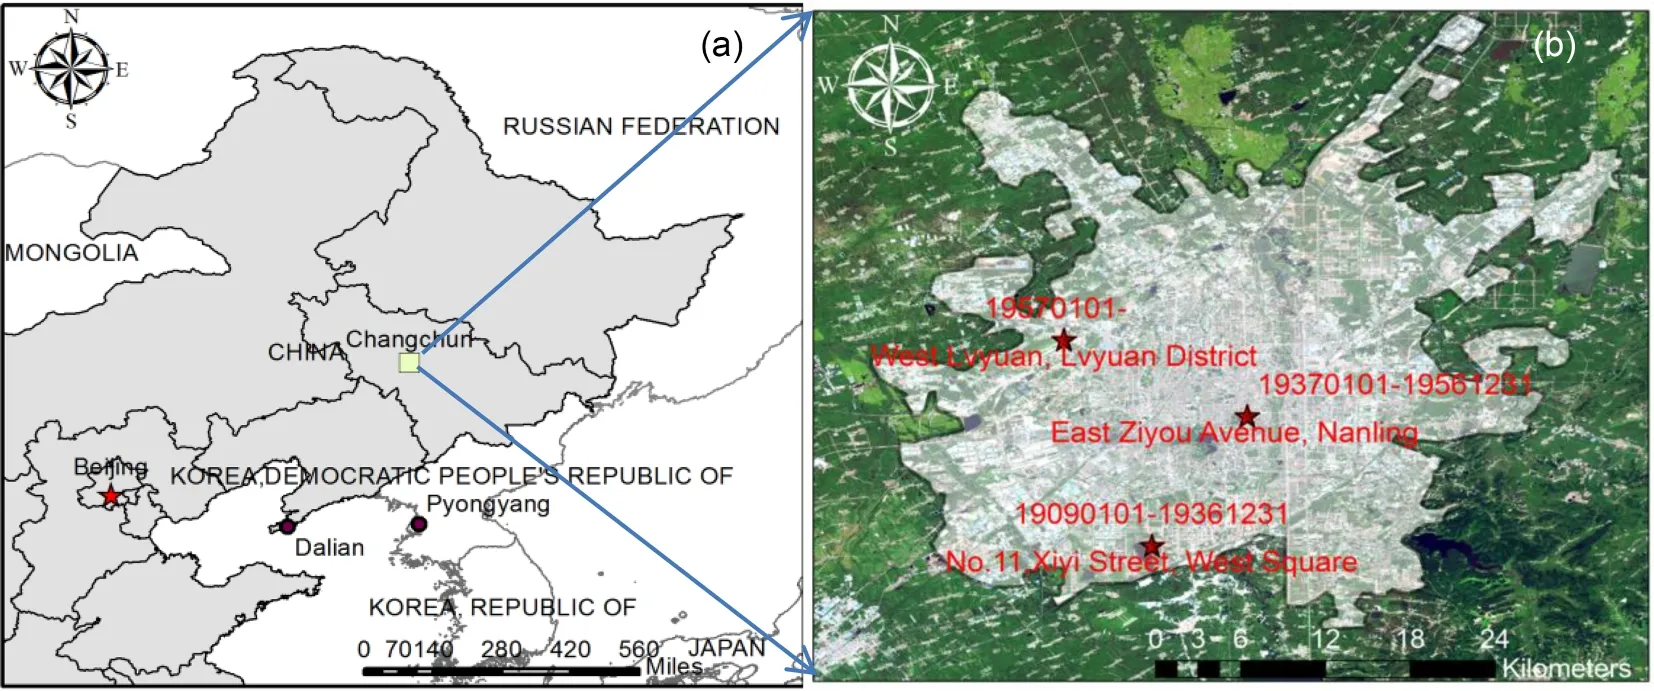
Fig. 1. (a) Location of Changchun. (b) Map of Changchun's built-up area, with the three stars showing the locations of weather stations in the last 110 years.
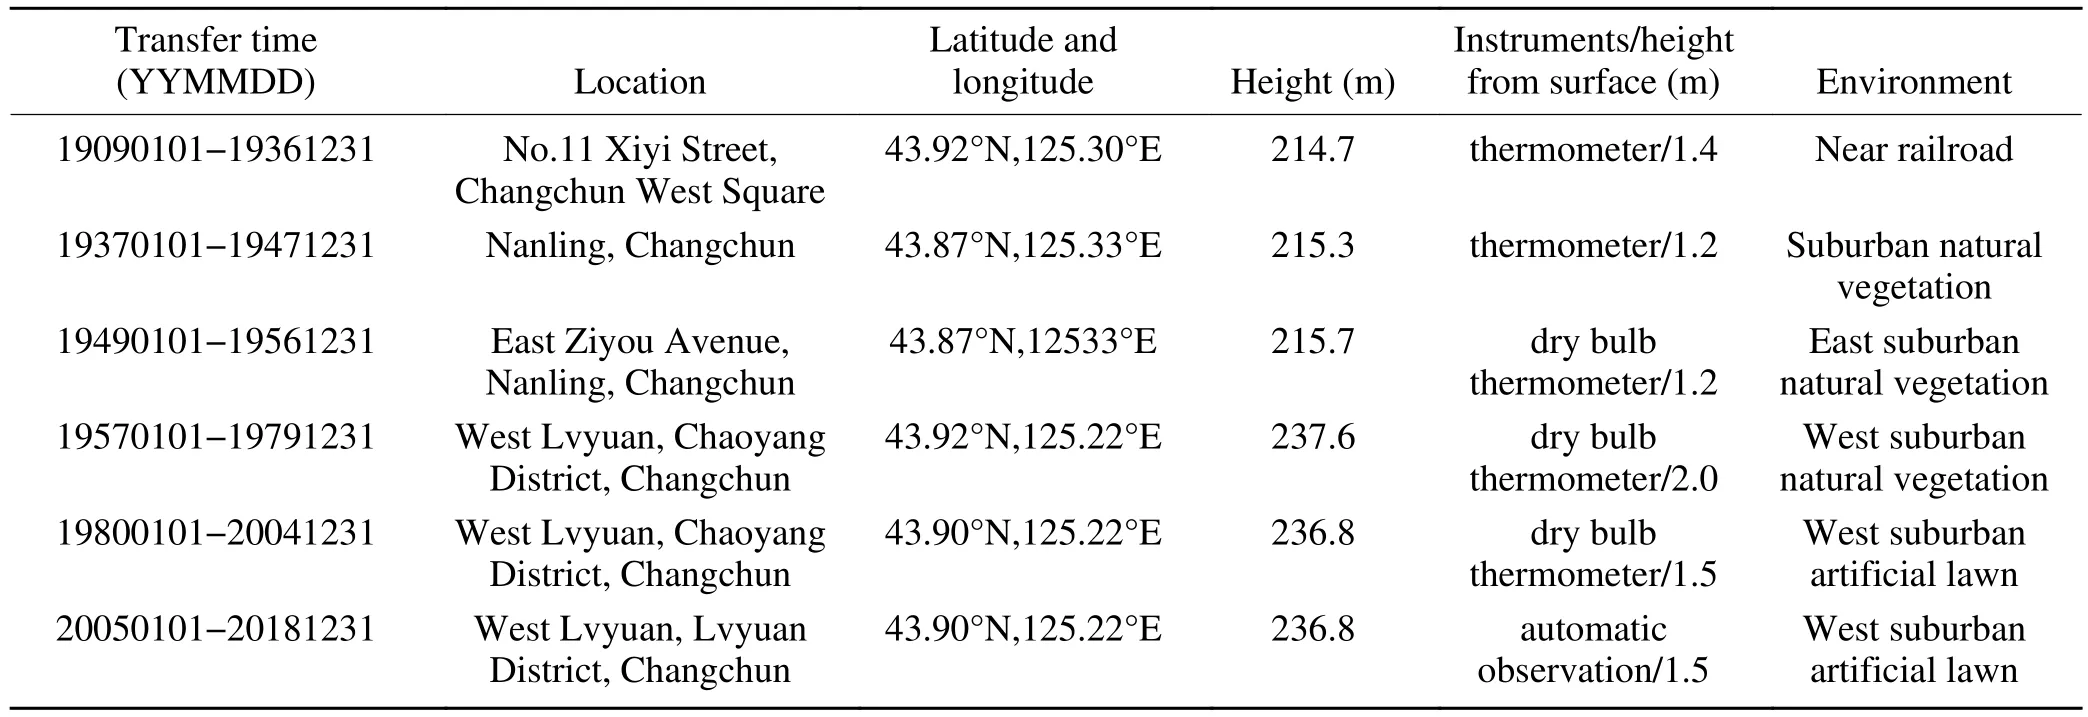
Table 1. The metadata of Changchun Station.
2.2. Definition and analysis methods
Rare events are called extreme events in a statistical sense. Extreme climate indices are generally used to study the long-term change in extreme climate events. In this study, twelve extreme temperature indices were selected,which included nine extreme temperature indices defined by ETCCDI and three commonly used indices defined by local meteorological administrations (Table 2), to study the changes of extreme temperature. The extreme temperature indices as recommended by ETCCDI are of weak extremity,low noise and strong significance, which can reflect the characteristics of the variation in different aspects of extreme climate. Cold surge days, high temperature days and low temperature days as applied by local meteorological administrations mainly occur in specific seasons. For example, cold surge days usually occur in the transitional season between winter and summer, i.e., spring and autumn. The day-to-day temperature fluctuation is large during these seasons. The daily decrease of Tminwithin 24 h is ≥ 8°C and the daily Tminis ≤ 4°C in the case of cold surges. High temperature days often occur in the hot summer, with the daily Tmax≥32°C. Low temperature occurs in the cold winter, with the Tmin≤ -25°C. The above three extreme events have a significant impact on human health, production and life. The threshold indices are defined in Table 2. Detailed definitions and calculation methods for the ETCCDI indices can be found in Zhang and Feng (2004) (http://etccdi.pacificclimate.org/list_27_indices.shtml). The units of the four relative threshold indices (TX10p, TN10p, TX90p, TN90p)were converted to days for ease of understanding. The derived data for all the annual extreme temperature indices of 1909-2018 at Changchun Station were given in Table S1 in the electronic supplementary material (ESM).
Because extreme climate indices series often violate the assumption of a Gaussian distribution, and autocorrelation exists in extreme temperature series (Zhang et al., 2000,2019; Qian et al., 2019), the trends and their significance of extreme temperature series were calculated based on the modified Theil-Sen trend estimator (Zhang et al., 2000; Wang and Swail, 2001) and Mann-Kendall test (Mann, 1945; Kendall, 1955), respectively, which account for the lag-1 serial correlation and do not need the Gaussian assumption. It should be noted that, when calculating the variance of the Mann-Kendall test statistic S, the ties or repeated values were considered (Jassby and Cloern, 2017), which is consistent with the suggestion in Qian et al. (2019).
3. Results
3.1. Variation in extreme temperature indices
The 110-year (1909-2018) mean Tmaxin Changchun was 11.2°C. In the last 110 years, the annual mean Tmaxshowed a significant increase, with a rising trend of 0.09°C(10 yr)-1(p < 0.01). The variations in annual mean Tmaxcan be divided into two periods, with 1988 as the shifting point.The mean Tmaxof 1909-1988 was 11.0°C, which kept fluctuating and had no obvious long-term trend. The annual mean Tmaxof 1989-2018 showed a gradual upward trend with a rate of 0.21°C (10 yr)-1, which was not statistically significant. The highest value of annual Tmaxin the last 110 years was 13.0°C, which appeared in 2007, and the lowest was 9.1°C, in 1915 (Fig. 2a).
The annual mean Tminin Changchun was 0.05°C for the whole period. In the 110 years, the annual mean Tminshowed an obvious upward trend, with a rate of 0.36°C(10 yr)-1(p < 0.01), which was about four times the annualmean Tmaxrate of increase. There were two distinct rising periods for annual mean Tminin the last 110 years; namely,1909-1934 and 1952-1988. The warming rates of the two periods were 0.58°C (10 yr)-1and 0.36°C (10 yr)-1(p <0.05), respectively. In 1987, there was an abrupt rapid warming of Tmin. The annual mean Tminrose from 0.4°C in 1987 to 2.5°C in 1990, and then a high value maintained until 2018. From 1989 to 2018, the annual mean Tminfluctuated between 1.0°C and 3.0°C, with no obvious variation trend.The highest value of annual mean Tminin the last 110 years was 2.9°C, which appeared in 2007. The low values mainly concentrated in 1909-1920, and the lowest value (-2.3°C)was in 1917 (Fig. 2b).
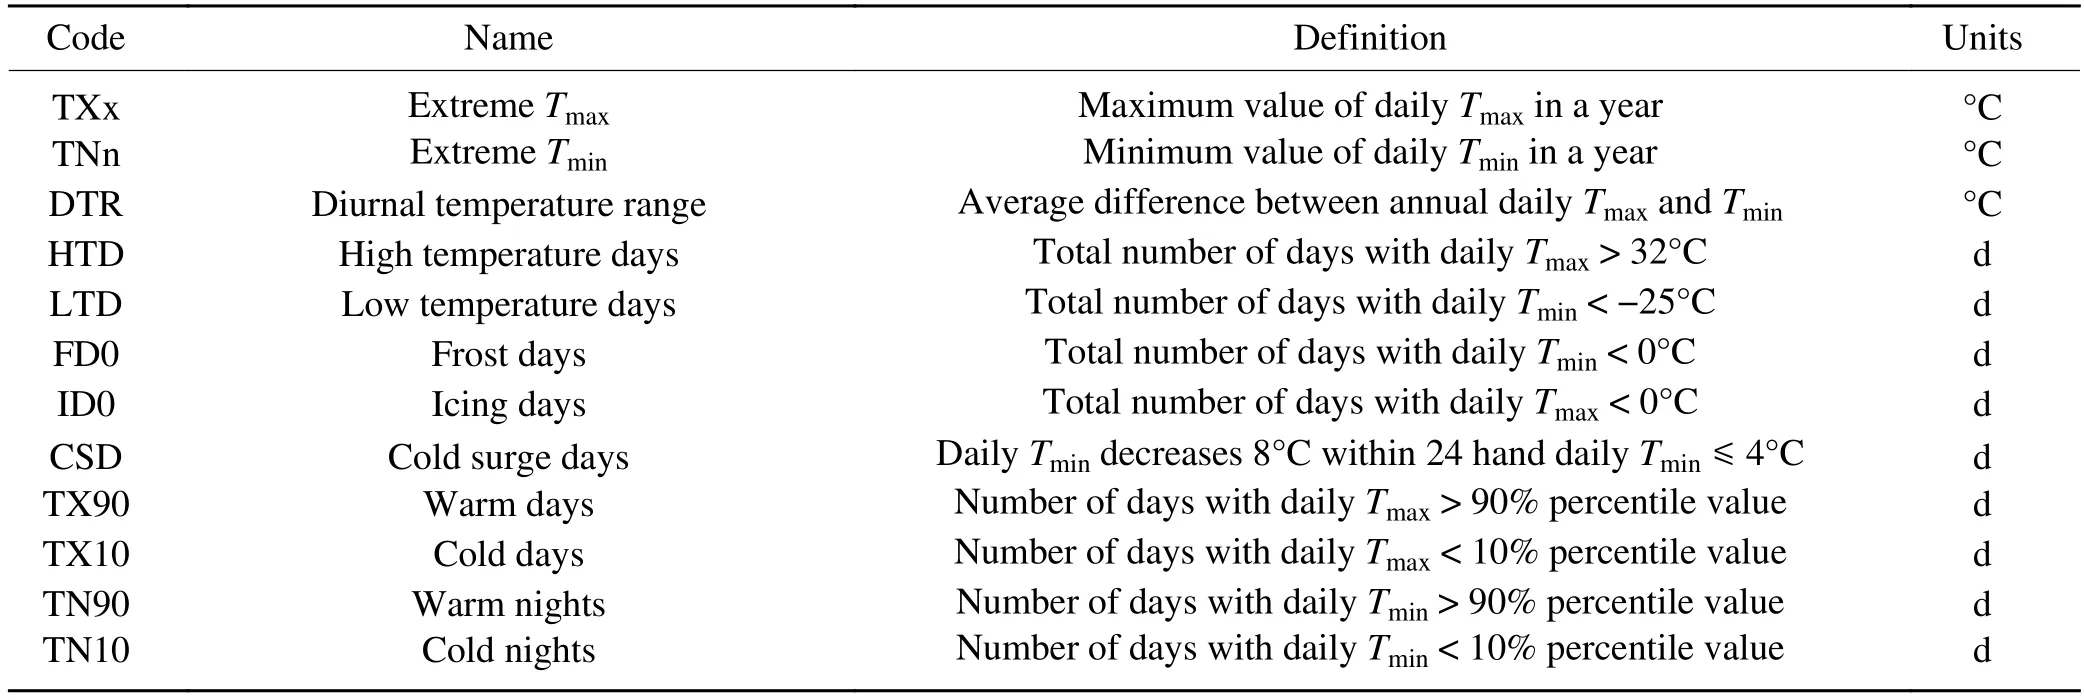
Table 2. Definitions and units of extreme temperature indices.
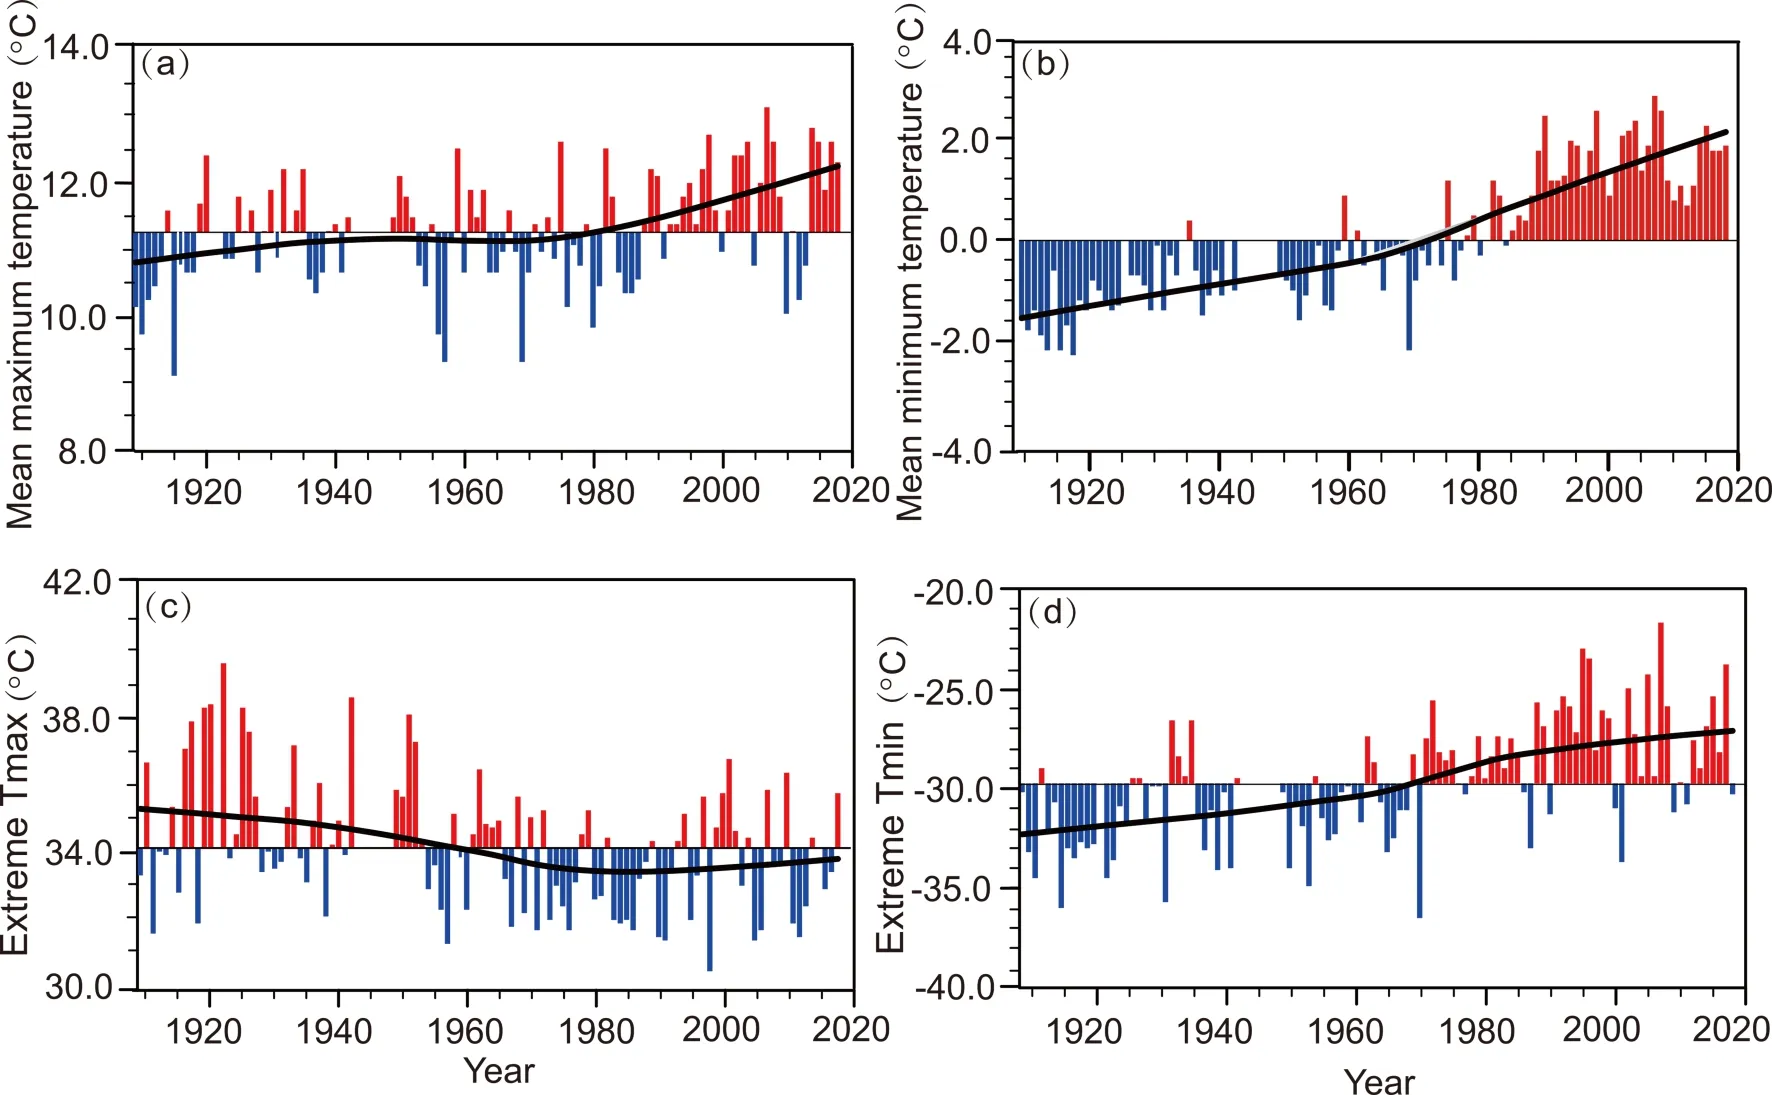
Fig. 2. Temporal variation of extreme temperature indices in Changchun from 1909 to 2018: (a) annual mean Tmax(mean maximum temperature); (b) annual mean Tmin (mean minimum temperature); (c) annual maximum Tmax(TXx); and (d) annual minimum Tmin (TNn). The black smooth curves on the bar chart were obtained by using locally weighted scatter smoothing (LOWESS) method (hereinafter the same).
The 110-year average annual maximum Tmax(TXx) in Changchun was 34.1°C, and the annual maximum Tmaxshowed a marked decreasing trend in the last 110 years,with a rate of -0.17°C (10 yr)-1(p < 0.01). From the interannual variation curve, the annual maximum Tmaxin the three periods (1909-1920, 1922-1986 and 1987-2018) showed an increasing-decreasing-increasing variation pattern. The annual maximum Tmaxin 1922-1986 presented a significant decreasing trend, with an average decreasing rate of-0.40°C (10 yr)-1(p < 0.05). In the 110 years, the highest value of annual maximum Tmaxwas 39.5°C, which appeared in 1922, and the lowest was 30.5°C, in 1998—one of the warmest years in the last 60 years (Fig. 2c).
The 110-year average annual minimum Tmin(TNn) in Changchun was -29.7°C. It increased gradually during the 110 years, with an increasing rate of 0.54°C (10 yr)-1(p <0.01). The annual minimum Tminvariation can be divided into two stages. First, there was a slight upward trend in 1909-1942. Second, a significant upward trend presented in 1949-2018, with an upward rate of 0.76°C (10 yr)-1(p <0.05). Besides, the annual minimum Tminin the 33 years from 1986 to 2018 experienced three periods of rapid cooling and gradual warming; namely, 1986-1996, 1997-2007 and 2008-2018, with a cycle of about 11 years. The lowest value of annual minimum Tminwas -36.5°C, which appeared in 1970, and the highest was -21.7°C, in 2007(Fig. 2d).
The annual mean diurnal temperature range (DTR) in Changchun was 11.2°C for the 110 years. The annual mean DTR showed a significant decreasing trend, with a decreasing rate of -0.29°C (10 yr)-1(p < 0.01). The interdecadal variation of annual mean DTR was obvious. The values were high from 1909 to 1952, showing a slight decreasing trend.Then, from 1952 to 1994, a marked decreasing trend could be seen, with a rate of -0.44°C (10 yr)-1(p < 0.05).However, from 2005 to 2018, it showed an increase,although the ascending rate was not large. The smallest value of annual mean DTR was 9.3°C, in 2010, and the largest was 13.0°C, in 1921 (Fig. 3).
From the variation in extreme temperatures, it can be seen that the variations in extreme high and low temperatures were asymmetric, and the DTR decreased obviously,which was mainly due to the significant increase in Tmin.
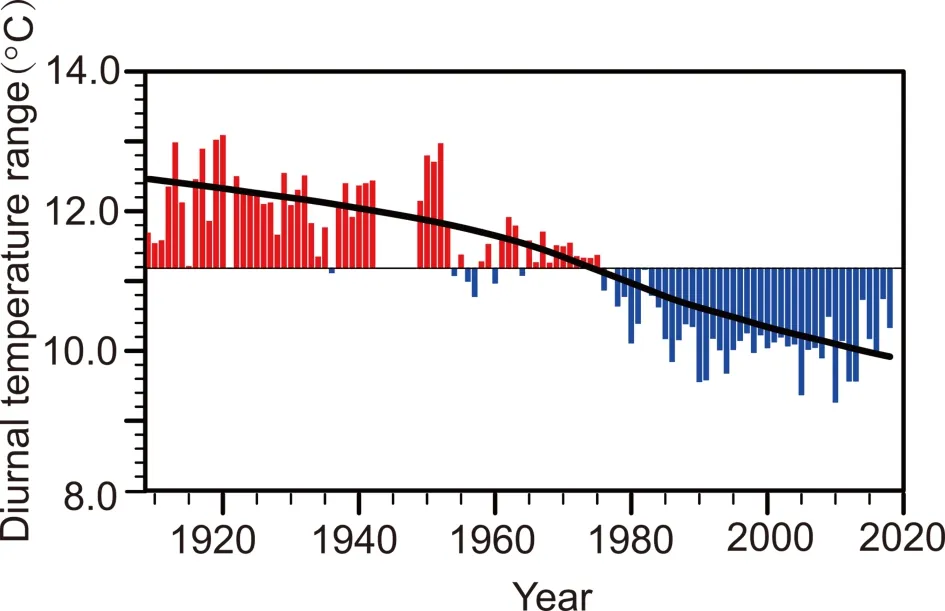
Fig. 3. Variation in annual mean DTR in Changchun from 1909 to 2018.
3.2. Variation of absolute threshold indices
The 110-year average annual number of high temperature days with daily maximum temperature above 32°C in Changchun was 7.2. In the 110 years, the years with the number of high temperature days over 15 mainly occurred in 1916-1959, with the largest one of 37 days in 1919.However, the years with the number of high temperature days less than 5 mainly occurred in 1968-2018. The number of high temperature days has been decreasing as a whole, with an average decreasing rate of -0.20 days (10 yr)-1.The number of high temperature days increased significantly in 1909-1920 and decreased significantly over 1920-1967. The number of high temperature days in 1968-2018 was relatively small without an obvious variation trend. There were no obvious changes in annual extreme high temperature and high temperature days after 1960. This is consistent with the conclusions of Zhai and Pan (2003) and Yan and Yang (2000) in that the temperature of hot summers has not increased significantly since 1960. This may be caused by industrial aerosol emissions during the daytime (Qian and Fu, 1996).
The 110-year average annual number of low temperature days with minimum temperature below -25°C in Changchun was 12.8. Low temperature days showed a significant decreasing trend in the last 110 years, with an average rate of -1.90 d (10 yr)-1(p < 0.01) (Fig. 4b). Among them, the number of low temperature days in 1909-1920 was significantly larger, with an average of 22 days and a maximum value of 41 days in 1917. The number of low temperature days in 1938-1987 decreased significantly from 25 days to about 5 days, with a rate of -2.61 d (10 yr)-1(p <0.05). The number of low temperature days in 1988-2018 was relatively small, with an average of 4.5 days, without an obvious variation trend (Fig. 4b). The variation is consistent with the increase in warm winters in North China since the end of the 1980s (Chen et al., 2009).
The 110-year average annual number of frost days in Changchun was 172, and the variation in frost days showed a decreasing trend over the whole period, with a decreasing rate of -2.28 d (10 yr)-1(p < 0.01) (Fig. 4c). The numbers of frost days in 1909-1942 and 1976-2005 presented a significant decreasing trend, with decreasing rates of -2.26 d (10 yr)-1and -6.84 d (10 yr)-1(p < 0.05), respectively. However, the number of frost days in 1949-1975 and 2006-2018 kept fluctuating without an obvious trend. The three years with the fewest frost days were all after the end of the 1980s, which were 1990 (148 days), 2014 (149 days) and 1998 (150 days). The year with the largest number of frost days was 1926 (192 days) (Fig. 4c). The reduction in frost days and the prolongation of the frost-free period are good for agricultural production (Feng et al., 2015).
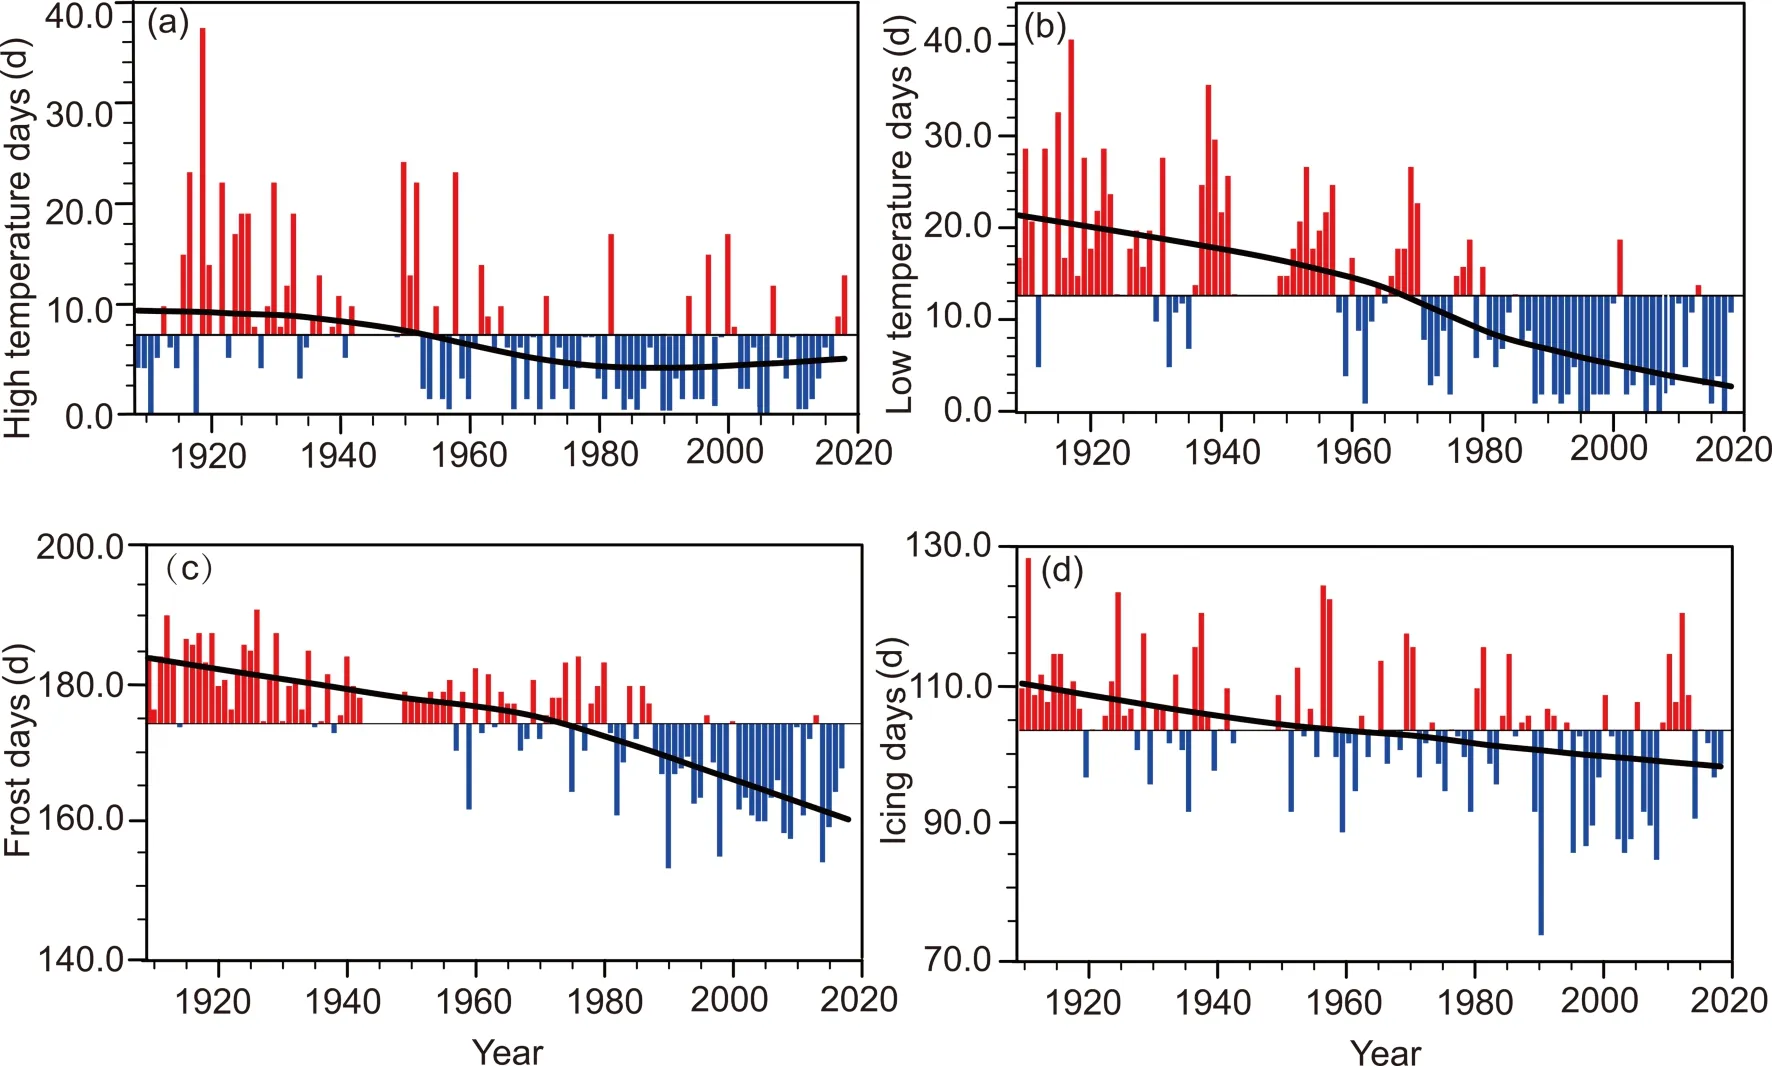
Fig. 4. Variation in the absolute threshold temperature indices in Changchun from 1909 to 2018:(a) high temperature days; (b) low temperature days; (c) frost days; and (d) icing days.
The 110-year average annual number of icing days in Changchun was 104, and the number of icing days showed a significant decreasing trend in over the study period with a rate of -1.16 d (10 yr)-1(p < 0.01). The variation was milder than that of frost days (Fig. 4d). From the interannual variation, 1997 was the shifting point, with icing days decreasing from 1909 to 1997 at a rate of -1.26 d (10 yr)-1(p < 0.05) and increasing slightly from 1998 to 2018. Fewer icing days occurred in 1990-2008, with the smallest number appearing in 1990 (74 days) and the largest in 1910 (129 days) (Fig. 4d).
The 110-year average annual number of cold surge days in Changchun was 6.6, which showed an increasing trend at a rate of 0.25 d (10 yr)-1(p < 0.05). The number of cold surge days before 1940 was fewer than 6 in most years,and the years with cold surge days fewer than 3 were mainly in 1925-1938. The period of 1954-1987 was characterized by frequent cold surges, with an average of 8.1 days,and the years with cold surge days exceeding10 mostly appeared in that period, with the largest number in 1977 and 1987 (13 days) (Fig. 5). The number of cold surge days showed decreasing (1909-1925)-increasing (1926-1942)-decreasing (1976-1992)-increasing (2003-2018) pattern of decadal to multi-decadal variation. Different from the extreme temperature index change alone, the number of cold surges was more related to the frequency of cold air intrusions. The stronger cold air and the frequent influence of cold airflows led to more cold surges from the mid-1950s to late-1980s. Also during this period, the average minimum temperature increased most significantly (Fig. 2b). Further study is needed to examine whether there is a close correlation between them.
3.3. Variation in relative threshold indices
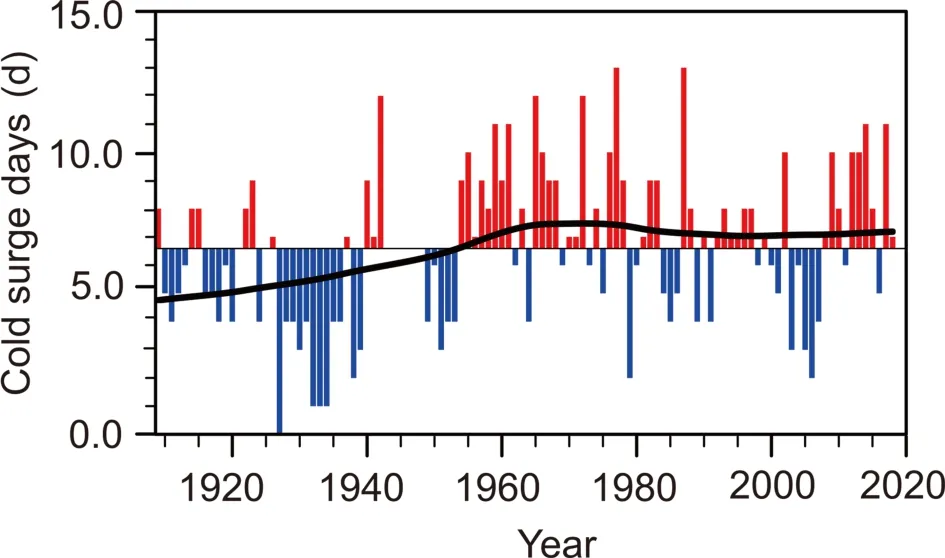
Fig. 5. Variation in cold surge days in Changchun from 1909 to 2018.
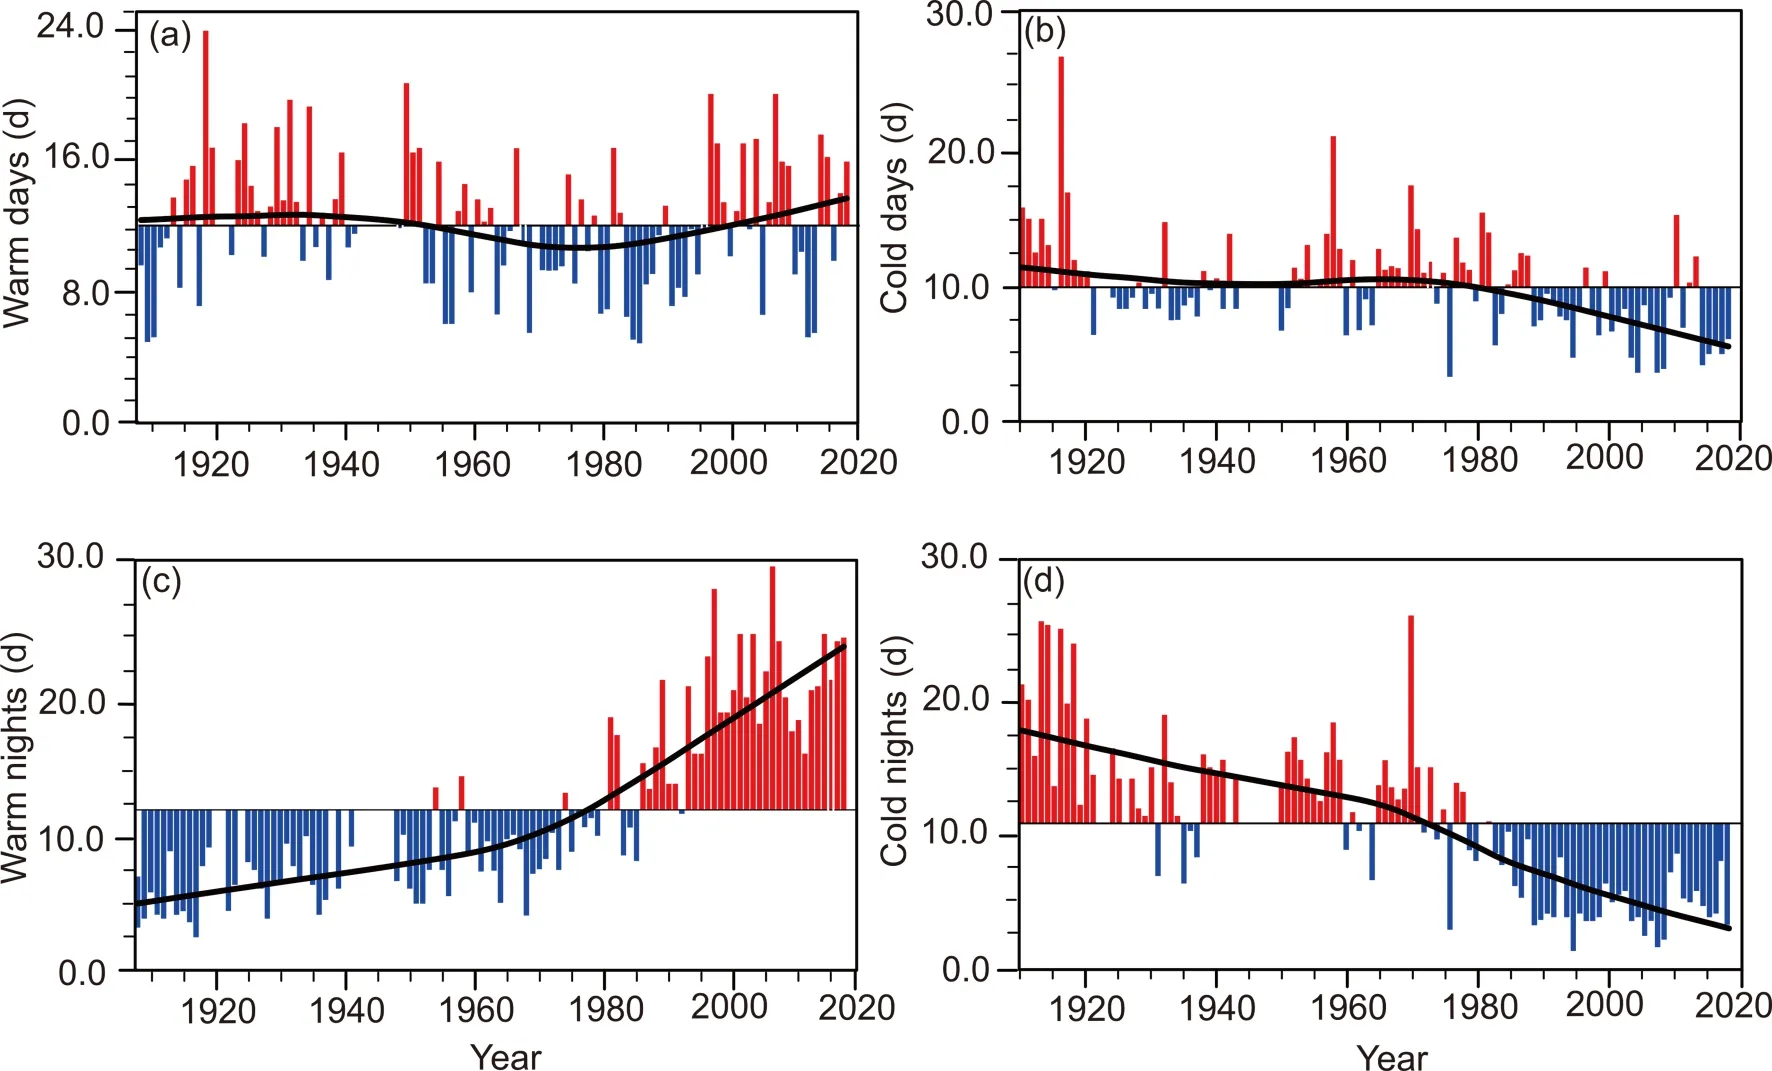
Fig. 6. Variation in relative threshold temperature indices in Changchun from 1909 to 2018: (a) warm days; (b) cold days; (c) warm nights; and (d) cold nights.
During 1909-2018, the number of warm days decreased slightly at a rate of -0.08 d (10 yr)-1. It was characterized by decadal to multi-decadal variations, with 1919-1935 and 1997-2015 being high-value years of warm days and 1954-1993 being low-value years (Fig. 6a). From 1919 to 1935, warm events had the same frequency as in 1997-2015. However, the earlier period had more warm days in summer, while the latter period had more warm days in spring and winter. Corresponding to the number of warm days, the temperature of warm days has decreased significantly in the last 110 years, with a rate of -0.47°C (10 yr)-1(p < 0.05) (figure omitted).
Over the last 110 years, the number of cold days in Changchun has been decreasing, at a rate of -0.41 d (10 yr)-1(p < 0.01). From the early-1990s to 2018, cold days showed a marked decreasing trend (Fig. 6b). The temperature of cold days has tended to increase slightly (figure omitted).From 1909 to 1995, the cold day temperature increased at a rate of 0.55°C (10 yr)-1(p < 0.05). The correlation coefficient between the temperature and number of cold day was-0.27 (p < 0.05).
The number of warm nights in Changchun increased significantly at a rate of 1.71 d (10 yr)-1(p < 0.01). There were two significant increasing periods, 1909-1959 and 1969-2007, with increasing rates of 0.85 d (10 yr)-1and 4.62 d (10 yr)-1, respectively (p < 0.05). Warm night events increased rapidly after 1970, increasing twice from the beginning of the 1970s to the end of the 1990s (Fig. 6c). From 1909 to 2018, the temperature of warm nights tended to decrease slightly (figure omitted).
The number of cold nights in Changchun decreased significantly at a rate of -1.45 d (10 yr)-1for the period 1909-2018 (p < 0.01). There were two significant periods of reduction in 1909-1936 and 1959-1994. The reduction rates were -7.14 d (10 yr)-1and -2.58 d (10 yr)-1, respectively (p < 0.05). The number of cold nights in Changchun during 1995-2018 was at a low level, without any further decrease (Fig. 6d). In the last 110 years, the temperature of cold nights has been increasing, with an average increasing rate of 0.63°C (10 yr)-1(p < 0.05). The temperature of cold nights in 1909-1952 was relatively low, and it increased significantly in 1953-1990 at a rate of 1.92°C (10 yr)-1(p < 0.05).
3.4. Comparison for different periods
A comparative analysis of the changes in the extreme threshold indices in the three periods of 1909-2018,1951-2018 and 1979-2018 showed that most of the trends of extreme indices in 1909-2018 and 1951-2018 were statistically significant at the 0.05 level, and the rate of change in most indices in 1951-2018 was relatively large (Fig. 7). In the three time periods, the cold-related indices, such as cold nights, cold days, low temperature days, frost days and icing days, all showed a decreasing trend. The corresponding temperatures, such as extreme minimum temperature and average minimum temperature, showed a significant increasing trend. These results are consistent with other research at larger spatial scales (e.g., Moberg et al., 2006; Vincent and Mekis, 2006; Cui et al., 2009; Guo et al., 2011;Zhou and Ren, 2011). The indices related to warm events,such as annual mean maximum temperature and warm nights, showed a significant increasing trend.
However, the number of warm days, high temperature days and extreme maximum temperature showed a decreasing trend in the 110 years, which was unexpected and inconsistent with most previous analyses, but consistent with the results of Guo et al. (2011) for Tianjin, North China, and Cui et al. (2009) for Shanghai, East China. The rate of change in these warm indices was significantly smaller compared to the cold indices (Table 3, Fig. 7). Unlike the 110-year period, the warm-related indices increased during the 40-year period from 1979 to 2018, and the warm days and warm nights increased significantly, which is consistent with the research of Zhou and Ren (2011) for North China.It can be seen that the characteristics of the variation in warm indices are different when the study period varies.The differences in the variation of warm indices between the two periods may be due to the obviously higher summer maximum temperature between 1920 and 1940 (Xu et al., 2000; Tang and Ren, 2005), which made the warm indices larger in the earlier period. Xu et al. (2000) and Sun et al. (2019) suggested that the high daytime temperature in the summer of the earlier period may be mainly related to the low emissions of sulfate aerosols and the resulting stronger solar radiation.

Fig. 7. Extreme temperature index trends [units: d (10 yr)-1] for different periods (1909-2018, 1951-2018, 1979-2018 and 1990-2018) in Changchun.
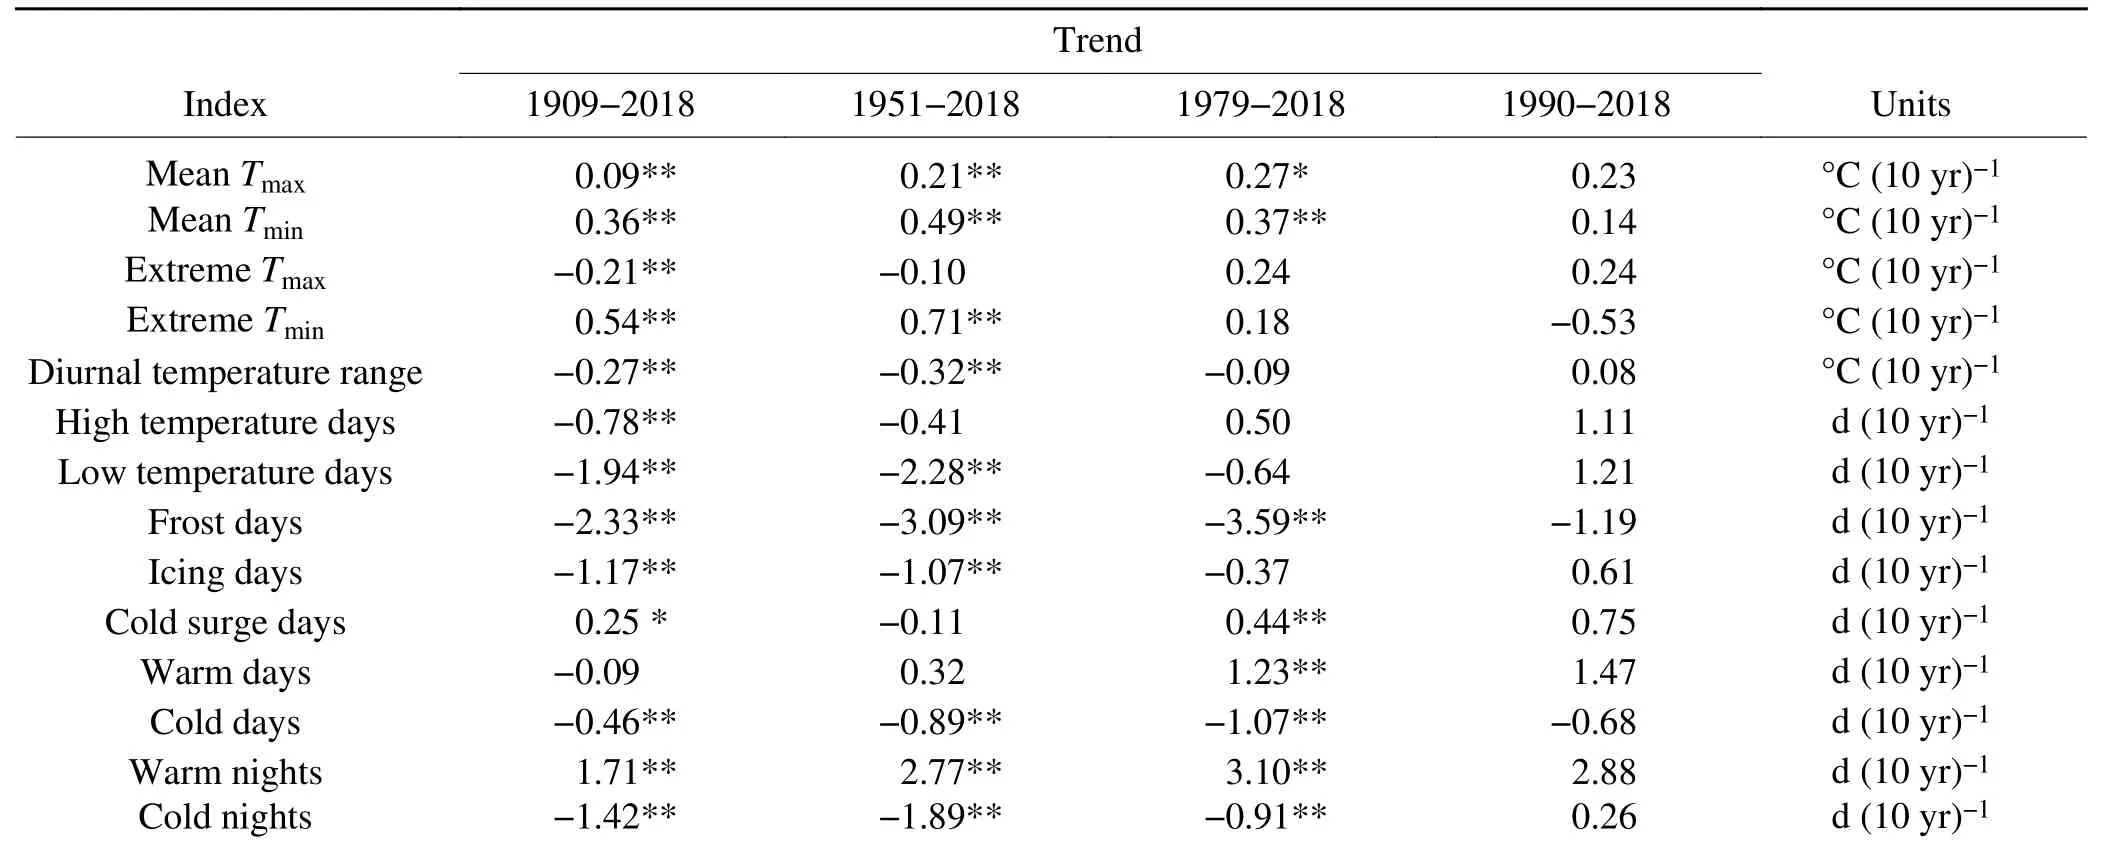
Table 3. Variation trends of extreme temperature indices for different periods at Changchun Station.
There was a sudden rise in minimum temperature at the end of the 1980s. From 1990 to 2018, the change in minimum temperature tended to be small. The corresponding extreme low temperature indices, such as the number of low temperature days, cold nights, average minimum temperature, extreme minimum temperature, frost days and icing days, generally had no significant change trend. The number of extreme cold events was at a low level, and the number of extreme warm events, including warm days and warm nights, was at a historically high level, especially for the number of warm nights.
4. Discussion
Due to the lack of observations, there have been few studies of extreme temperature change for the first half of the 20th century in developing regions like China. This paper makes a first analysis of extreme temperature change in the last 110 years for Changchun City, Northeast China, by using the daily temperature data from 1909 to 2018.
In the early 20th century (1909-1920), warm days and warm nights were few, and cold days and cold nights were more frequent in Changchun. Extreme cold events occurred more frequently in the earlier period in Changchun, which is generally consistent with the conclusions reached by Wang(1990), Wang et al.(1999), and Tang and Ren (2005),in their studies of regional average temperature change in China. They showed that the annual and summer mean temperature was obviously low before 1920, and cold summers in Northeast China were more frequent in the 1910s. In the 1920s-1930s, the temperature rose significantly. During 1920-1940, extreme maximum temperature, high temperature days and warm days in Changchun were relatively high(large in number). There was no obvious increase in low temperature during this period. This led to a significantly higher DTR compared to the latter half of the century.
To better understand the extreme climate change, it is necessary to evaluate and correct the inhomogeneities of the observational data. Before the mid-20th century, due to the lack of meteorological stations, the observational data(whether singular or missing) could not be corrected or interpolated with the corresponding data of nearby stations. The minor inhomogeneities caused by station relocation, instrument change and observation height change could not be corrected correspondingly, which may have a certain impact on the quality and homogeneity of data. However, preliminary tests showed that no obvious breakpoints could be found around the years of relocation and instrumentation change,indicating that the inhomogeneities of the data series were not caused by human intervention. The 1987 breakpoint detected in the data series was a regionally and naturally occurring abrupt warming event (Ren et al., 2005; Cao et al.,2016). In spite of this, data mining, digitalization and analyses of nearby stations in the early 20th century should be strengthened, and the integrity and reliability of Changchun's historical data should be further improved by comparing and analyzing the data of the reference stations.
In addition, the bias of surface air temperature data due to the effect of urbanization is also an important issue that needs to be evaluated or adjusted before analysis of extreme temperature indices change (Ren et al., 2005; Ren and Zhou, 2014). The gradual change of the environment near the observational site and the intensification of the urban heat island effect caused by urbanization can obviously affect estimates of the linear trend in extreme temperature indices, and introduce a systematic deviation from the background change. The urbanization bias may be the main source of uncertainty in the study of the frequency and intensity trends of extreme temperature events at local, regional and global scales, and needs to be eliminated from existing observational data series. However, if we pay attention to the extreme temperature change of a city station, the urbanization effect is a part of the climate change of that place. We can also determine the nature and extent of the urbanization impact by conducting attribution analyses, so as to lay a foundation for understanding the impact of other large-scale driving factors without correcting the urbanization effect. Previous studies have shown that the effects of urbanization on extreme temperature index series are large and significant in China, based on a few cases of urban stations and regional studies of North China and Chinese mainland (e.g., Zhang et al., 2011a; Zhou and Ren, 2011; Ren et al., 2014; Bian et al., 2015). The analysis of the urbanization effect on extreme temperature change at this station will be conducted in subsequent work by our group.
As a big city in Northeast China, Changchun's climate change has its own regional characteristics and uniqueness.This study of the change in extreme temperature indices over the past 110 years in Changchun can provide a reference and basis for further investigations into mean and extreme climate changes in the region. In addition, studies of extreme temperature change can also support local economic and social development, disaster prevention and mitigation, and offer a theoretical basis for natural-disaster early warning services and the formulation of emergency plans.
5. Conclusions
The trends of variation in extreme temperature indices at Changchun Station, Northeast China, in the last 110 years were analyzed by using long-term daily temperature data.The main conclusions can be summarized as follows:
(1) In the 110 years, the indices related to extreme cold events, such as cold days, cold days and cold nights,decreased, and the indices related to extreme warm events,such as warm days, high temperature days and extreme Tmax, also decreased; however, warm nights significantly increased. The trends of the warm indices were different for different periods.
(2) The decreasing rate of low temperature days was larger and more significant than that of high temperature days.The increasing rate of extreme minimum temperature was nearly three times that of extreme maximum temperature.The decreasing rate of cold days was about five times that of warm days. The variations in extreme cold and warm climate events showed asymmetry and the DTR decreased significantly.
(3) There were obvious differences in the characteristics of variation in the extreme warm indices in different research periods. In the last 40 years from 1979 to 2018, the indices related to warm events all showed an increasing trend, and there was a more obvious increase with warm days and warm nights. From 1990 to 2018, the extreme temperature indices had no significant change in their trends.
Acknowledgements.This study was supported by the National Key R&D Program of China (Grant No. 2018YFA06 05603).
Electronic supplementary material:Supplementary material is available in the online version of this article at https://doi.org/10.1007/s00376-020-9165-z.
杂志排行
Advances in Atmospheric Sciences的其它文章
- Influence of the Arctic on the Predictability of Eurasian Winter Extreme Weather Events
- Homogenized Daily Relative Humidity Series in China during 1960-2017
- Representing Model Uncertainty by Multi-Stochastic Physics Approaches in the GRAPES Ensemble
- Analysis of the Relationship between the Cloud Water Path and Precipi-tation Intensity of Mature Typhoons in the Northwest Pacific Ocean
- Responses of Mean and Extreme Precipitation to Different Climate Forcing Under Radiative-Convective Equilibrium
- Optimization of the OCO-2 Cloud Screening Algorithm and Evaluation against MODIS and TCCON Measurements over Land Surfaces in Europe and Japan
