Transient Pipe Tension Influence on Dynamic Positioning Control During S-Lay Installation
2019-12-10AIShangmaoLIUDepengLIPengMAGang
AI Shang-mao , LIU De-peng , LI Peng,2, MA Gang
(1. College of Shipbuilding Engineering, Harbin Engineering University, Harbin 150001, China; 2. CNOOC CENER Tech Company Oil Production and Service Branch, Tianjin 300457, China)
Abstract: Traditionally, dynamic positioning (DP) capability and tensioner capability of a laying vessel are calculated by static tension while the dynamic effects are either ignored or taken into account by empirical load amplification factors. A coupled dynamic model of normal S-lay was developed to simulate the closed-loop automatic control process integrating with DP controller. The model sufficiently takes account of the pipeline-rollers contact and the coupling between the pipeline and the controlled surface vessel. By conducting dynamic simulation in time domain and comparing the results achieved, significant coupled dynamic behaviours of applied DP thrust forces are observed, which offers very intuitive evidences of the transient tension effects concerning DP capacity assessment. And tensioner capacity based static results of the tension force would be overestimated.
Key words: S-lay; coupled analysis; transient tension; dynamic positioning
0 Introduction
S-type pipelay operations in deepwater are much more complicated than those in shallow water, and put greater demands on the laying equipment. Normal pipelay starts after completion of the start-up operation when the start-up head touches down on the seabed. Deepwater installation vessels typically require a dynamic positioning (DP) system due to its good performance and the simplified operation procedures for the station-keeping.
The governed parameters for an S-lay configuration include the pipe material properties,tension at the pipelay vessel, stinger shape (curvature radius and roller positions), departure angle and water depth[1]. Among these parameters, tension at the vessel is the only parameter that can be manipulated during the installation by adjusting the vessel position or the holding force of tensioners. The free spanning part from the touchdown point to the stinger gets longer when the water gets deeper. This will make the free spanning pipeline heavier. In order to maintain the sagbend configuration, a large tension force has to be applied to the pipe in order to secure a safe bending radius. Also, when the stinger guides the pipe as it bends from horizontal to the inclination, a more curved stinger is required to guarantee that the pipe does not reach the end of the stinger for the steepest expected departure angle[2].
To avoid losing the pipeline, the applied tension of the pipeline must be less than the workable tension limitation of tensioners. Additionally, the thrusters of a dynamic positioning (DP)system must have the capability to compensate for the external tension forces of pipe acting on the vessel. Traditionally, DP capability and tensioner capability of a laying vessel are calculated by static tension while the dynamic effects are either ignored or taken into account by empirical load amplification factors. This representation lacks the detailed understanding of dynamic interactions between the pipe and the DP station-keeping. A dynamic simulation in timedomain coupled with DP controller is significant to identify limiting environmental operation conditions and to analyze any risk associated with thruster saturation or thruster failures[3].
Some researchers have already emphasized the dynamic effect of the vessel motion on the spanning pipeline, such as Clauss et al (1992)[4]and Gong et al (2014)[5]. However, it is worth mentioning that the dynamic effective tension is still relative to the DP thrust force, because the DP system must compensate for the horizontal drag force of the pipeline. The purpose of this study is to analyze the transient tension effect when integrating S-lay operations with DP demand, since deepwater S-lay operations are a closed-loop automatic control process.
1 Numerical model of the pipeline
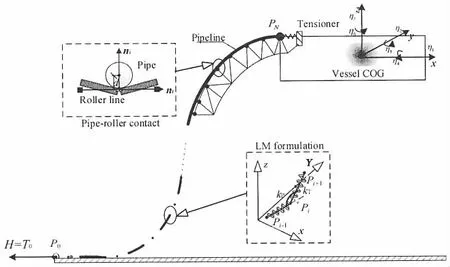
Fig.1 Lumped-mass discretization model of the S-lay simulation
A variety of techniques and methods have been developed for decades to analyse the response of marine pipelay system in a dynamic sea environment. the state-to-art computation programs coupled by increasing computer capacity have provided sufficient accuracy of prediction and simulation in spite of existence of uncertainties due to pipe-soil interaction. Herein, the code orcaflex is chosen to implement S-lay analysis because of its friendly interface with Matlab environment, which allows us to use a limited range of OrcaFlex’s facilities for adding the dynamic positioning (DP) tasks.
In the global coordinate system (XYZ), the ending point P0of the pipeline anchors on the flat seabed, while the point PNcontacts with the tensioner at the other end as shown in Fig.1.The axial stiffness of the line is modeled by simple spring elements between nodes, and bending is modeled by rotational springs. The pipeline is discretized into N elements (Ek, k=1…N)by N+1 lumped-mass nodes (Pi, i=0…N).
The lumped-mass of each element is concentrated on the nodes while the tension and the bending are modelled by extensional and rotational springs. The nonlinear stress-strain relationship of the pipeline is characterized by a load-dependent path of moment-curvature. In the Orcaflex, the Ramberg-Osgood formula is used, which has the following expression


The effective tension at the mid-point of line segment can be calculated as

where Twis the function relating axial strain to wall tension, Piand P0are the internal and external pressure respectively; Aiand A0are the internal and external cross-section areas of the stress annulus respectively; and ν is Poisson’s ratio. The upward contact forces between pipe and seafloor are included in the model while friction effects are neglected.
In practical situations, some of the rollers may miss the pipe contact, resulting in more concentrated forces acting on a fewer number of rollers. If astern/ahead loading acts on the vessel, the rollers can be simplified to a rigid line. Thus the stinger contact search becomes pointwise and depends on the minimum distance d shown in Fig.1.
2 Controlled motion equation of pipelay vessel
2.1 Motion equations in time domain


The exciting force FVon the right hand side including the environmental load, propulsion forces in DP system and the pipeline reaction force acting on the vessel is written as


The standard procedure for performing pipelay dynamic analysis consists of two stages. A static analysis is first applied with only the static components of the environmental loadings.The initial equilibrium positions of the vessel are defined as the static positions of the ends of pipelines. The governing motion equations of the pipeline are highly non-linear, and should be solved iteratively using an incremental correction approach.
The dynamic solution of Eq.(3) may contain spurious high frequency response, a feature inherent in the finite element method. The generalized-α integration scheme has controllable numerical damping which is desirable since it removes this spurious, non-physical high frequency response. This numerical damping also leads to much more stable convergence and hence allows for longer time steps and much faster simulations.
2.2 PID controller and thrust allocation
The thrust forces confine a vessel to pinpoint in a certain permitted range. The Proportion-Integration-Differentiation (PID) controller is herein adapted to control the pipelay vessel motions. The total thrust forces FDPin the PID controller consist of three components: surge, sway and yaw forces, formulated as

where ε=η-ηrefis the vessel position error, KP, KIand KDrepresent proportional gain coefficient, integral gain coefficient and differential gain coefficient. The function of the PID controller takes instant position η as input, and outputs the magnitude of thrust force. An effective way for filtering the oscillatory components of motion is Kalman-Filter[6].
After the thrust system receives the commanded force signal, thrusters produce proper forces and moment to compensate for the environmental loads. Considering a marine vessel equipped with m azimuth thrusters, the generalized force vector is given by

The vector u contains the magnitude of the force produced by each individual thruster, αiis the azimuth of the iththruster, and the ithcolumn of the matrix is given by

where (lxi, lyi)is the location of the iththruster. The quadratic programming (QP) method is used for the optimal thrust allocation algorithm.
2.3 Coupled solution with transient tension
The pipelay model comprises three distinct components: the vessel, the pipeline and a set of connecting contact springs. In this numerical simulation, all forces are not assumed to be feedforward terms but transient forces coupled with the PID controller. The vertical component of pipe reaction force acting on the vessel is passively compensated by the pipelay vessel restoring forces; the horizontal tension of the spanning pipeline is left to active control by the vessel motion control system.
The S-lay simulation is developed from integrating a marine systems simulator (MSS),which contains guidance, navigation, and control blocks for real-time simulation by using Matlab libraries[7]. Based on the framework of MSS, the pipeline, vessel and DP system are integrated into a closed loop. And the flowchart of the simulation code for pipelay vessel motion controlled by DP system is summarized in Fig.2.
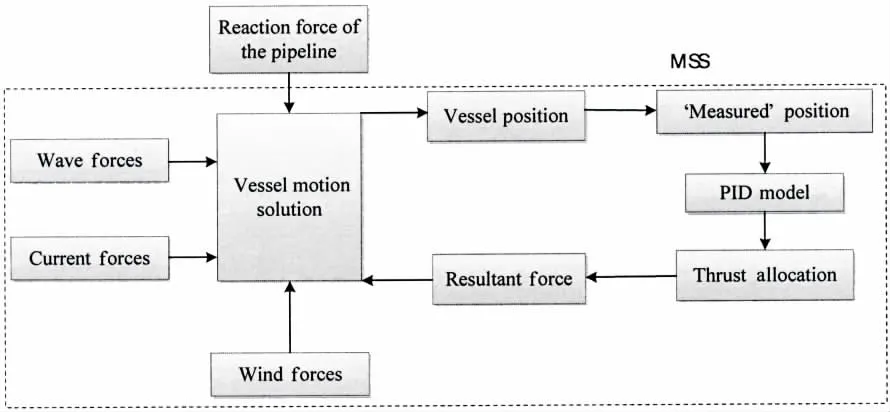
Fig.2 Flowchart of MSS code for vessel motion controlled by DP system
3 Cases studies
3.1 Parameters and conditions
Major particulars of the DP pipelay vessel are summarized in Fig.3 and Tab.1 (obtained from Yuan et al[8]and Sun et al[9]). There are seven azimuth thrusters in the pipelay vessel,thrusters #1 and #2 are main thrusters with downgraded maximum thrust 734 kN in the aft of the vessel. Five retractable thrusters are optimized for bollard pull, and the maximum thrust of each retractable thruster is 530 kN. Assuming the vessel is fully actuated, the available control input is the vessel thruster data limited to surge, sway and yaw.

Tab.1 Major particulars of ‘HYSY 201’
All studied cases are performed on a pipelay operation in 1 500 m water depth. The properties and input parameters of the laying pipeline are listed in Tab.2, and environmental conditions are shown in Tab.3. An idealized fixed stinger is connected to the stern for launching the pipe into the water at a suitable curvature. The pipeline is laid from 6.2 m below the main deck level at the stern of the barge for the radius of 110 m. There are 20 rollers mounted on the stinger section as shown in Fig.4, in which the rollers are numbered from up to down. It should be pointed out that the aim of performing such cases is to investigate the coupling or transient effect on operation simulation integrating DP demand; the capability of HYSY201 is not our focus, since the realistic parameters of the stinger structure and rollers position equipped on the HYSY201 are very different from the present model.
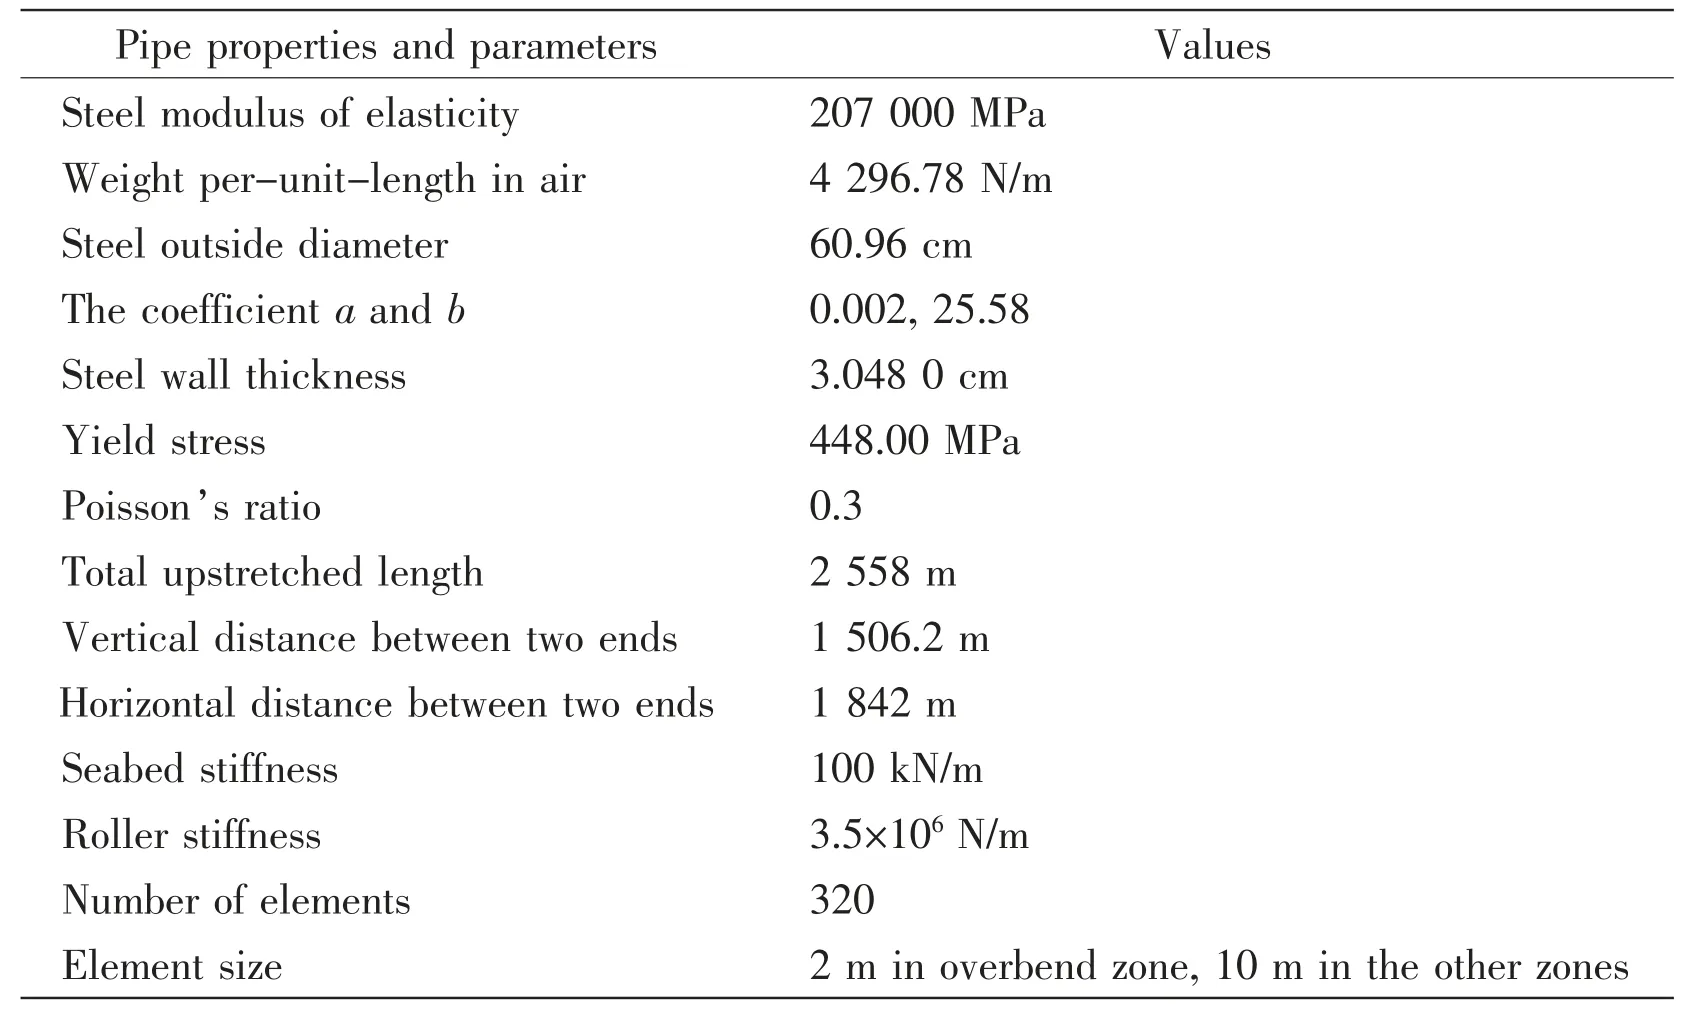
Tab.2 Pipe properties and parameters in studied cases

Tab.3 Environmental conditions in studied cases
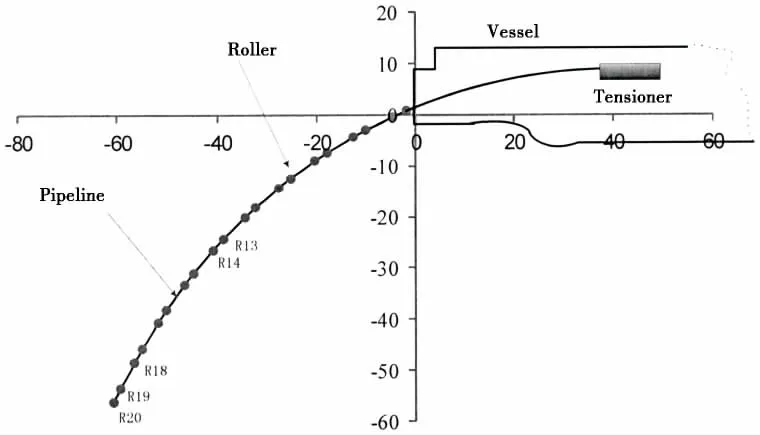
Fig.4 Arrangement position of the rollers in the pipelay simulation
3.2 Transient results and discussions
Firstly two transient coupled simulations are implemented by using the different PID coefficients. Fig.5 shows the contact results between rollers and pipeline in the case with high PID coefficients, indicating that Rollers 17 and 20 are not in contact with the pipe. The time-history results of vessel surge motion and the top tension shown in Fig.6 demonstrate that different PID coefficients lead to different vessel motion, and the DP controller is efficient to keep the vessel around the target position. Few varieties of the statistical tension are observed from both cases with low PID coefficients and high PID coefficients. The reason is that both of the vessel motions are still very small compared to the water depth.

Fig.5 Statistic value of contact spring forces acting on 20 rollers of stinger
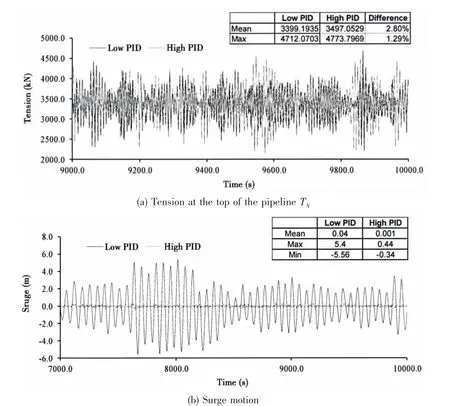
Fig.6 Comparison of time history results between low PID and high PID case

Fig.7 Time history statistics results of pipe bending stress along arc length
In the following, the dynamic contribution is discussed based on the results with low PID coefficients. Here a ratio defined by (Max-Mean)/Mean is used to investigate the dynamic contribution for bending stress and tension force of the pipeline.
The maximum bending stress in the overbend and the sagbend sections is shown in Fig.7.The maximum bending stress in the overbend section predicted from the coupled analysis differs from mean value by the ratio of 1%~2%. It can be concluded that the coupled dynamic approach has little dynamic effect on the stress safety assessment of pipes compared to the static state approach, since the overbend stress is much larger than the other part. The large variations of bending stress are observed in the lift-off point zone (about 200%) and touchdown zone(9.28%).
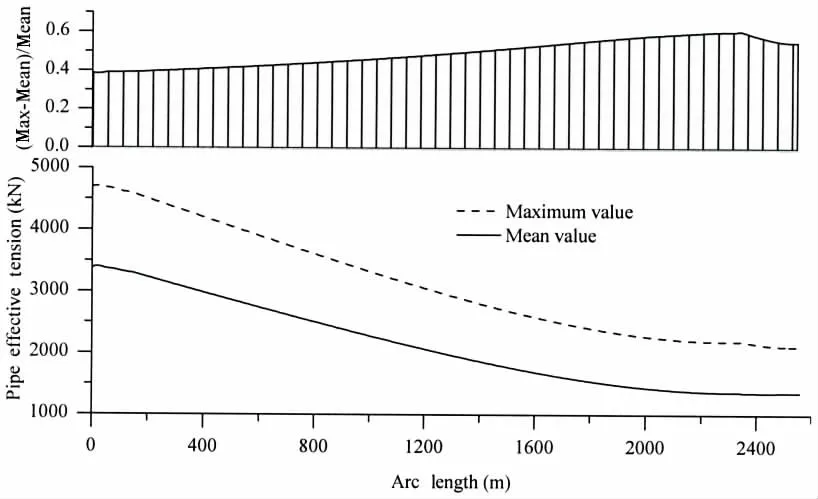
Fig.8 Time history statistics results of effective tension along arc length
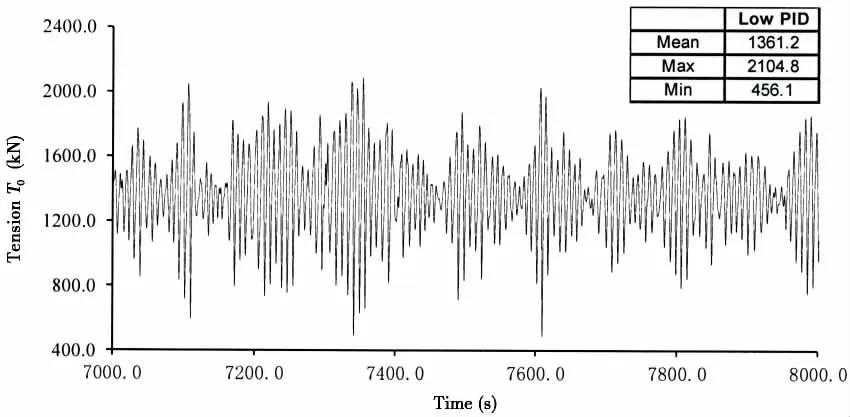
Fig.9 Time histories of transient tension force (T0) at the bottom end of the pipeline with low PID coefficient
Fig.8 demonstrates the pipe effective tension and dynamic contribution along the whole arc length. Large variations of the dynamic tension are observed, the ratio at most positions exceeds 37%. At the touchdown zone the ratio rises to 60.4%. Thus the dynamic contribution is significant for the effective tension.
Lastly it is necessary to investigate the transient tensions of two pipe-ends, since the two tensions are directly related to the tensioners and DP system. According to statistics value of the tension at the top end of the pipe (Point PNin Fig.1), the dynamic maximum tension of the high PID case is 44.3% higher than the mean value (shown in Fig.6a). It is noted that this transient tension force TNexceeds nominal allowance tension capacity 4 000 kN of the blocked tensioners. On the other hand, the dynamic effect of the tension force T0(shown in Fig.9) is also remarkable, with 66.5% larger than the mean value.
4 Conclusions
Simultaneous prediction of the transient tensions on the structural, motion response and DP force provides useful insights into S-lay operations in this study. The numerical model integrates the major aspects related to normal deepwater S-lay operation including the structural behaviour of the pipe, a roller-pipeline interaction, the DP forces via a PID controller and Kalman filter, and the loose coupling between the pipe structural response and the vessel motion response. The major contributions of this study are summarized as follow:
(1) A PID controller and Kalman Filter are integrated into the pipelaying motion equations in time domain. This coupling approach can be used to effectively predict the pipeline transient tension, surface vessel motion and required thrust force of the controller simultaneously to ensure operation safety.
(2) Numerical simulation results showed that the dynamic contributions are more significant for the tension force at the top of the pipeline than for the stress and strain of the pipeline structure. Tensioner capacity based static results of the tension force would be overestimated.
(3) Numerical simulation results offer very intuitive evidence of transient pipe tension effects on deepwater S-lay DP thrust. A coupled analysis approach in deep water is therefore recommended for the prediction of DP thrust forces to compensate the horizontal pipe tension.
杂志排行
船舶力学的其它文章
- Numerical Prediction of Propeller Noise Based on the‘Source Time-Dominant Algorithm’
- Simulation of Ship Motions Based on the HOBEM Acceleration Potential Method
- Experimental Study on Air Bleed Fusion of Underwater Vehicle
- Numerical Simulation of Cavity and Hydrodynamic Force of the Sphere Water Entry in Consideration of Surface Wettability
- Improved Moving Particle Semi-implicit Method with Large Eddy Simulation for Determining Water-entry Impact and Damage to Flat-bottomed Structures
- A Phase Modification Methodology in Modelling Deterministic Freak Wave Train
