Evaluating learning and change in orthopaedics: What is the evidence-base?
2019-11-14EpaminondasMarkosValsamisMohamedSukeik
Epaminondas Markos Valsamis,Mohamed Sukeik
Epaminondas Markos Valsamis,Nuffield Orthopaedic Centre,Oxford University Hospitals NHS Trust,Oxford,OX3 7LD,United Kingdom
Mohamed Sukeik,Department of Trauma and Orthopaedics,Dr.Sulaiman Al-Habib Hospital -Al Khobar,King Salman Bin Abdulaziz Rd,Al Bandariyah,Al Khobar 34423,Saudi Arabia
Abstract
Key words:Learning;Change;Quality improvement;Orthopaedics;Surgical education
INTRODUCTION
Learning and change are key elements of clinical governance,a framework through which healthcare organisations are accountable for continuously improving the quality of their services[1].Historically,despite a growing interest within medicine,orthopaedics has been slow to embrace quality improvement.However,in recent years there has been a global drive towards evidence-based improvement in the quality of service provision[2],surgical education[3],and outcome research[4,5].
The process of evaluating learning and change is what guides improvement strategy.We must accept that “not all change is improvement,but all improvement is change”[6].Proxies of performance and methods to analyse the change in performance over time are core themes of current healthcare research and play a critical role in the development of our specialty.This is evident in the increasing use of patient-reported outcome measures (PROMs) to guide evidence-based care and in the use of learning curve data as an assessment metric to promote self-regulated learning[7].
The aim of this review is to provide orthopaedic surgeons with an evidence-based introduction to the evaluation of learning and change in this era of healthcare quality improvement reform.
LEARNING
Proxies of learning
In order to draw meaningful conclusions from data,learning variables need to demonstrate high validity.Validity is “the extent to which an assessment measures what it intends to measure”[8].This is a judgment based on several factors,including whether the variable correlates with other ‘gold standard’ measures.
Proxies of learning are largely divided into surgical process and patient outcome variables.Surgical process variables include operative factors such as operative time,intraoperative blood loss,implant alignment,and fluoroscopy dose.Patient outcome variables include PROMs,mortality,morbidity,length of hospital stay,and transfusion requirement.A key systematic review by Ramsey and colleagues found that operative time was the most commonly used proxy of learning[9].Although this variable is easily accessible,its validity in the context of learning is less robust.Global rating scales for surgical procedures have been increasingly used to evaluate learning in orthopaedic surgery,and are probably a better surrogate marker of learning[10].In particular,their combination with motion analysis seems to offer a valid proficiency metric for arthroscopy simulators[11].More work is required to directly compare the validity of different proxies of learning in different orthopaedic procedures.
Learning curves
A learning curve is a graphical representation of the relationship between learning effort and learning outcome[12].It serves as a visual representation of the process of learning and allows researchers to employ statistical techniques to draw conclusions from the data.A typical learning curve resembles that of a negative exponential: With experience,a greater learning effort is required to produce the same improvement in performance[13].However,due to the high variability of surgical data,this is rarely the case in practice.Researchers are then faced with interpreting highly variable data from which to draw meaningful conclusions.
The most commonly employed technique to detect learning is the ‘split-group’method[14].The data is chronologically split into two or three consecutive groups of arbitrary size,and groups are compared byt-tests or equivalent.Although simple,this technique is fraught with bias and is increasingly disapproved by researchers.For example,a recent systematic review investigating the learning curve of the Latarjet procedure found that most included studies used the split-group method,and called for more rigorous,continuous learning curve modelling techniques[15].
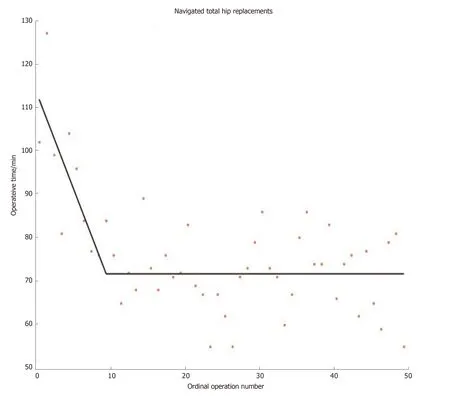
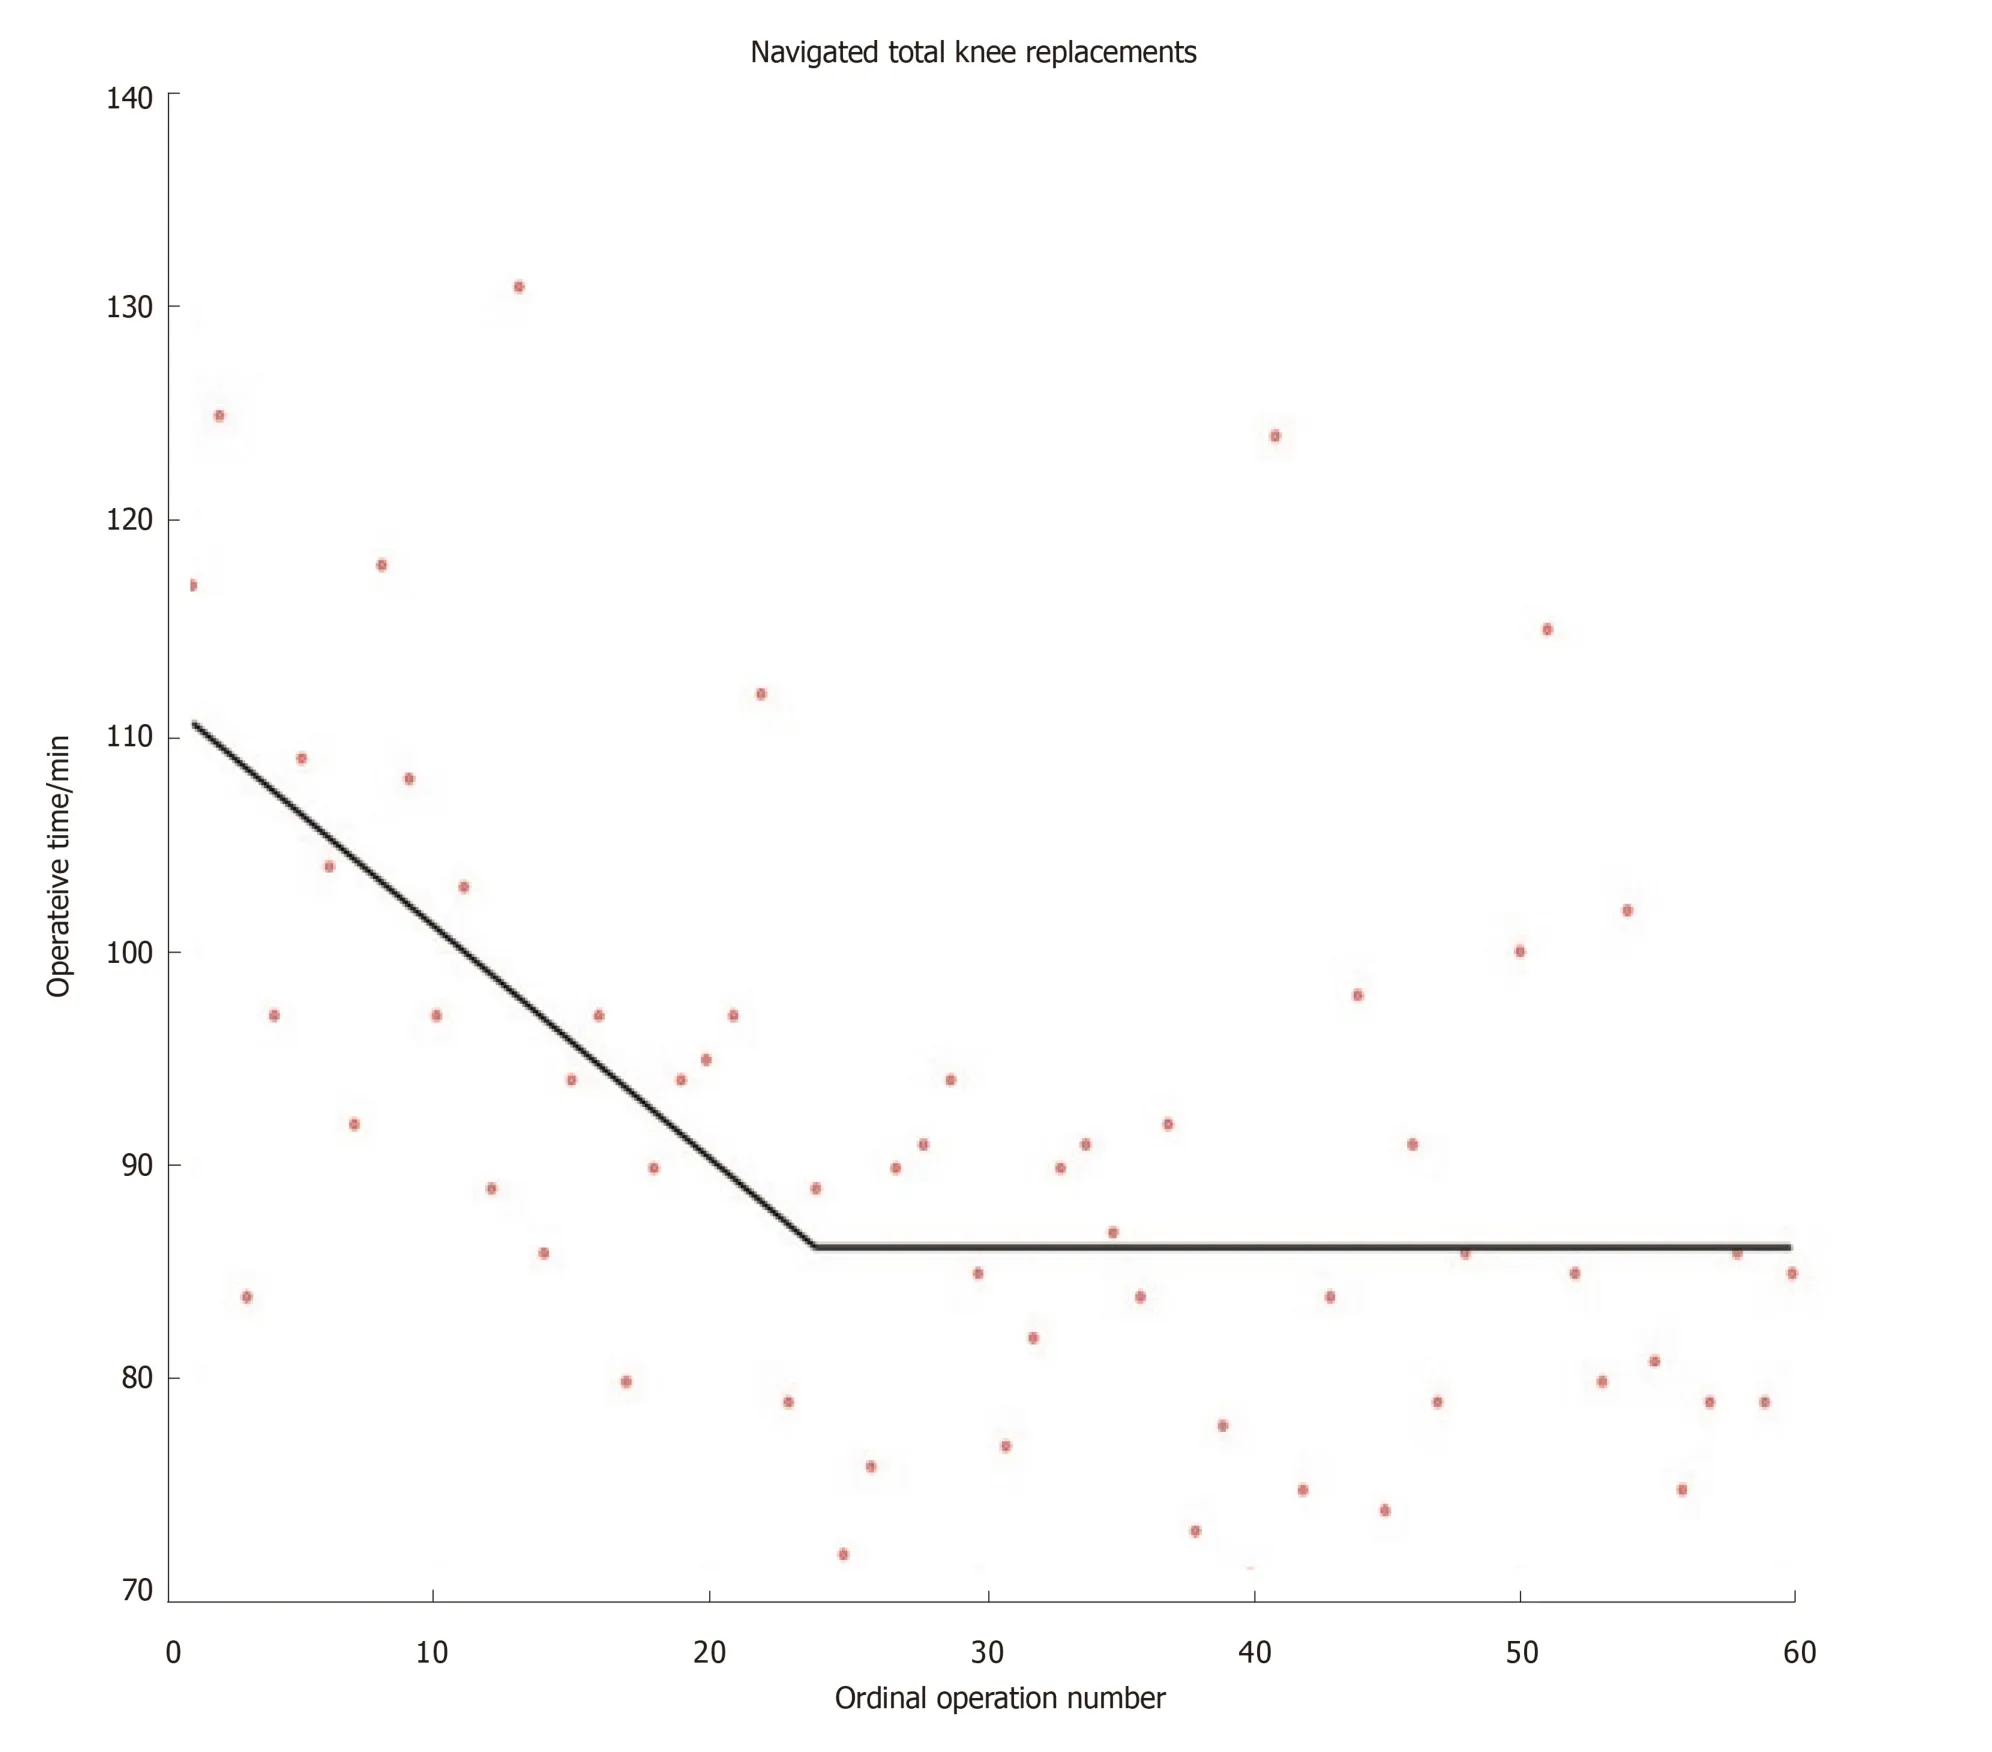
Although other methods for modelling learning curves do exist (e.g.,cumulative sum methods),the widespread use of mathematically valid regression techniques in orthopaedics remains sparse[16].Researchers have recently developed mathematically rigorous segmented linear regression techniques that test multiple learning models and applied these to investigate the learning curves austerity across healthcare systems of total knee and total hip replacements when using imageless navigation[17,18](Figures 1 and 2).Further studies are required to ensure that mathematically rigorous learning curve techniques become commonplace when evaluating the learning curves of new orthopaedic procedures.Indeed,accurate and informative learning curve analysis is even more important in an era of centralisation of care,where difficult procedures are increasingly reserved for supra-specialist,high-volume surgeons[19].
Simulation
The ongoing emphasis on patient safety in conjunction with reduced working hours and financial austerity across healthcare systems has led to improved methods to train surgeons outside the operating room[20].Simulation-based training has been successfully incorporated into the general surgery training curriculum in the United States[21],and randomised controlled trials (RCT) have proved its benefits[22].The use of simulation in arthroscopy[23]and trauma[24]is increasing,though the level of evidence for simulation studies in orthopaedics remains low with a lack of focus on nontechnical skills and cost analyses[25].There are ongoing consultations to map simulation to the trauma and orthopaedics postgraduate curriculum in the United Kingdom[26].A stronger drive is required to formally integrate simulation training within orthopaedic residency training at an international level.
CHANGE
Change in outcomes in orthopaedics can be considered following operative intervention,and by examining time-series following system interventions.The measures of performance in both settings are similar and reflect the variables we consider to lie at the core of orthopaedic practice.Although there is a degree of overlap with variables used to measure learning,these are largely related to patient outcomes and health economics.
Outcome measures
Prior to implementing and evaluating change,researchers must identify appropriate measures to determine whether an intervention works[27].Ideally,these should be part of routinely collected data for quality improvement purposes.An example includes the National Hip Fracture Database in the United Kingdom that routinely collects standardised outcome data[28].It is based on this that the World Hip Trauma Evaluation (WHiTE) study has founded a reliable and organised framework for comprehensive cohort studies on fragility hip fractures[29].
Patient outcomes in orthopaedics mainly include mortality,postoperative complications,infection,performance testing,and PROMs[30].Of these there has been a recent surge in PROMs research[31].This is because PROMs lie at the heart of patientcentred care.There is no surprise that health-related quality of life measures such as the EuroQol are increasingly being employed to guide operative decision making in trauma[29,32].Simultaneously,there is a trend towards including patients in setting research questions through priority setting partnerships[33],and patient and public involvement is now indispensable to healthcare research[34].Cost-utility,the financial cost for health gain,is the variable that the National Institute for Health and Care Excellence (NICE) uses when forming guidelines for healthcare provision.It is thus very important that orthopaedic surgeons understand and incorporate cost-utility analysis in their research[35].

Figure1 Learning curve for navigated total hip replacements.Segmented linear regression technique was employed to model learning[17].Line-plateau model fits the data best,with a plateau being attained at 12 operations.
Variables used to evaluate an intervention are usually divided into outcome measures,process measures,and balancing measures[5,36].Outcome measures monitor how a system is performing,process measures assess the implementation of an intervention,and balancing measures assess unintended consequences of the intervention.
Once outcome measures are identified and data is collected,analysis of the data is required to evaluate change.
Evaluating change
Operative intervention: Analysing change following operative intervention forms the basis of retrospective and prospective research studies.The level of evidence for a given study depends on a multitude of factors,most importantly study design[37].There are three types of outcome variables: Continuous (e.g.,operative time),categorical (e.g.,presence or absence of a complication),and time-to-event (e.g.,time to revision of a joint replacement).Statistical tests comparing outcomes consider the type of variable and can include parametric (t-test) and non-parametric (Mann-Whitney) tests,crosstabs (e.g.,Chi-squared test and Fischer’s test),and survival analysis.These tests usually output a significance value (P-value) which is a measure of the likelihood that the result was due to chance.
Increased focus is being placed on the minimal clinically important difference - the smallest change in an outcome that a patient would identify as important,and which would usually indicate a change in patient management.Even a very small change can be shown to be statistically significant with a large enough sample size,but this may not be important.There is significant variation in the reporting of sample size calculations in orthopaedic literature[38]and until recently,reporting guidelines were lacking.Adoption of the DELTA2guidance on choosing a target difference and reporting sample size in RCTs should improve this[39].

Figure2 Learning curve for navigated total knee replacements.Segmented linear regression technique was employed to model learning[17].Line-plateau model fits the data best,with plateau being attained at 26 operations.
RCTs are considered the gold-standard hypothesis-testing study design.This is mainly because they allow for controlling of confounding variables that complicate observational studies.Over the last decade there has been a surge in trauma trials on an international scale,starting with the CRASH-2 trial on the effectiveness of tranexamic acid in trauma[40].Other large-scale randomised trials have followed suit,investigating fixation of intracapsular neck of femur fractures[41],fixation of distal radius fractures[42]and ongoing research on the optimal timing of hip fracture surgery[43]to mention a few.
Although RCTs are excellent for answering certain research questions,retrospective studies remain indispensable.In the era of information technology,‘Big Data’ is becoming ubiquitous[44].Using Big Data to identify research questions,guide efficient targeting of resources and subsequently address these questions with randomised trials may not be the exception in a few years.It is definitely appearing promising so far[29].One major limitation that will need to be addressed in future if RCTs are to output the highest quality data is surgeon equipoise.Surgeons are rarely in true equipoise and they usually have a clear idea of what management option is the best for a given patient.Although few would question the importance of decision making in surgery,it can present an obstacle when patient randomisation is required[45].This must be addressed through improved surgeon education and standardised randomisation processes.
Time-series analysis: A toolbox for detecting change:Many quality improvement projects evaluate the effectiveness of an intervention by collecting data over time.Data can be graphically displayed as control charts,also known as Shewart charts.They are a statistical process control tool used to determine whether a system is in control and provide immediate feedback about performance[46].
Orthopaedic surgeons may be more familiar with audit cycles.Audit is a framework of quality improvement where performance is compared to a published standard[47].Part of this process includes introducing an intervention and assessing its effectiveness by comparing performance before and after the intervention by simple statistical group tests.Although ubiquitous in clinical orthopaedics and indeed in all medical specialties,such approaches are sensitive to secular (background) trends.Interrupted time-series (ITS) analysis is a useful tool for evaluating the effectiveness of interventions where data is collected at several time-points before and after the intervention to determine whether any change could be explained by secular trends[48].Cochrane recommends this tool to evaluate interventions[49]and several recent orthopaedic studies have employed this technique[50,51].
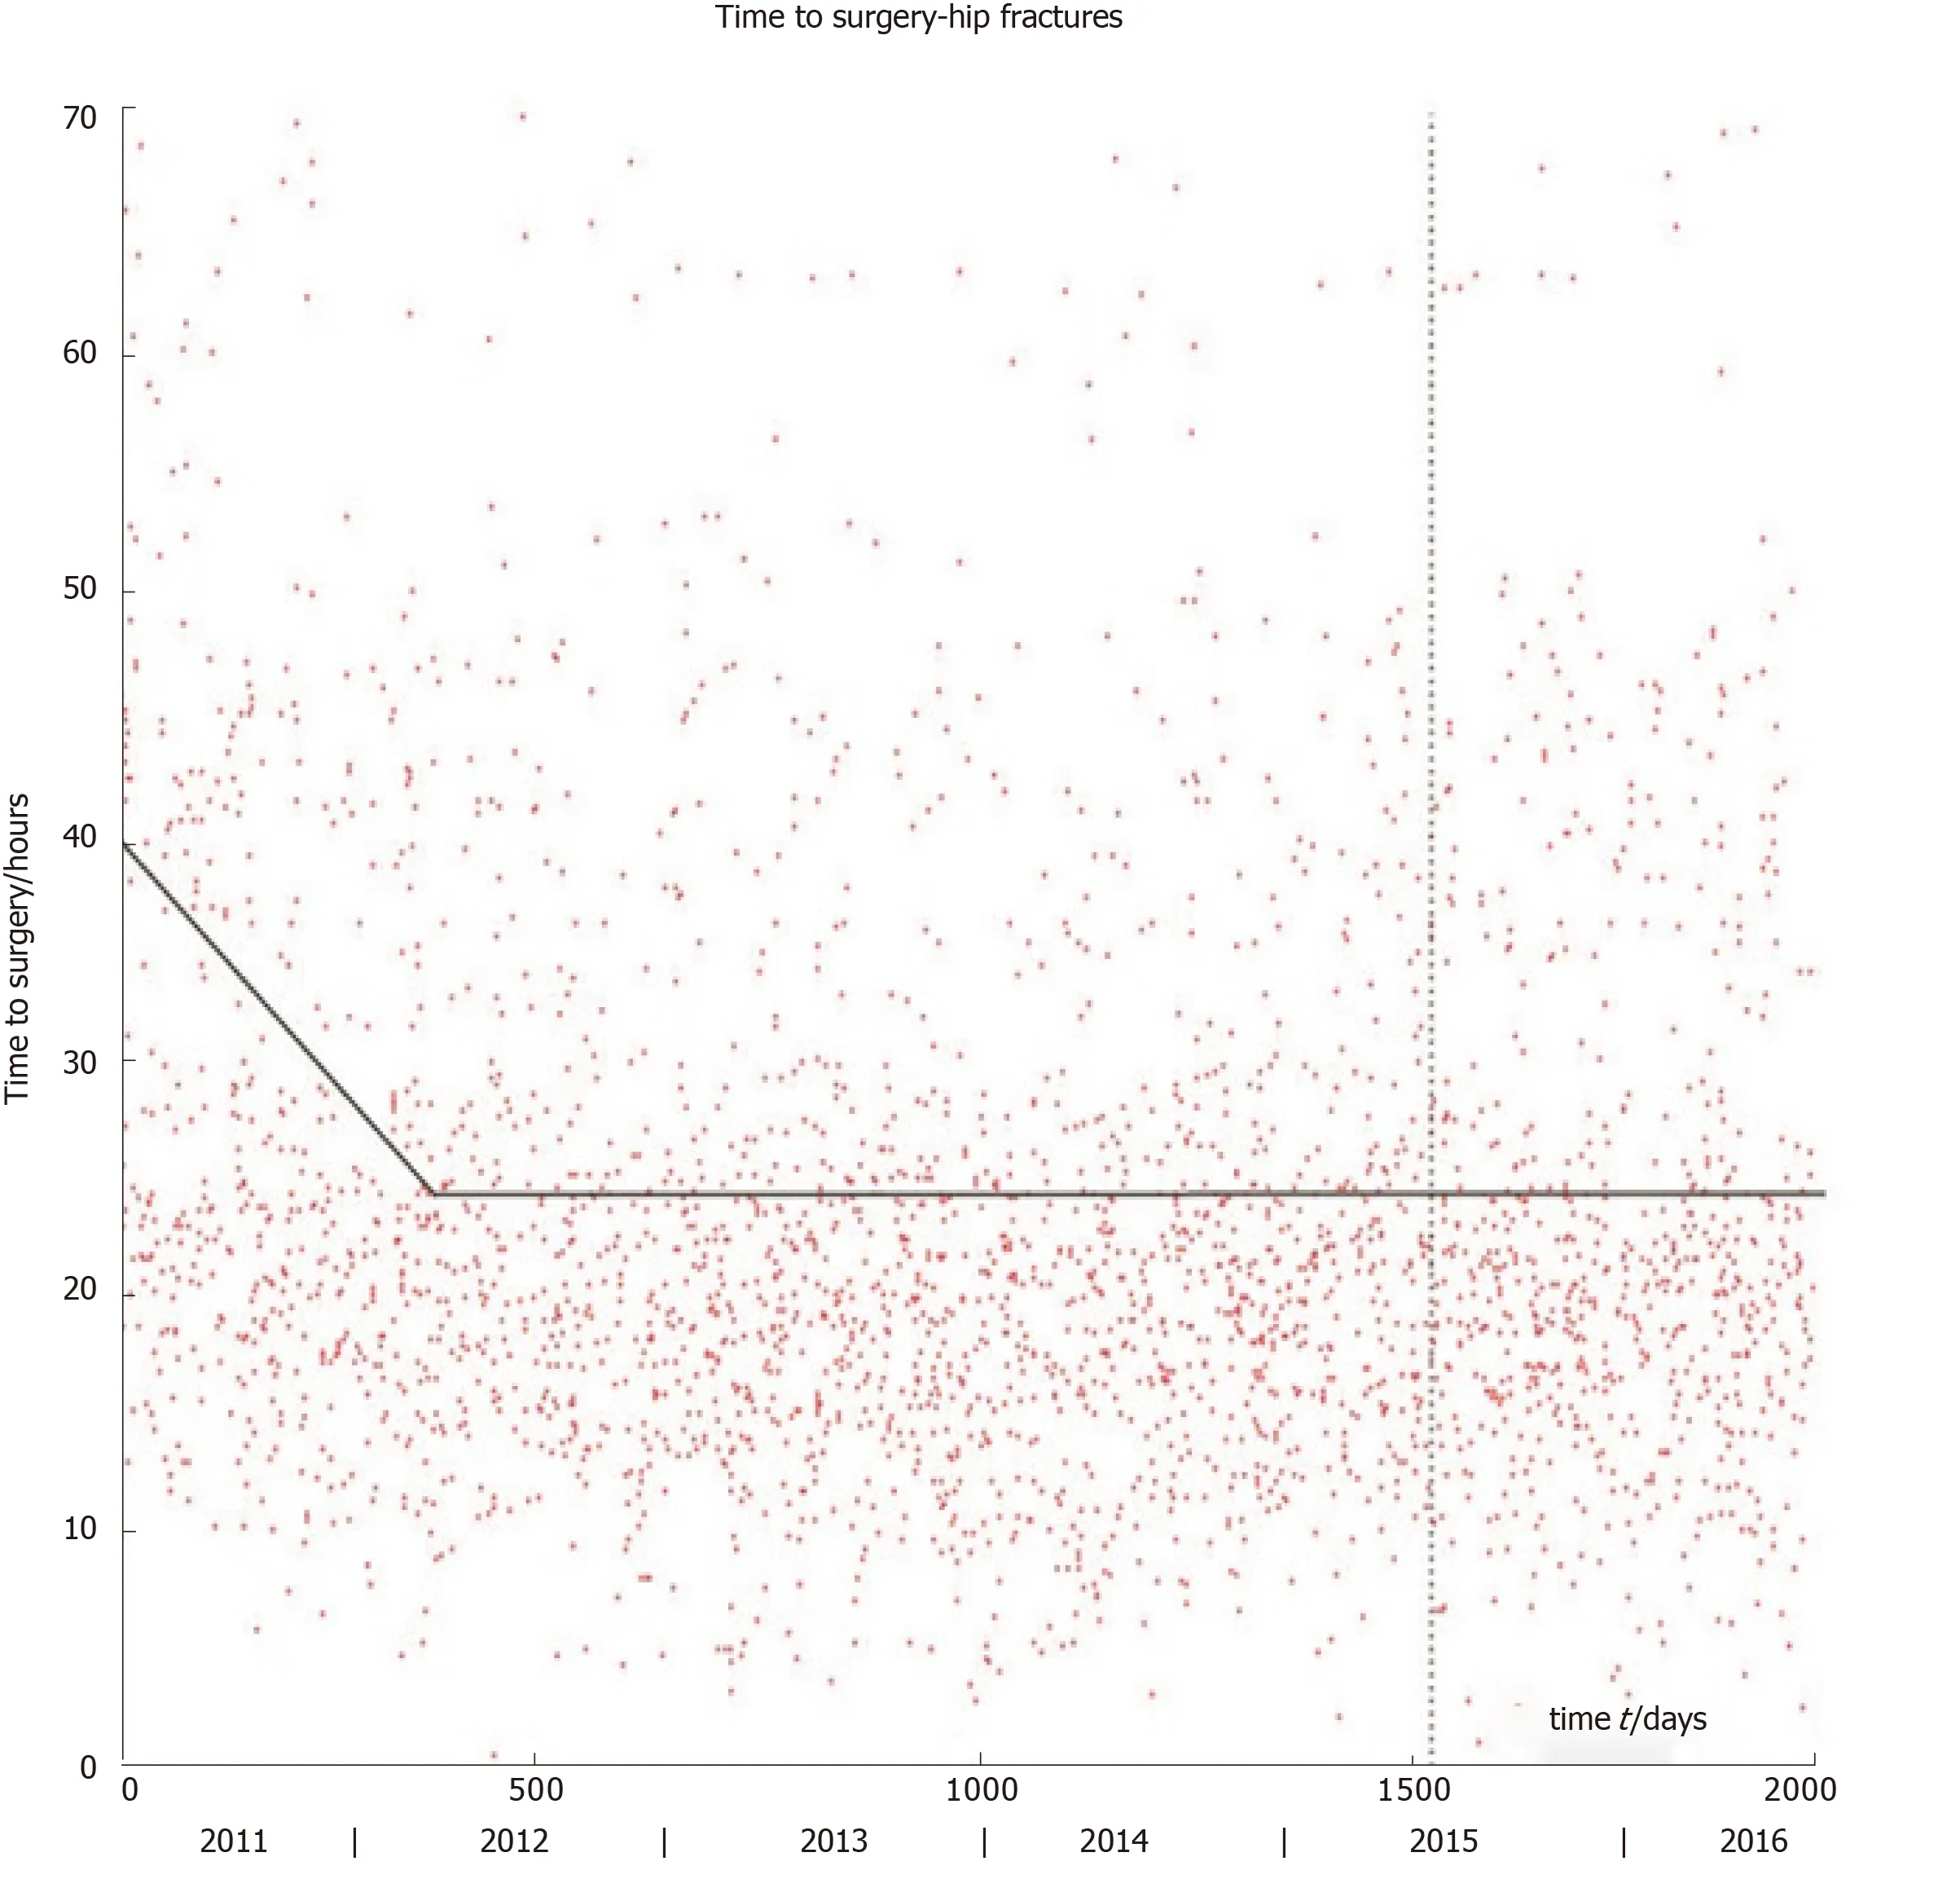
ITS does not come without limitations,and is known to display bias for detecting change at the time of the studied intervention where other changes at different timepoints may be equally,if not more important[52,53].Segmented linear regression models have been developed for evaluating change in retrospective studies by enabling more than one linear segment to describe the periods before and after an intervention.A recent study employing this technique revealed that improvements in time to surgery and 30-d mortality following hip fracture over a 6-year period were likely the result of a combination of surgical,anaesthetic,and procedural improvements over time,rather than due to the introduction of a dedicated hip fracture unit[53](Figure3).Future work is required to determine the optimal way to describe retrospective timeseries: How many linear segments should be used,and how to best model binary outcomes.

Figure3 Time to surgery for neck of femur fractures.The vertical dashed line marks the onset of a dedicated hip fracture unit.The line-plateau is the best-fitting linear model for the entire period: the line has equation y = -0.0414t + 40.1868;plateau at y = 24.7033 reached after 375 d.The initial drop may be related to the introduction of the Best Practice Tariff.The hip fracture unit did not significantly affect time to surgery[53].
CONCLUSION
Learning and change are integral to quality improvement and surgical education,and strongly influence the development of our specialty.The orthopaedic community has seen several improvements in PROMs research,learning curve analysis,randomised trial design,and time-series analysis.
Future work is required to improve and standardise learning variables and formally implement simulation in orthopaedic residency education.Global collaborative research networks are developing but integrating randomised trials with Big Data on an international scale to improve orthopaedics will require a concerted effort.
