Imputing missing values using cumulative linear regression
2019-10-18
Faculty of Science,Mathematics Department,Computer Science,South Valley University,Qena 83523,Egypt
✉E-mail:samih_said@sci.svu.edu.eg
Abstract:The concept of missing data is important to apply statistical methods on the dataset.Statisticians and researchers may end up to an inaccurate illation about the data if the missing data are not handled properly.Of late,Python and R provide diverse packages for handling missing data.In this study,an imputation algorithm,cumulative linear regression,is proposed.The proposed algorithm depends on the linear regression technique.It differs from the existing methods,in that it cumulates the imputed variables;those variables will be incorporated in the linear regression equation to filling in the missing values in the next incomplete variable.The author performed a comparative study of the proposed method and those packages.The performance was measured in terms of imputation time,root-mean-square error,mean absolute error,and coefficient of determination (R2).On analysing on five datasets with different missing values generated from different mechanisms,it was observed that the performances vary depending on the size,missing percentage,and the missingness mechanism.The results showed that the performance of the proposed method is slightly better.
1 Introduction
Scientific studies of statistical learning use data-dependent tool(e.g.machine learning and the like) to find a predictive model based on the data.Undoubtedly,better data quality leads to a better model;therefore,better analysis and prediction.In real-world data,the dataset is likely to contain missing values,which occur when one or more variables contain no values in one or more observations.Missing data reduces the statistical performance and produces biased estimates of a study,leading to invalid results [1].
1.1 Motivation and novelty
Some existing imputation algorithms fail in imputation of the missing data;others take a long time for imputation or give poor performance.This paper treats these defects by proposing a novel imputation method that exploits the most influential variables.The priority of variables to be selected in the imputation depends on some criteria,which will be discussed in Section 3.
1.2 Contributions of this paper
The main contributions of this work are:it gives an outline of the studies related to dealing with missing data,shows the advantages and disadvantages of these studies,shows how the performance metrics affected by the size of the dataset,proposes an imputation approach which benefits from all the variables to improve the quality of data,and compares between the proposed method and most popular R and Python imputation methods in all missingness mechanisms for different datasets with different sizes.
1.3 Missingness mechanisms
Missing values are a common occurrence,and the conclusions drawn from the data are significantly affected by the missing data.Various reasons of the missingness,for example,not limited,are:individuals do not know the answer or refuse to answer,sensor failure,error in data transfer,errors when collecting the data,data entry error,and so on.The relationship between known variables and the probability of the missingness is defined as the missingness mechanism (i.e.why the data are missing) [2–11].Missing values are categorised into three types:
† Missing completely at random (MCAR):If the probability of missingness is the same for all observations.The reason for the missingness in a variable X does not depend on any variables as well as X itself on the dataset.
† Missing at random(MAR):If the probability of missingness is the same only within the observed data.The reason for the missingness in a variable X depends on other variables on the data but does not depend on the variable X itself.
† Missing not at random (MNAR):If the probability of the missingness for a variable X depends on X itself or other variables not completely known.
1.4 Handling missing data
Data-dependent tools deal only with complete datasets (i.e.with no missing values).Therefore,it is vitally important to handle missing values.The two approaches for dealing with missing values are deletion and imputation [12].
1.4.1 Deletion approach:Many missing data methods ease the problem with the disposal of the data.Complete case analysis,aka listwise,is a direct approach for handling missing values by excluding them from the dataset.Although it is easy to implement,most of the data would be discarded if many variables contain unknown values,this leads to reducing the sample size and may be very few complete cases exist;this may lead to an unpredictable bias and estimates with larger standard errors.To remedy the loss of the data,available case analysis,aka pairwise,is another approach that uses observations that contain missing values.However,statistical procedure cannot use the feature if it contains missing values;the case with missing values can still be used when analysing other features with recorded values.Pairwise outperforms listwise,where it uses more data.However,each statistical analysis may be based on a different subset of the observations;this can be suspicious [13].
1.4.2 Imputation approach:Instead of discarding incomplete data,replacing missing values by appropriate values using the information available to conjecture the value of missing value,called imputation,is an alternative approach for handling missing values.Using imputation,most,if not all,data will be used for statistical methods.Imputation technique should be selected carefully,where the performance of the imputation technique is affected by the richness of missingness and the missingness mechanism,thence,the selection of imputation technique affects the quality of the data.Depending on the imputation mechanism,imputation techniques can be classified into two groups:intransitive,in which the imputation of a variable of interest,which contains missing values,depends on itself,not other variables,and transitive,in which the imputation of a variable of interest depends on other variables.The arithmetic mean,aka unconditional means,mode,median,and most frequently are examples of intransitive imputation.Interpolation and regression are examples of transitive imputation.Imputation can be done in two ways:single imputation and multiple imputation.In the former,each missing value is imputed by one plausible value [14].In the latter,proposed by Rubin [15],each missing value is imputed n times,n>1,which generates n versions of the complete datasets [16].Imputation can also be estimated using regression methods [17],K-nearest neighbours (KNNs),hot-deck imputation[18]etc.As the proposed algorithm depends on the linear regression,the following are the most common regressions used:
† Simple linear regression:If there is a linear relationship between the dependent variable y and the independent variable X,the mathematical notation can be written as below:
Equation(1)says:Regressing the dependent y on the independent X.Value of unknown y based on X |∀X=x can be predicted by
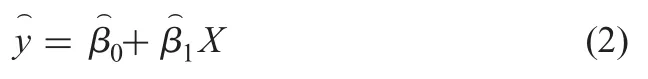
The hat symbol indicates the estimated value of the unknown coefficient/parameter:
† Multiple linear regression:More independent variables work together to achieve better prediction.The linear relationship between the dependent and independent variables can be written as below:

1.5 Organisation
The rest of this paper is organised as follows:Section 2 presents the literature review;the proposed method is discussed in Section 3;Section 4 discusses the experimental implementation;and conclusion,findings,and future work are briefly explained in Section 5.
2 Literature review
This section presents an overview of the studies related to dealing with missing values.
Cismondi et al.[2]presented a method for handling missing data in intensive care units databases to improve the modelling performance.The authors determined which missing data should be imputed by using statistical classifier followed by fuzzy modelling.The authors developed a simulation test bed to estimate the performance.Although the authors’ approach improved the accuracy of classifications,sensitivity,and specificity,the approach may fail in filling all missing values.
Hapfelmeier et al.[3]formulated the imputation problem as an optimisation problem.Within their proposed framework,the authors used a support vector machine (SVM),KNNs,and decision tree.The framework incorporates two composite methods:opt.cv and benchmark.cv.The former selects the best approach from opt.svm,opt.knn,and opt.tree.The latter selects the best method from mean,predictive-mean matching,Bayesian principal component analysis,KNNs,and iterative KNNs.Although their proposed method outperforms other methods,the time used for selecting the best method,which gives the lowest mean absolute error (MAE) is long.Also,the sizes of datasets used in the experiments are small.
Batista and Monard[4]compared between KNN,C4.5,and CN2.The experiments were implemented at a different rate of missing values.Although the analysis indicates that the KNN method outperforms C4.5 and CN2 even when the dataset contains a high percentage of missingness,in some cases,C4.5 is competitive to ten-nearest neighbour.To confirm the analysis significance,the value of k should be increased.
Aydilek and Arslan [5]combined support vector regression and genetic algorithm (GA) with fuzzy clustering to impute missing data.Their proposed method was compared with FcmGa,Zeroimpute,and SvrGa methods.Although the imputation accuracy was better,the efficiency of the training stage by the support vector regression depends on the size of the complete dataset [i.e.in which no variables have missing value(s)];this means that if many attributes contain many missing values,many cases will be discarded.
Qin et al.[19]proposed an imputation method called stochastic semi-parametric regression for semi-parametric data and compared with deterministic semi-parametric regression imputation.The authors aimed at making an optimal evaluation about root-mean-square error (RMSE),and evaluated their proposed method using real data and simulated data experimentally.Although their proposed approach is better than deterministic semi-parametric imputation in effectiveness and efficiency,the authors used two accuracy measures:mean squared error (MSE)and RMSE,both of them are susceptible to outliers since they give extra weight to large error [20].
Acuña and Rodriguez [21]compared four popular approaches:complete case analysis,mean imputation,median imputation,and KNN imputation (KNNI) to handle missing data in supervised classification problems using 12 datasets in their experiments.
Muñoz and Rueda [22]proposed two imputation methods based on quantiles.The first algorithm is implemented without the aid of auxiliary information and the other is implemented with the aid of auxiliary information.Determining the relationship between the auxiliary variable and the variable of interest is an issue.
Li et al.[23]exploited the idea from fuzzy K-means to applying in missing data imputation.The main objective of clustering is dividing the dataset into classes based on objects similarity.The belonging degree of an object to a cluster is determined by the fuzzy membership function.The authors used RMSE error analysis to evaluate the algorithm performance.Depending on the value of the fuzzifier,K-means may outperform fuzzy K-means and vice versa.This indicates that determining the proper value of the fuzzifier parameter is an issue because it is important for the performance of the system.
Batista and Monard [24]use Euclidean distance measure to find the k cases,which have the most similarities.Then,it imputes the missing categorical values in a variable using the most frequent value within the KNN cases.It utilises the unconditional mean for the KNN cases for imputing numerical values.Although KNNI is a simple technique,and its performance is higher than the performance of mean/mode,it is expensive in large dataset because it needs to inspect all cases as many times as the number of cases which contains missingness to find the nearest neighbours of each case with missing value(s).
Honghai et al.[25]used SVM to impute missing values.The authors did not compare with any other imputation algorithms.Furthermore,the size of the examples with no missing values,which will be used in training should be enough;otherwise,the accuracy of regression will be influenced.
Pelckmans et al.[26]used a maximum-likelihood technique to get the estimates for the models assumed from their approach for the covariates of missing data.Although the advantage of this approach is that the rules of the classification can be learnt from the data even when the input variables contain missing values,the disadvantage is that the aim of their proposed approach is for high accuracy of classification rather than high accuracy of imputation.
3 Cumulative linear regression
To provide a more in-depth description of the proposed method,this section elaborates the proposed algorithm.List of the terminology used in this work is defined in Table 1.
For any dataset,two cases may occur;the first case when all variables have missing values including the dependent variable and the second case when there is at least one complete variable.Assume that the dependent variable y has no missing values,X={Xi:i=1,...,n} is set of all predictors,X(Miss)is a set of variables that have missing values,{X(Miss):X(Miss)X},X(Comp)is a set of variables that have no missing values,and{X(Comp):X(Comp)X}.The candidate variable from X(Miss)which will be chosen to be the dependent in the first regression iteration will be selected under specific conditions:the candidate variable is highly correlated with the variable y,and the number of all observations,which contain missing values to exist in both the candidate variable and y,is predetermined.This candidate variable will be the dependent variable and y and X(Comp)will be independent in the regression equation.The model is fitted to impute missing values in that variable,then the imputed variable XImpwill be inserted as an independent variable,the independent variables became:y,X(Comp),and.Another variable from X(Miss)will be chosen to be dependent variable,and the model will be fitted again to impute missing values in the variable of interest.This procedure will be repeated until all missing values are imputed.Following is the algorithm,Fig.1 shows the flowchart of the proposed method (see Fig.2).
4 Experimental implementation
4.1 Datasets
Five datasets that are commonly used in the literature and different databases repository are used in the comparative study (Table 2).The datasets on hand vary on types and numbers of missing values.This variation is needed for assessing performance and generalisation of the methods.Each dataset is regenerated under the three types of mechanisms,MAR,MCAR,and MNAR,each type with 10,20,30,40,and 50% missingness ratios(MRs).
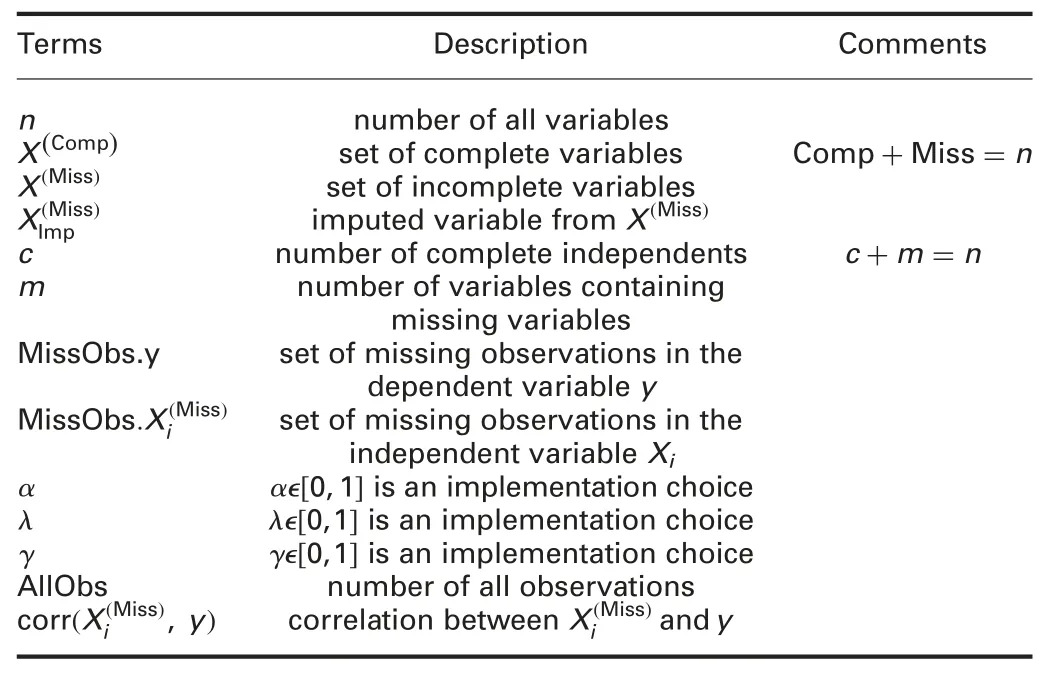
Table 1 List of terminologies

Fig.1 Algorithm flowchart
4.2 R and Python packages
Both R and Python provide some packages to handle missing data.These packages can be structured into missing data exploration(e.g.evaluation with simulations),single imputation,and multiple imputations.The performances of these packages may vary for different datasets depending on the size of the dataset,the mechanism causing the missingness,and the missingness rate.Table 3 clarifies the packages and functions used in the experiments.
4.3 Performance evaluation
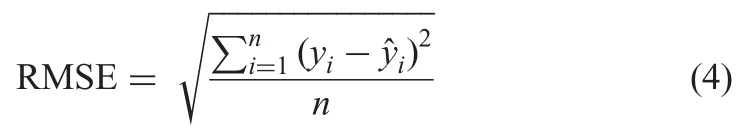
The imputation performance of the method is evaluated using RMSE,MAE,R2,and the time of imputation in seconds (t).
† RMSE:Given by (4),in which yiandare the real value and predicted value of the ith observation,respectively,and n is the number of samples [5]
† MAE:Given by the equation below:

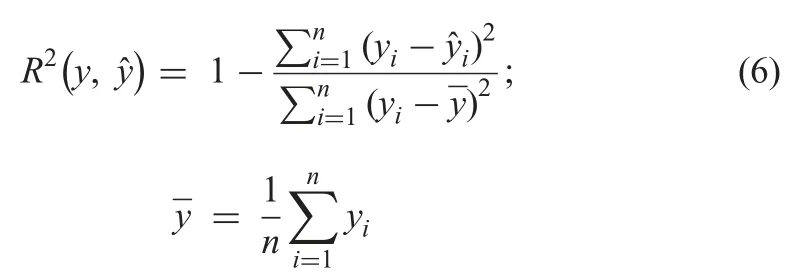
† R2:Given by the equation below:
† Time of imputation in seconds (t).
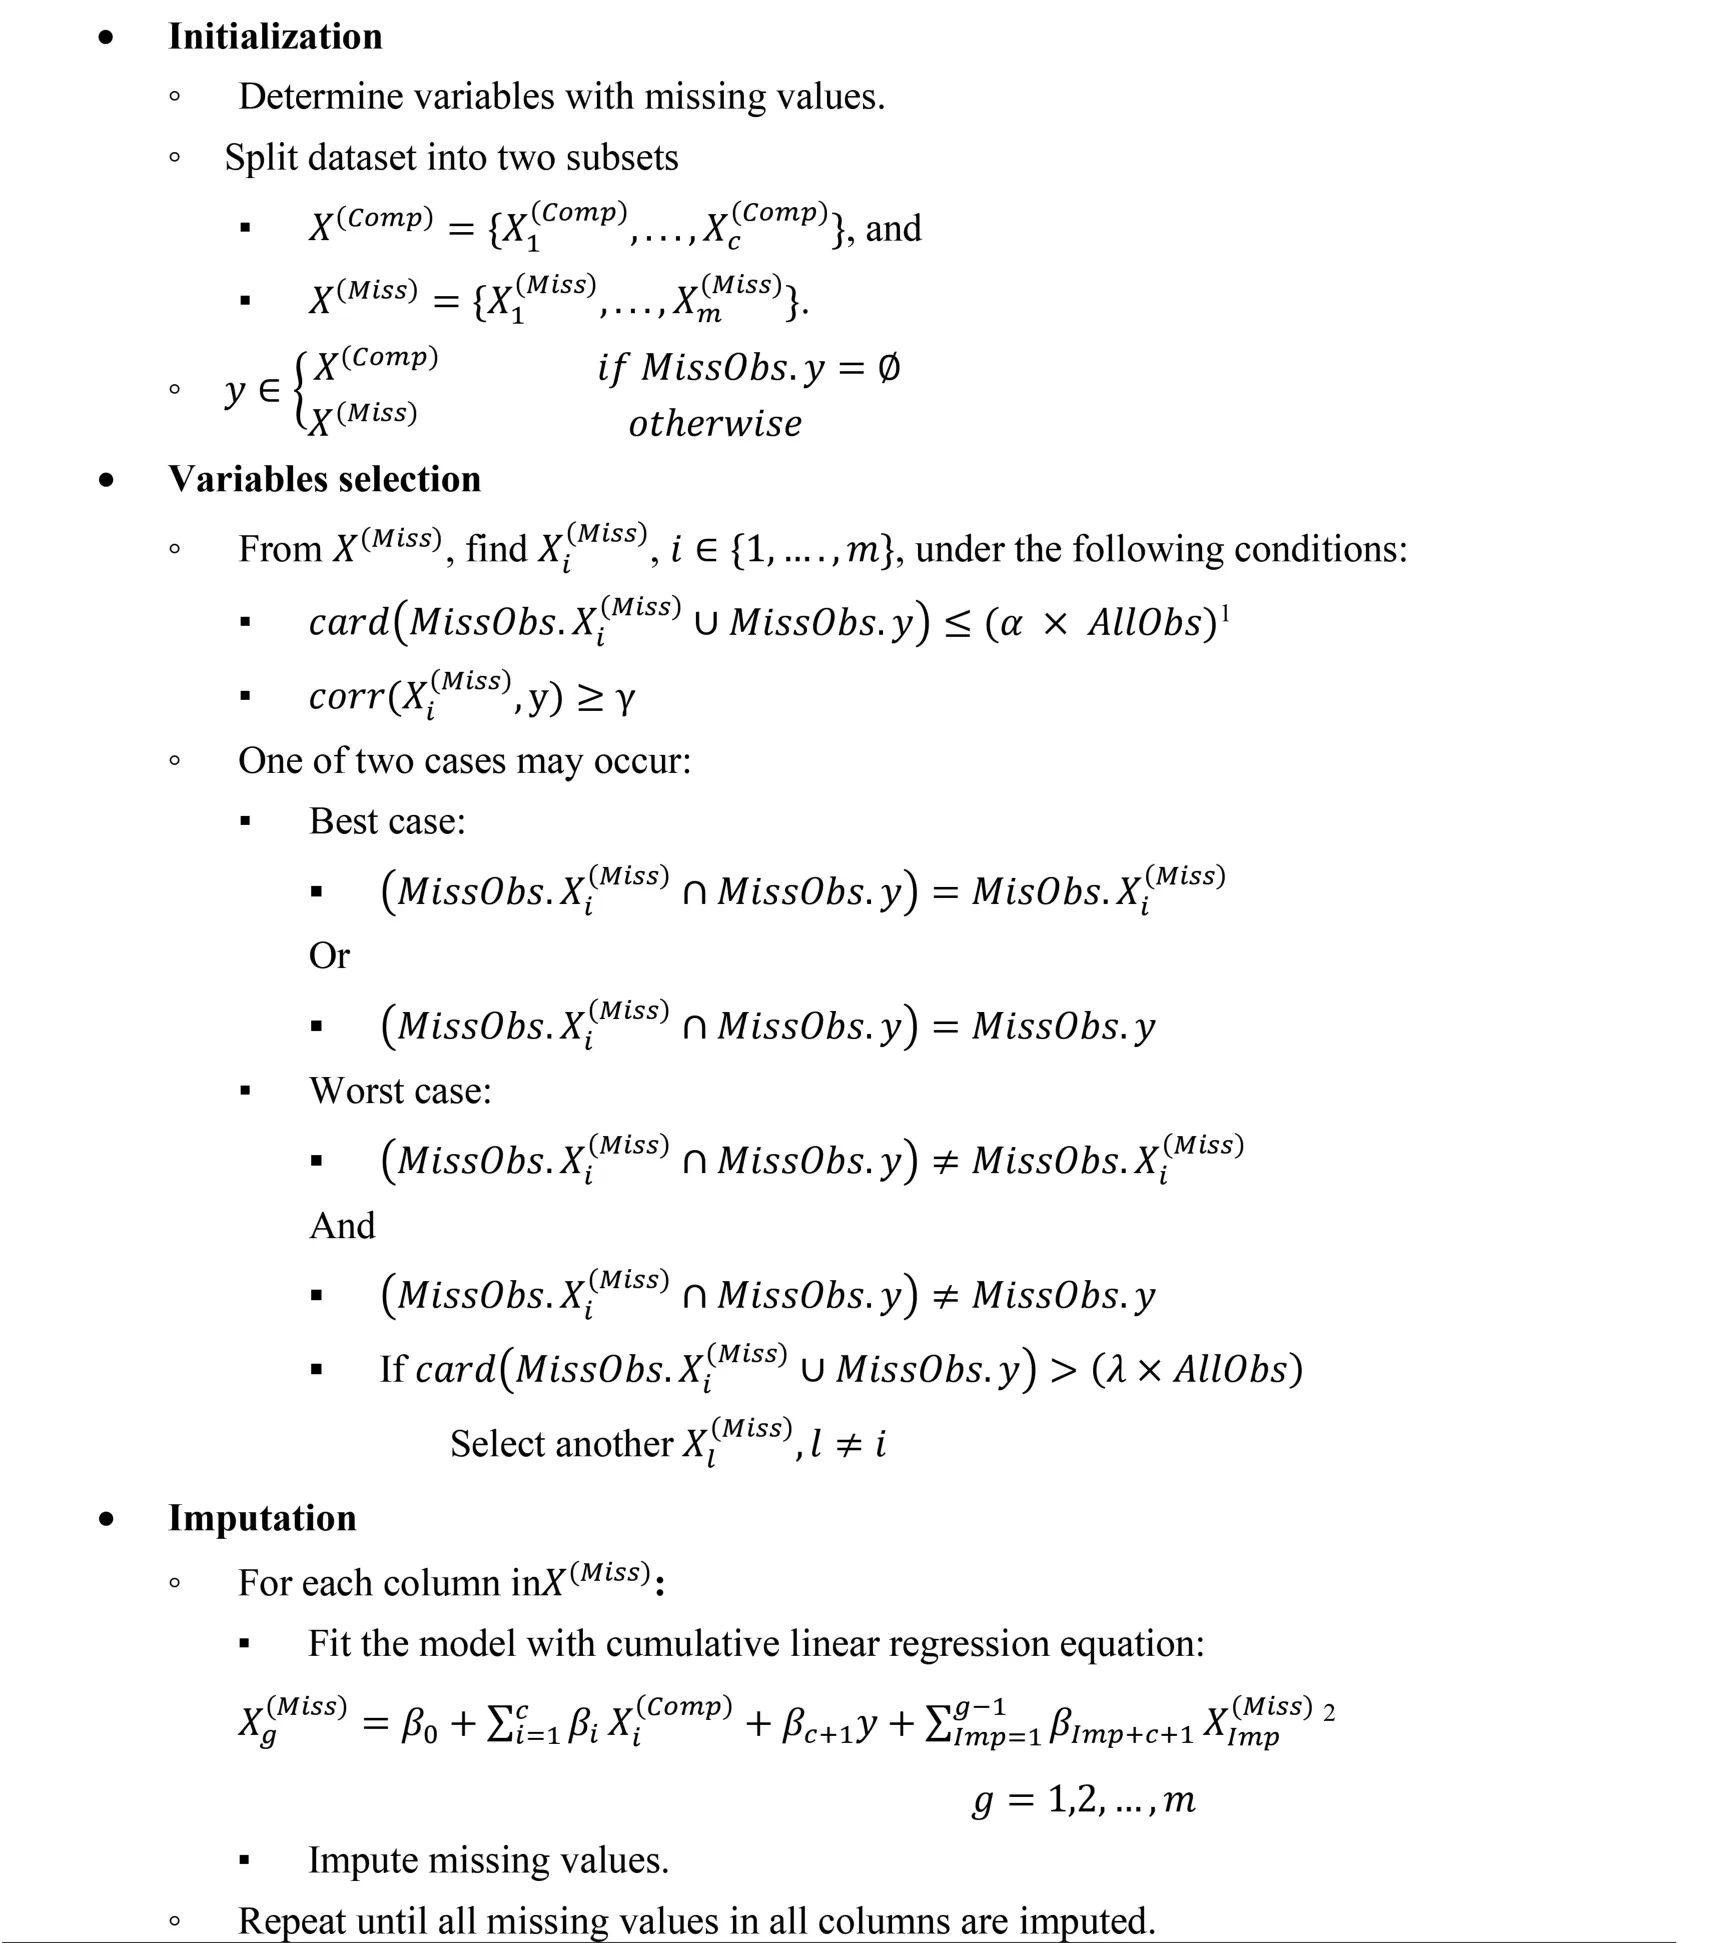
Fig.2 Algorithm:CLR
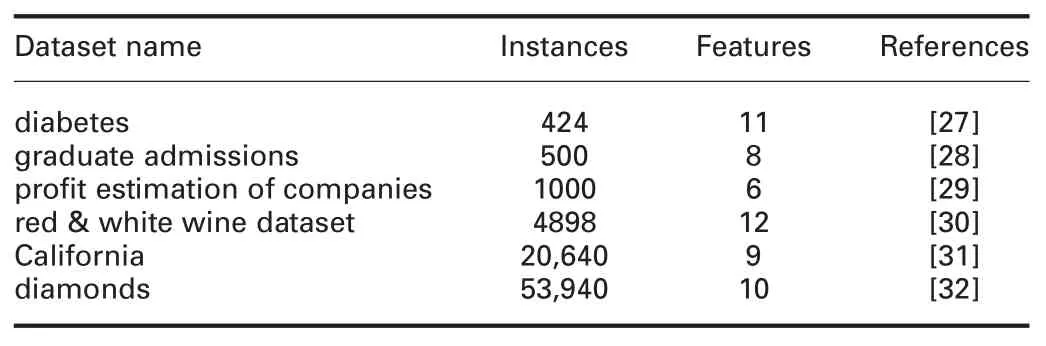
Table 2 Datasets specifications
The imputation method is considered to be efficient if it imputes in a little time with small error and high accuracy.The experiments were carried out using a computer with the following specification:16 GB memory,Intel Core i5-2400 (3.10 GHz) processor,1 TB HDD,Gnu/Linux Fedora 28 OS,and Python (version 3.7) and R(version 3.5.2) programming language.
4.4 Experimental results and discussion
4.4.1 Error analysis:Tables 4 and 5 show RMSE and MAE comparisons between cumulative linear regression (CLR) and R packages and CLR and Python packages,respectively.The prominent observations are:
† For admission dataset:In MAR,RMSE of the proposed algorithm,CLR,is significantly better than all R packages,KNN,and SoftImpute,and worst than IterativeImputer.MAE of CLR is better than all R packages,except with missForest,better than KNN and SoftImpute,and worst than IterativeImputer.
In MCAR,RMSE and MAE of CLR are significantly better than all R and Python packages,except with IterativeImputer.
In MNAR,RMSE of CLR is significantly better than all R and python packages,except with IterativeImputer.MAE of CLR is better than all R and python packages,except missForest,simputation,and IterativeImputer.
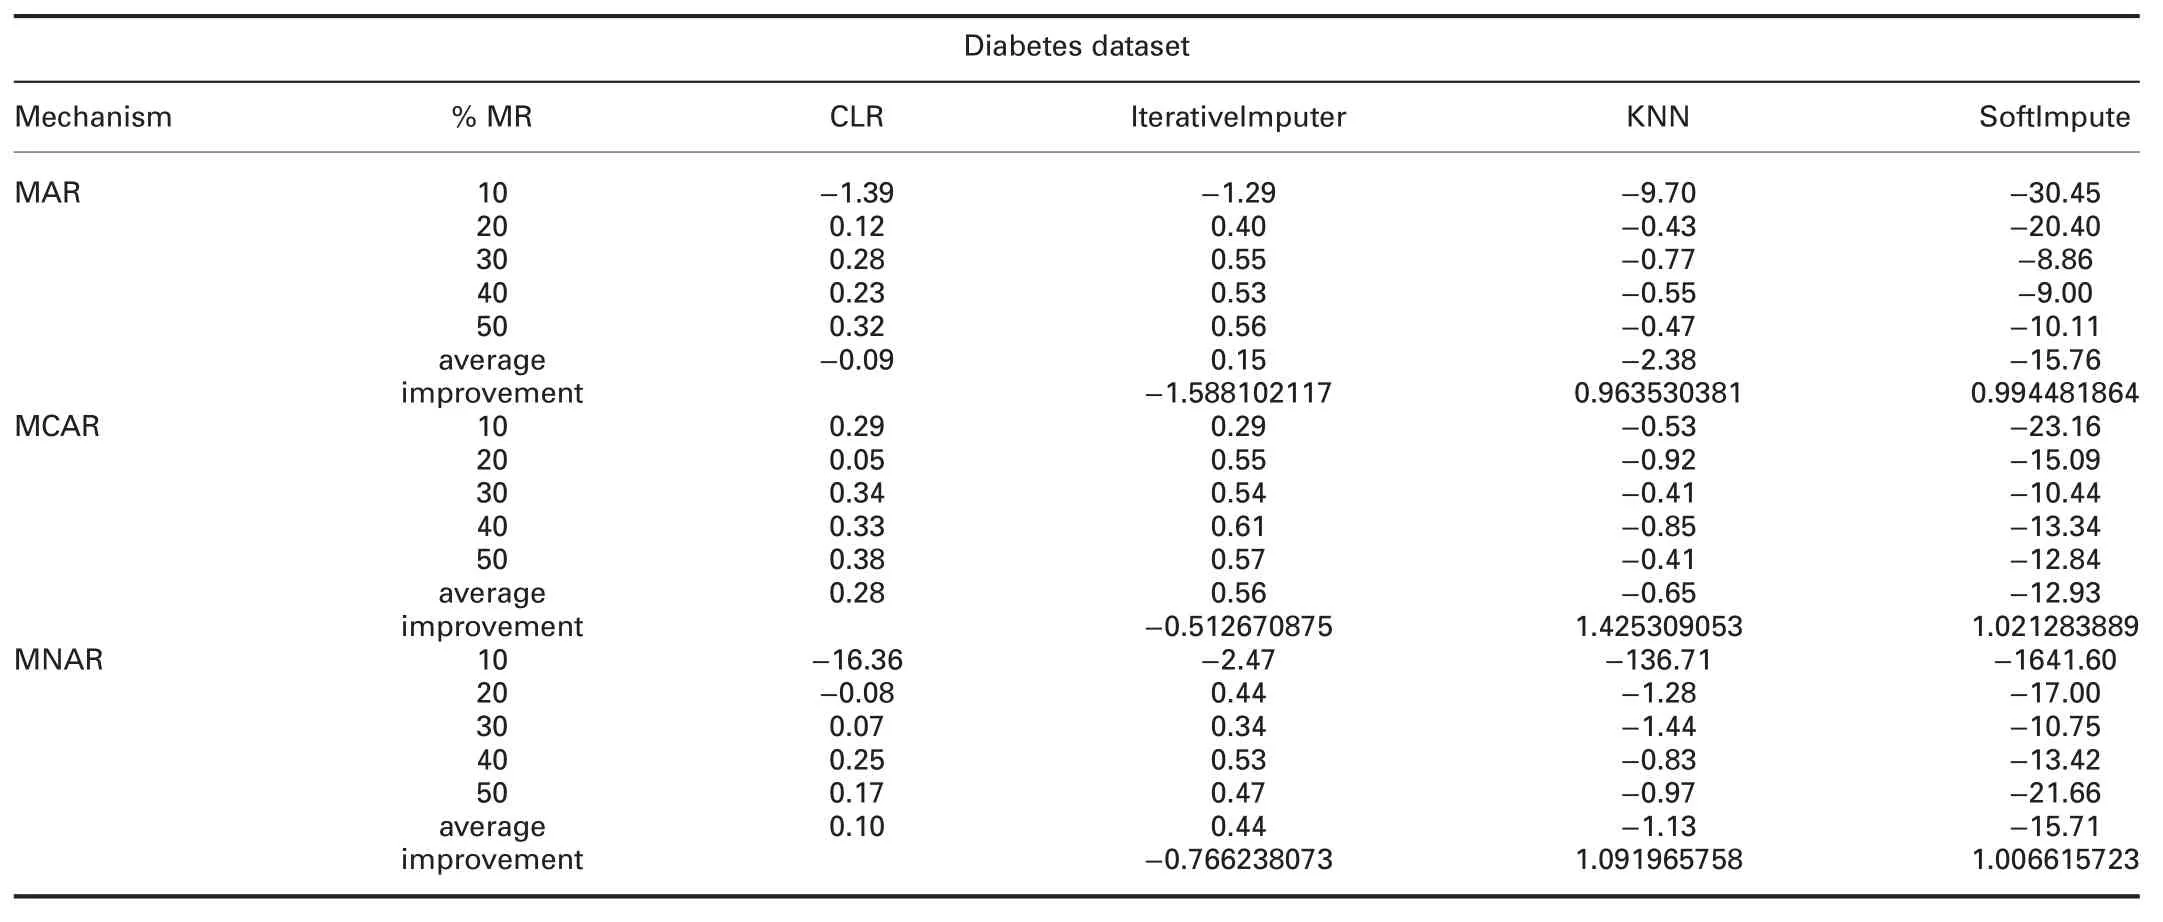
† For diabetes dataset:RMSE and MAE of CLR are significantly worst than all R packages in all missingness mechanisms,better than KNN and SoftImpute,and worst than IterativeImputer.
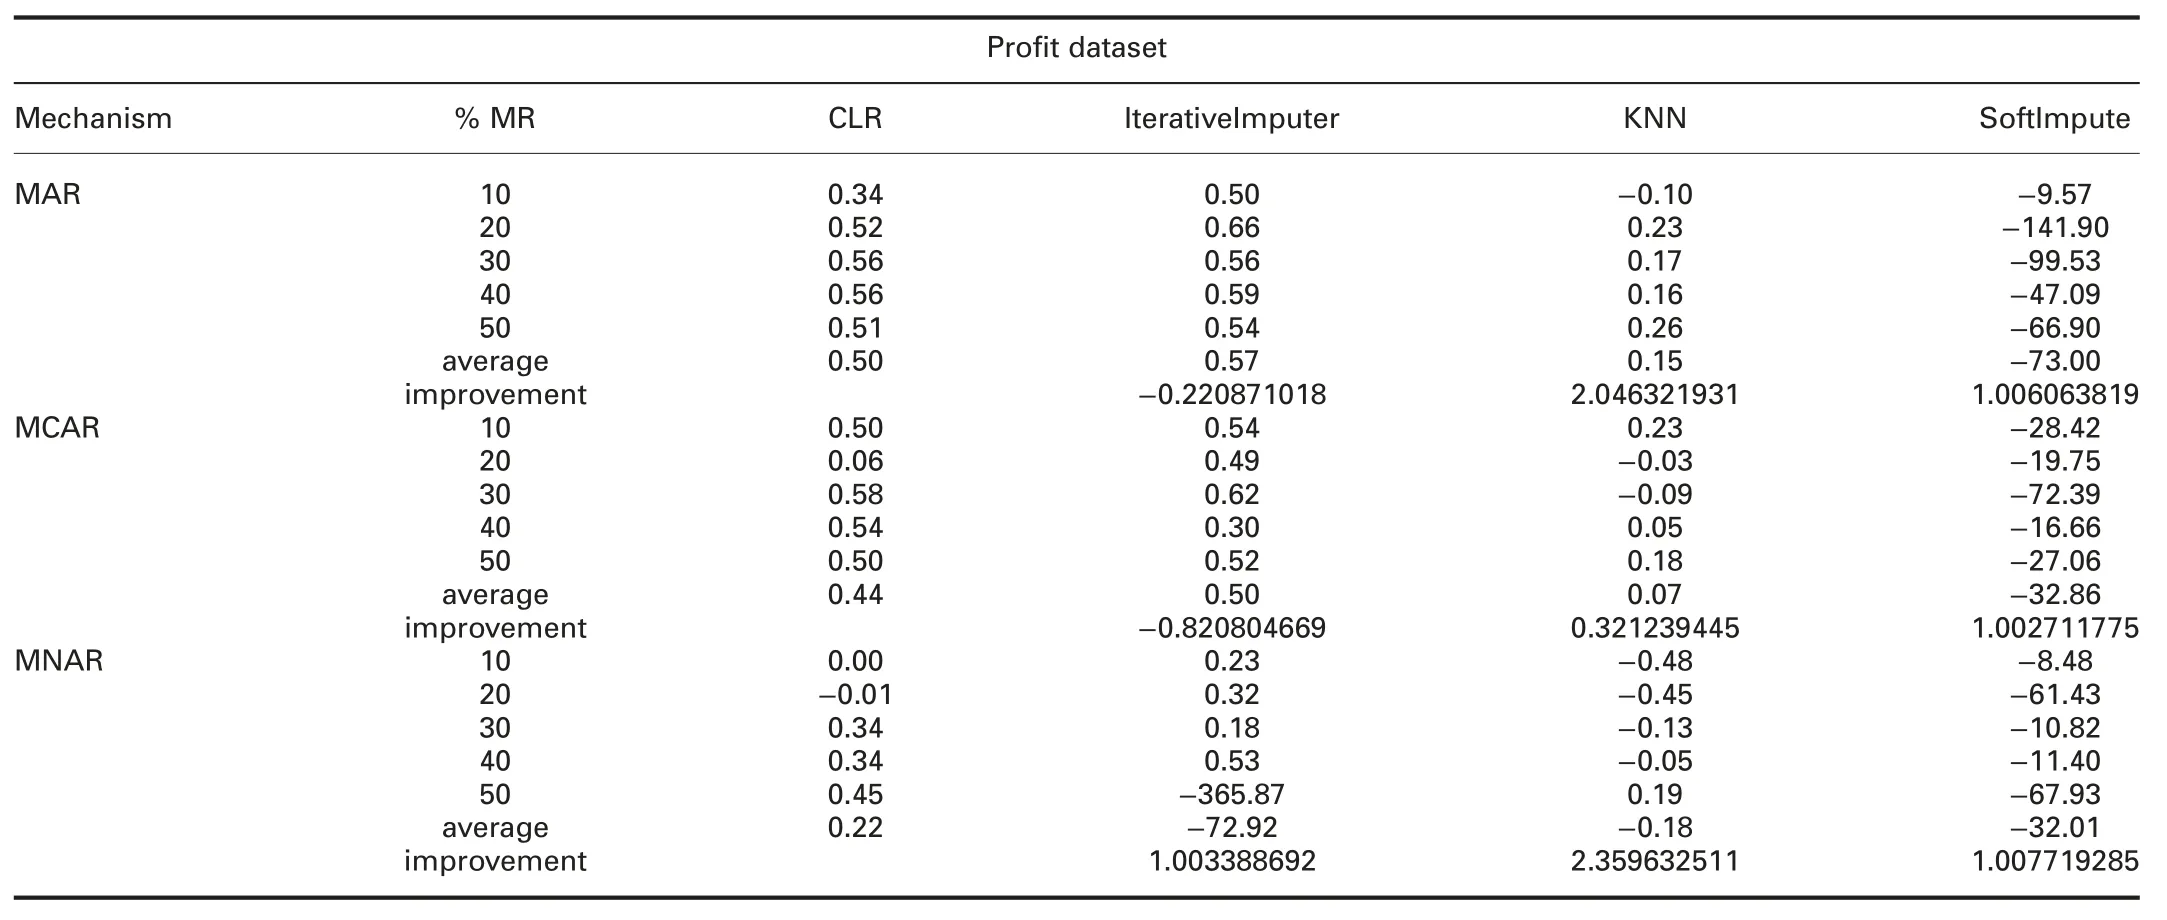
† For-profit dataset:In MAR,RMSE and MAE of CLR are significantly better than all R packages,except missForest.

Table 3 Packages and functions used for experiments
In MCAR,RMSE of CLR is better than all R packages,except mice and missForest.MAE of CLR is better than all R packages,except mice,missForest,and simputation.
In MNAR,RMSE of CLR is better than all R packages.MAE of CLR is better than all R packages,except mice and missForest.
RMSE and MAE of CLR are better than SoftImpute and worst than IterativeImputer and KNN in all missingness mechanisms.
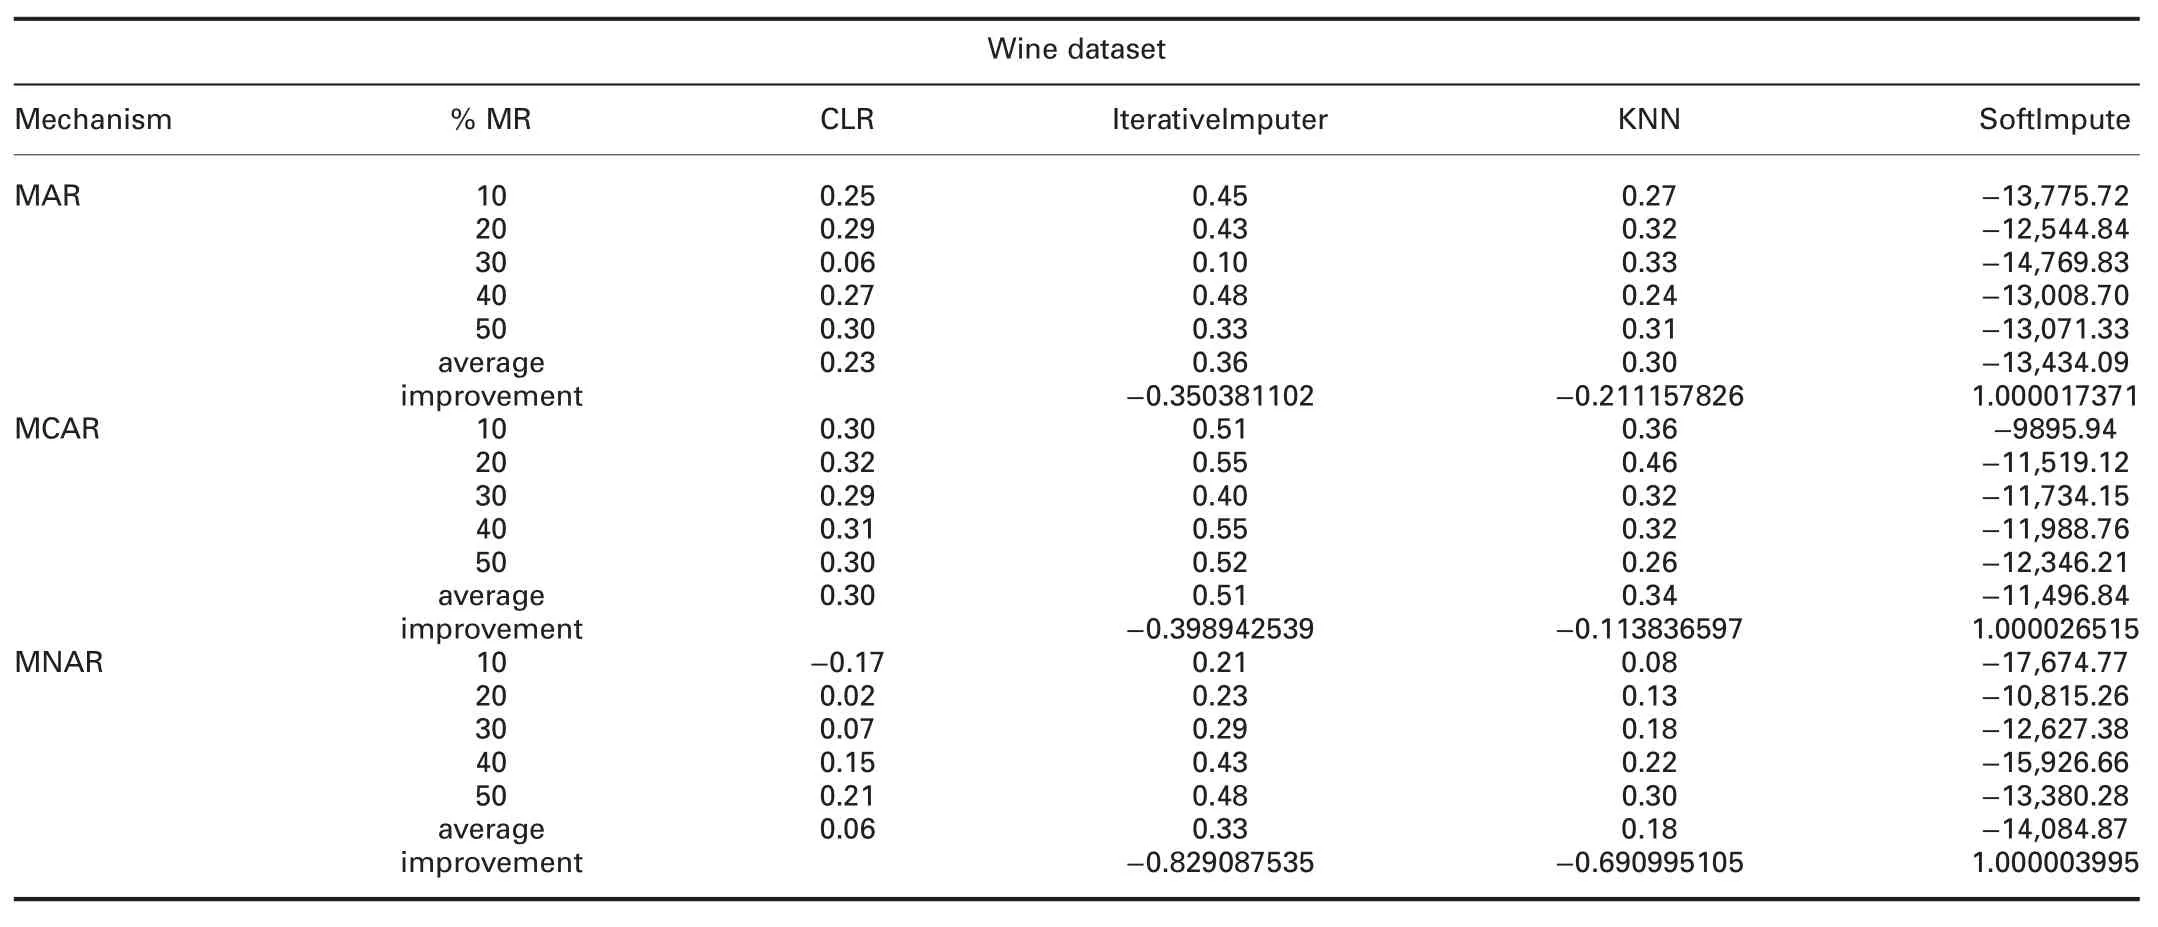
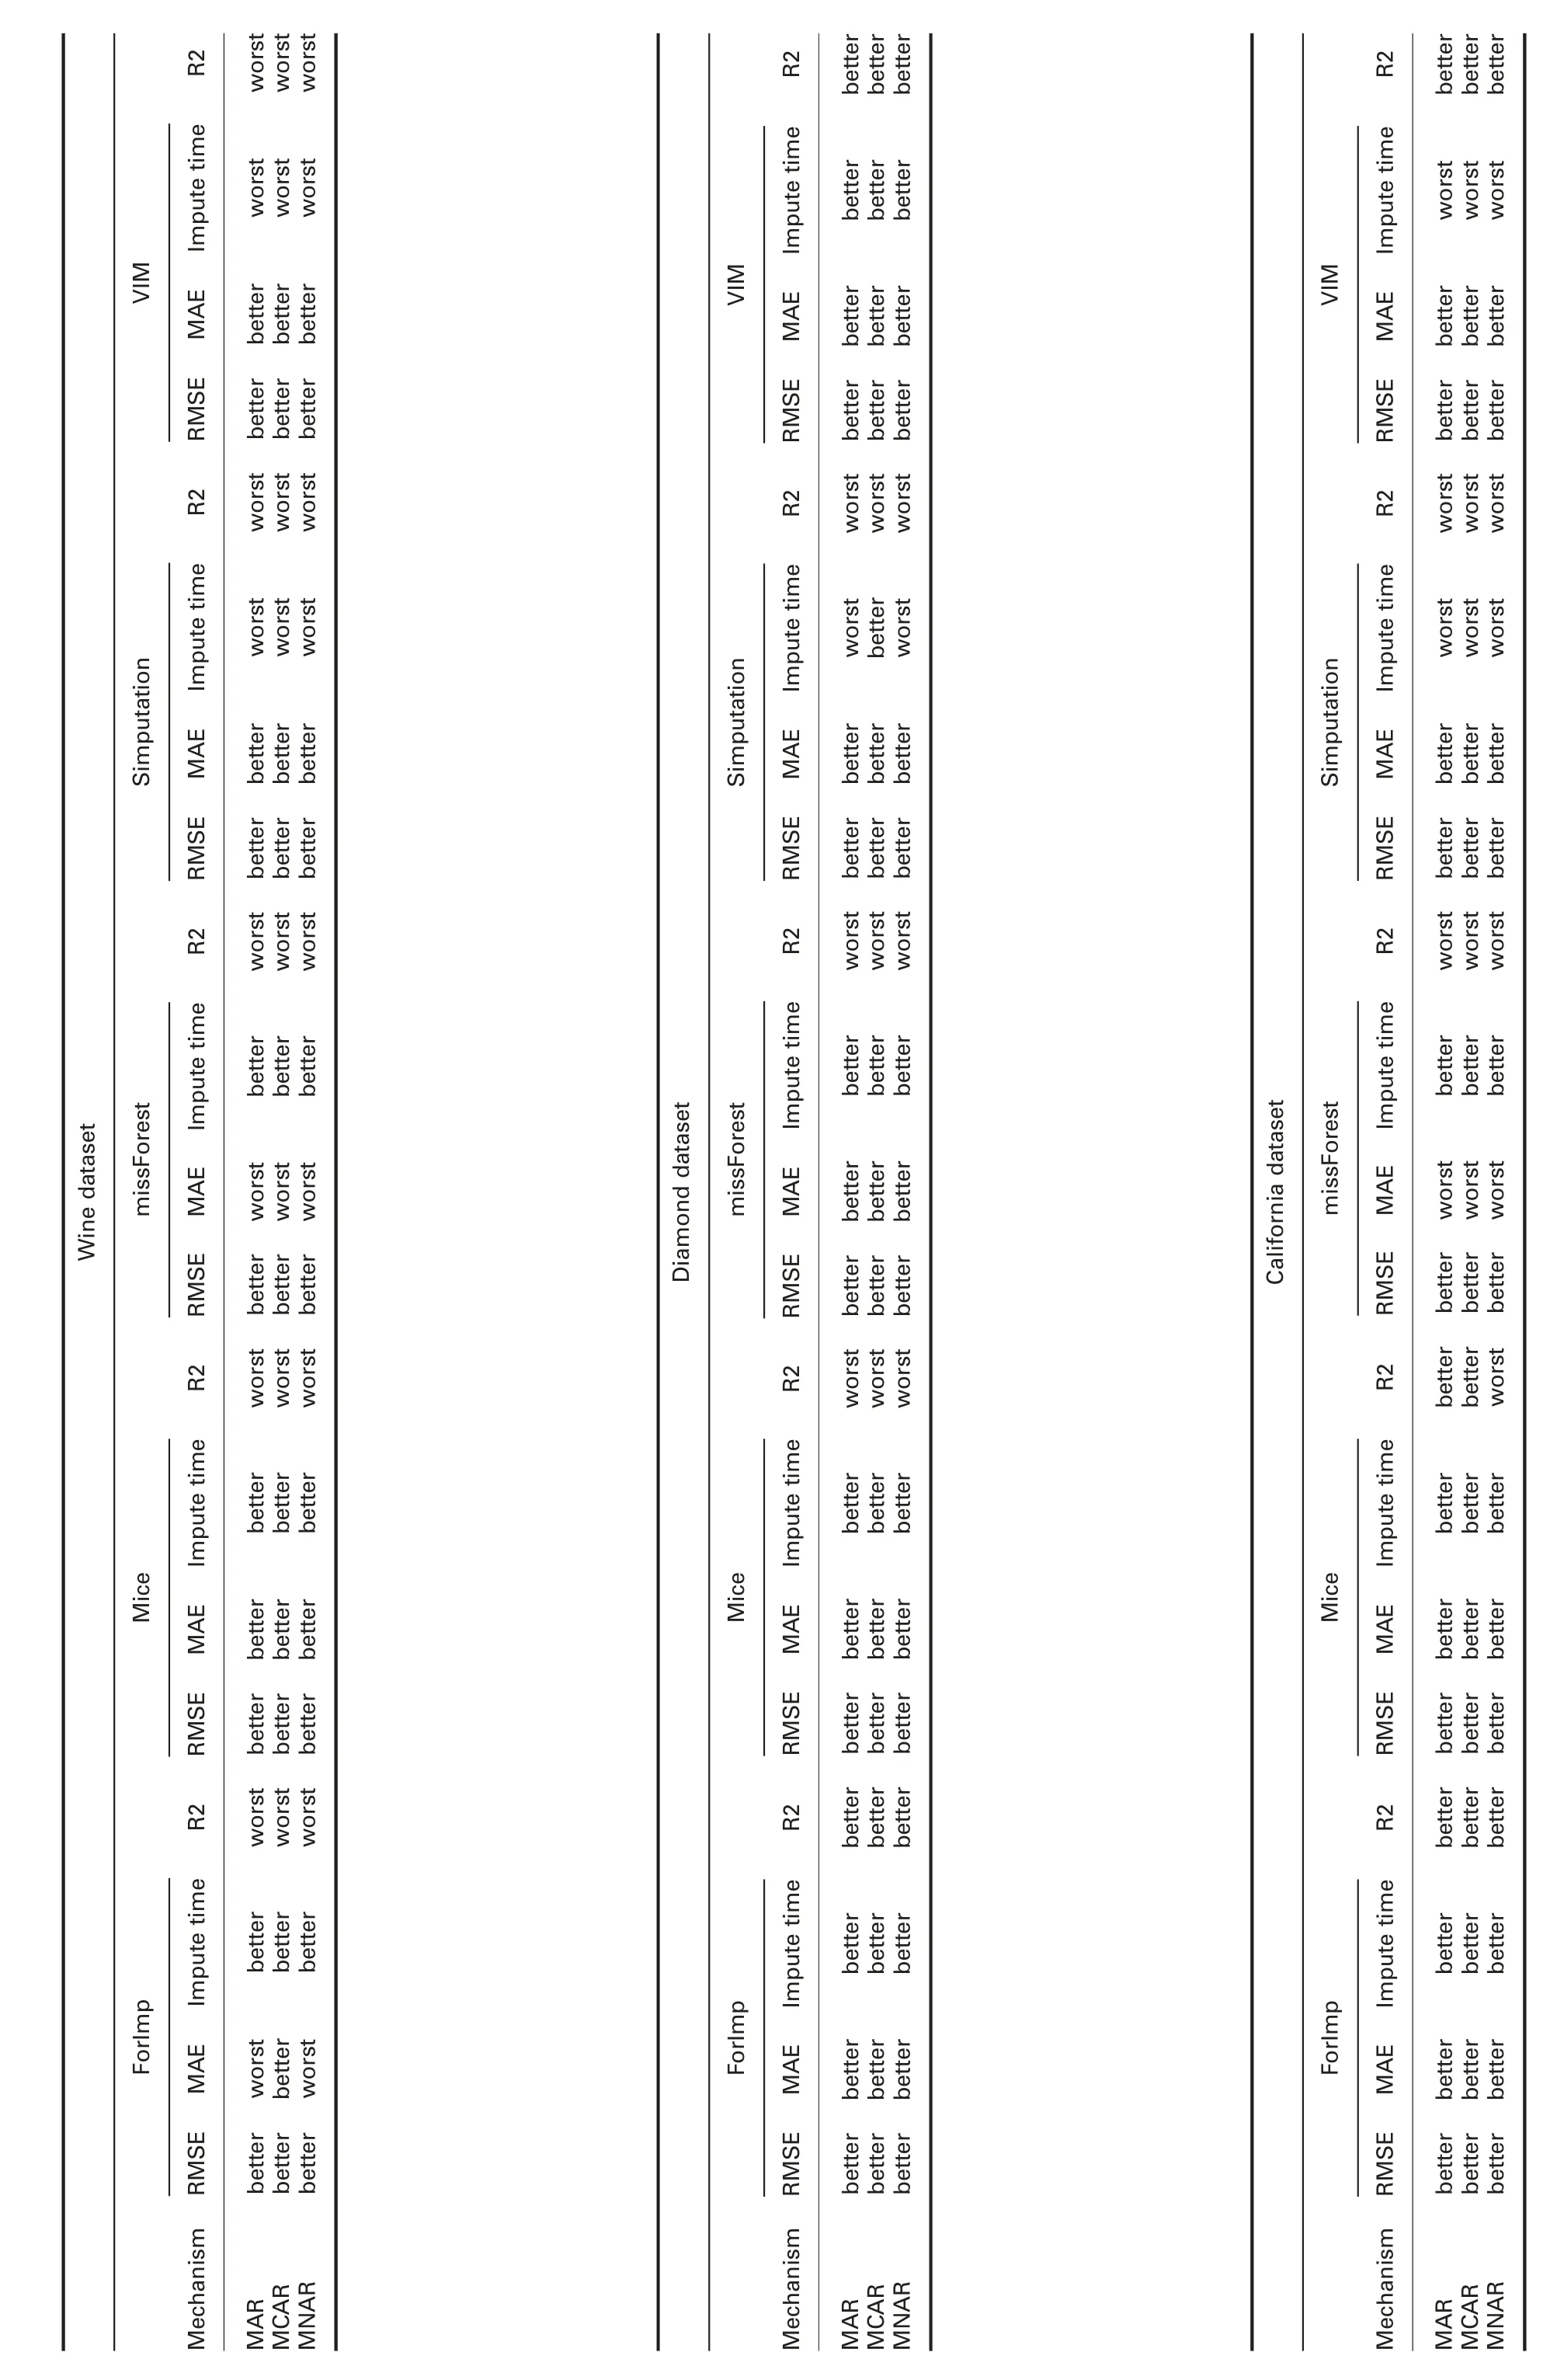
† For wine dataset:In MAR,RMSE of CLR is significantly better than all R packages.MAE of CLR is better than all R packages,except ForImp and missForest.
In MCAR,RMSE of CLR is significantly better than all R packages.MAE is better than all R packages,except missForest.
In MNAR,RMSE of CLR is significantly better than all R packages.MAE is better than all R packages,except ForImp and missForest.
RMSE and MAE of CLR are better than SoftImpute and worst than IterativeImputer and KNN in all missingness mechanisms.
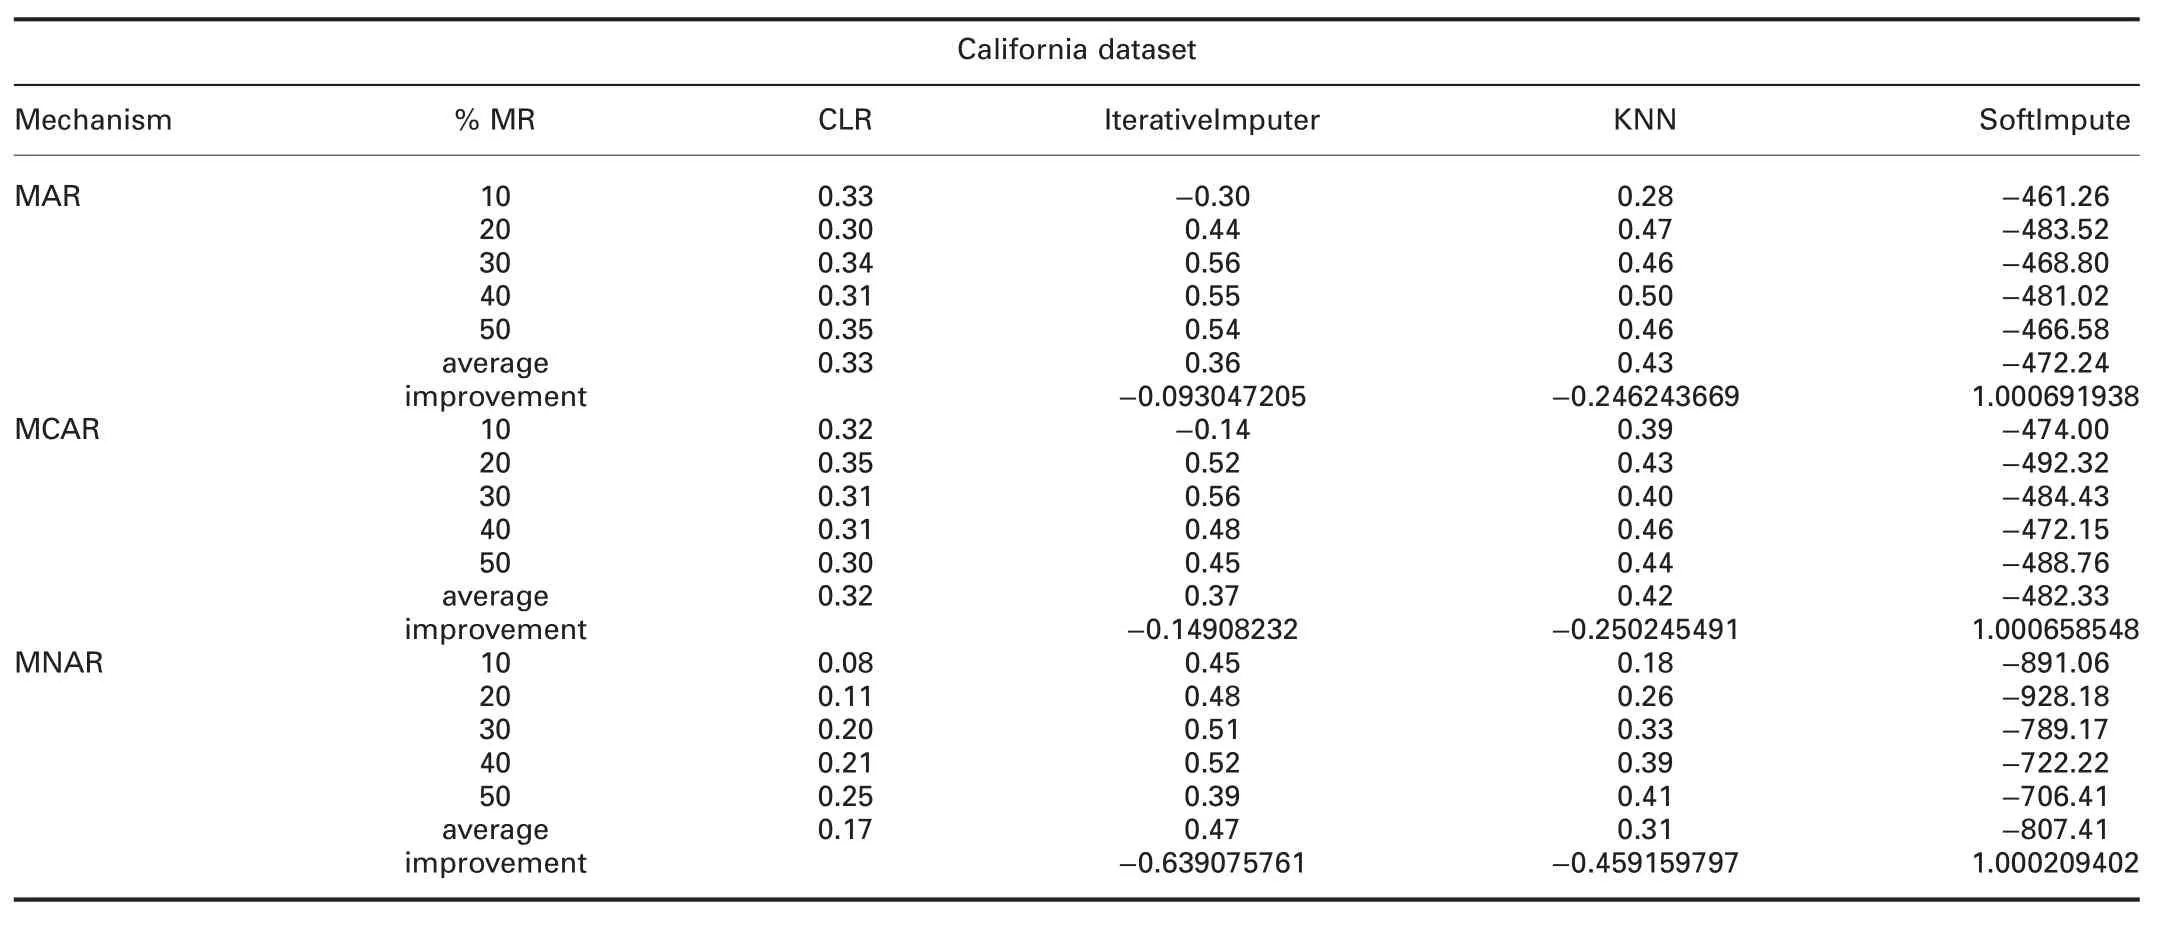
† For California dataset:ForImp failed in imputing the missing values in this dataset.RMSE of CLR is significantly better than all R packages in all missingness mechanisms.MAE of CLR is better than all R packages,except missForest in all missingness mechanisms.
RMSE and MAE of CLR are better than SoftImpute and worst than IterativeImputer in all missingness mechanisms.RMSE and MAE of CLR are better than KNN in MAR and MCAR,and worst in MNAR.
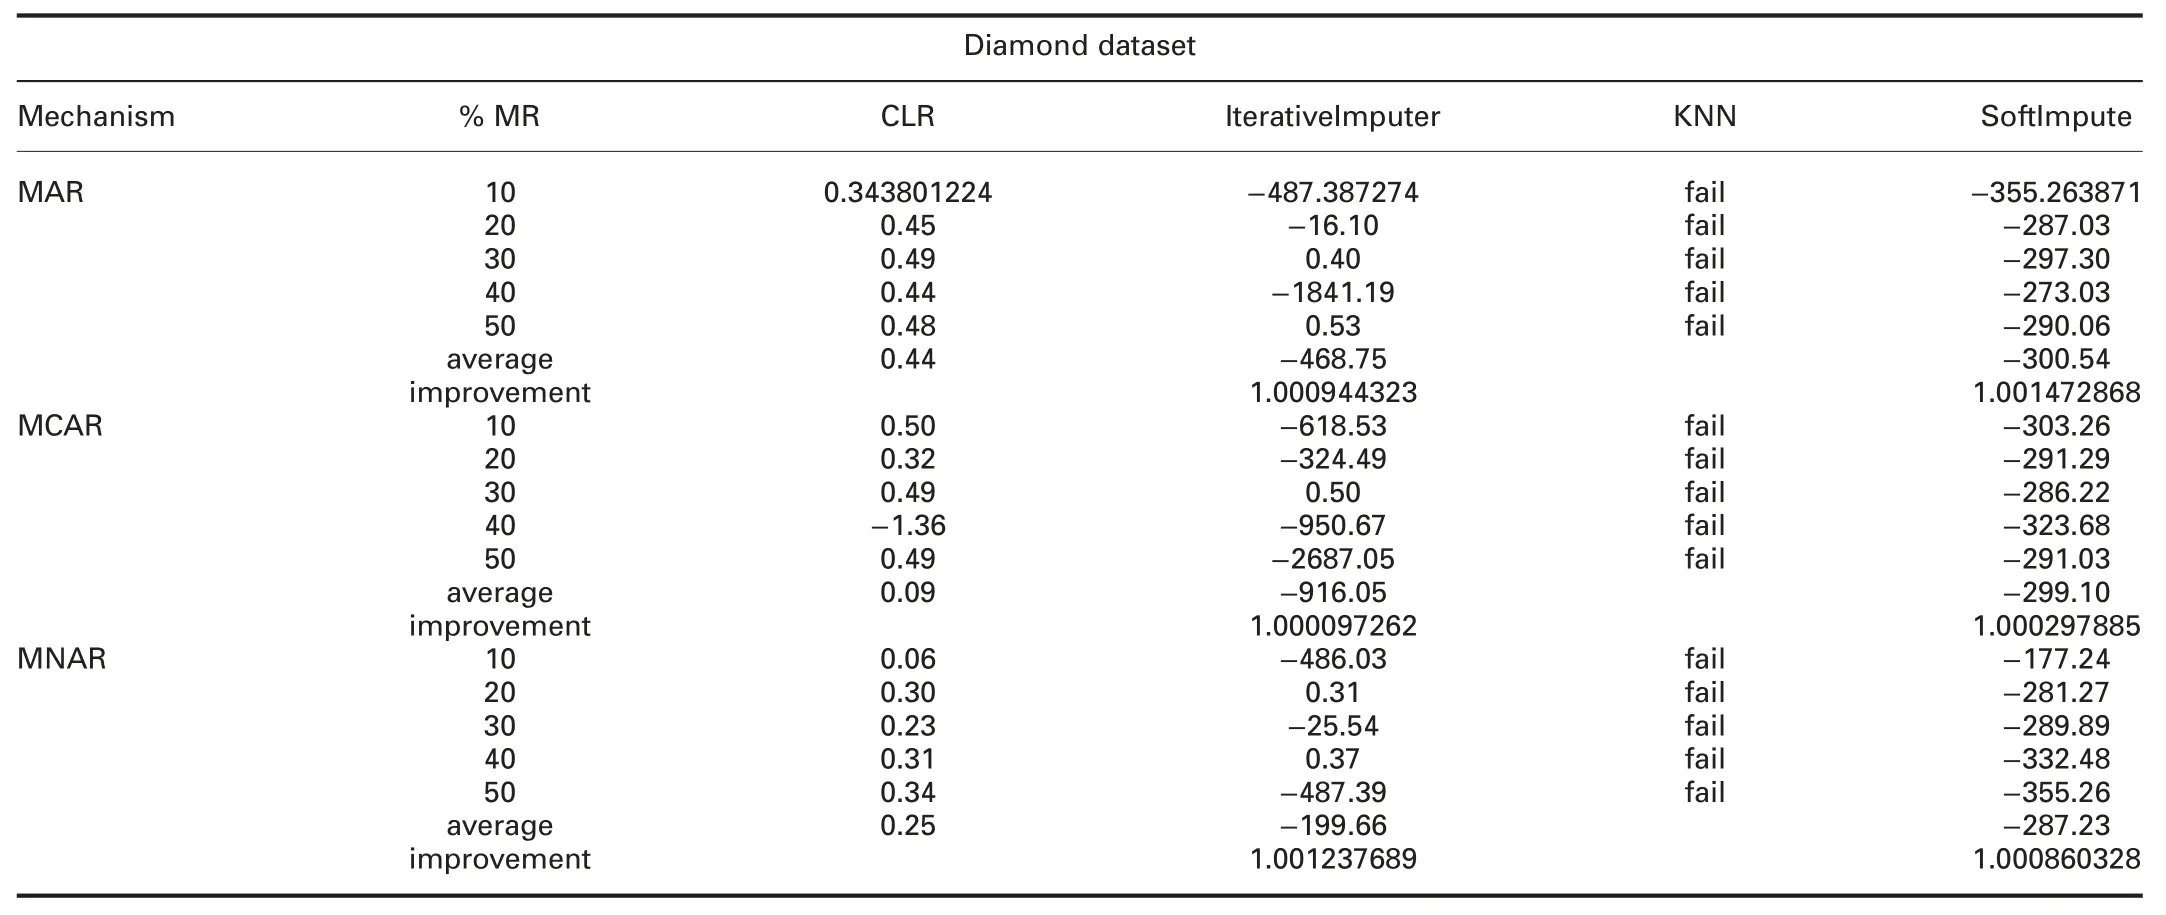
† For diamond dataset:ForImp and KNN failed in imputing the missing values in this dataset.RMSE and MAE of CLR are significantly better than all R packages in all missingness mechanisms.
RMSE and MAE of CLR are better than SoftImpute and worst than IterativeImputer in all missingness mechanisms.
4.4.2 Imputation time analysis:Tables 4 and 5 show the imputation times comparisons between CLR and R packages and CLR and Python packages,respectively.The prominent observations are:
† For admission dataset:Imputation times of CLR are better than ForImp,mice,and missForest,all Python packages,and worst than simputation and VIM in all missingness mechanisms.
† For diabetes dataset:Imputation times of CLR are better than ForImp,IterativeImputer,and SoftImpute,and worst than mice,missForest,simputation,VIM,and KNN in all missingness mechanisms.
† For-profit dataset:Imputation times of CLR are better than ForImp,mice,missForest,and all Python packages,and worst than simputation and VIM in all missingness mechanisms.
† For wine dataset:Imputation times of CLR are better than ForImp,mice,missForest,KNN,and SoftImpute,worst than simputation and VIM,and behave somewhat similar to IterativeImputer in all missingness mechanisms.
† For California dataset:ForImp failed in imputing the missing values in this dataset.Imputation times of CLR are better than mice,and missForest,KNN,and SoftImpute,and worst than simputation,VIM,and IterativeImputer in all missingness mechanisms.
† For diamond dataset:ForImp and KNN failed in imputing the missing values in this dataset.Imputation times of CLR are significantly better than mice,missForest,VIM,IterativeImputer,and SoftImpute.CLR behaves somewhat similar to simputation.
4.4.3 Accuracy analysis:The accuracy can be defined as:how well the model will predict the unseen observations.Tables 6 and 7 show the R2comparisons between CLR and R packages and CLR and Python packages,respectively.The prominent observations are:
† For admission dataset:R2of CLR is worst than all R packages,except VIM in all missingness mechanisms.In all missingness mechanisms,R2of CLR is worst than IterativeImputer and better than KNN and SoftImpute.
† For diabetes dataset:In MAR,R2of CLR is better than ForImp and worst than mice,missForest,simputation,and VIM.In MCAR,R2of CLR is better than all R packages.
In MNAR,R2of CLR is worst than all R packages.R2of CLR is worst than IterativeImputer and better than KNN and SoftImpute in all missingness mechanisms.
† For-profit dataset:R2of CLR is better than VIM and worst than ForImp,mice,missForest,and simputation in all missingness mechanisms.
In MAR,R2of CLR is worst than IterativeImputer and better than KNN and SoftImpute.In MCAR,R2of CLR is worst than IterativeImputer and better than KNN and SoftImpute.In MNAR,R2of CLR is better than IterativeImputer,KNN,and SoftImpute.
† For wine dataset:R2of CLR is worst than all R packages.R2of CLR is worst than IterativeImputer and KNN,and better than SoftImpute in all missingness mechanisms.
† For California dataset:ForImp failed in imputing the missing values in this dataset.In MAR and MCAR,R2of CLR is better than mice,and VIM,and worst than missForest and simputation.
In MNAR,R2of CLR is better than VIM and worst than mice,missForest,and simputation.R2of CLR is worst than IterativeImputer and KNN,and better than SoftImpute in all missingness mechanisms.
† For diamond dataset:ForImp and KNN failed in imputing the missing values in this dataset.R2of CLR is better than VIM,IterativeImputer,and KNN,and worst than mice,missForest,and simputation packages in all missingness mechanisms.
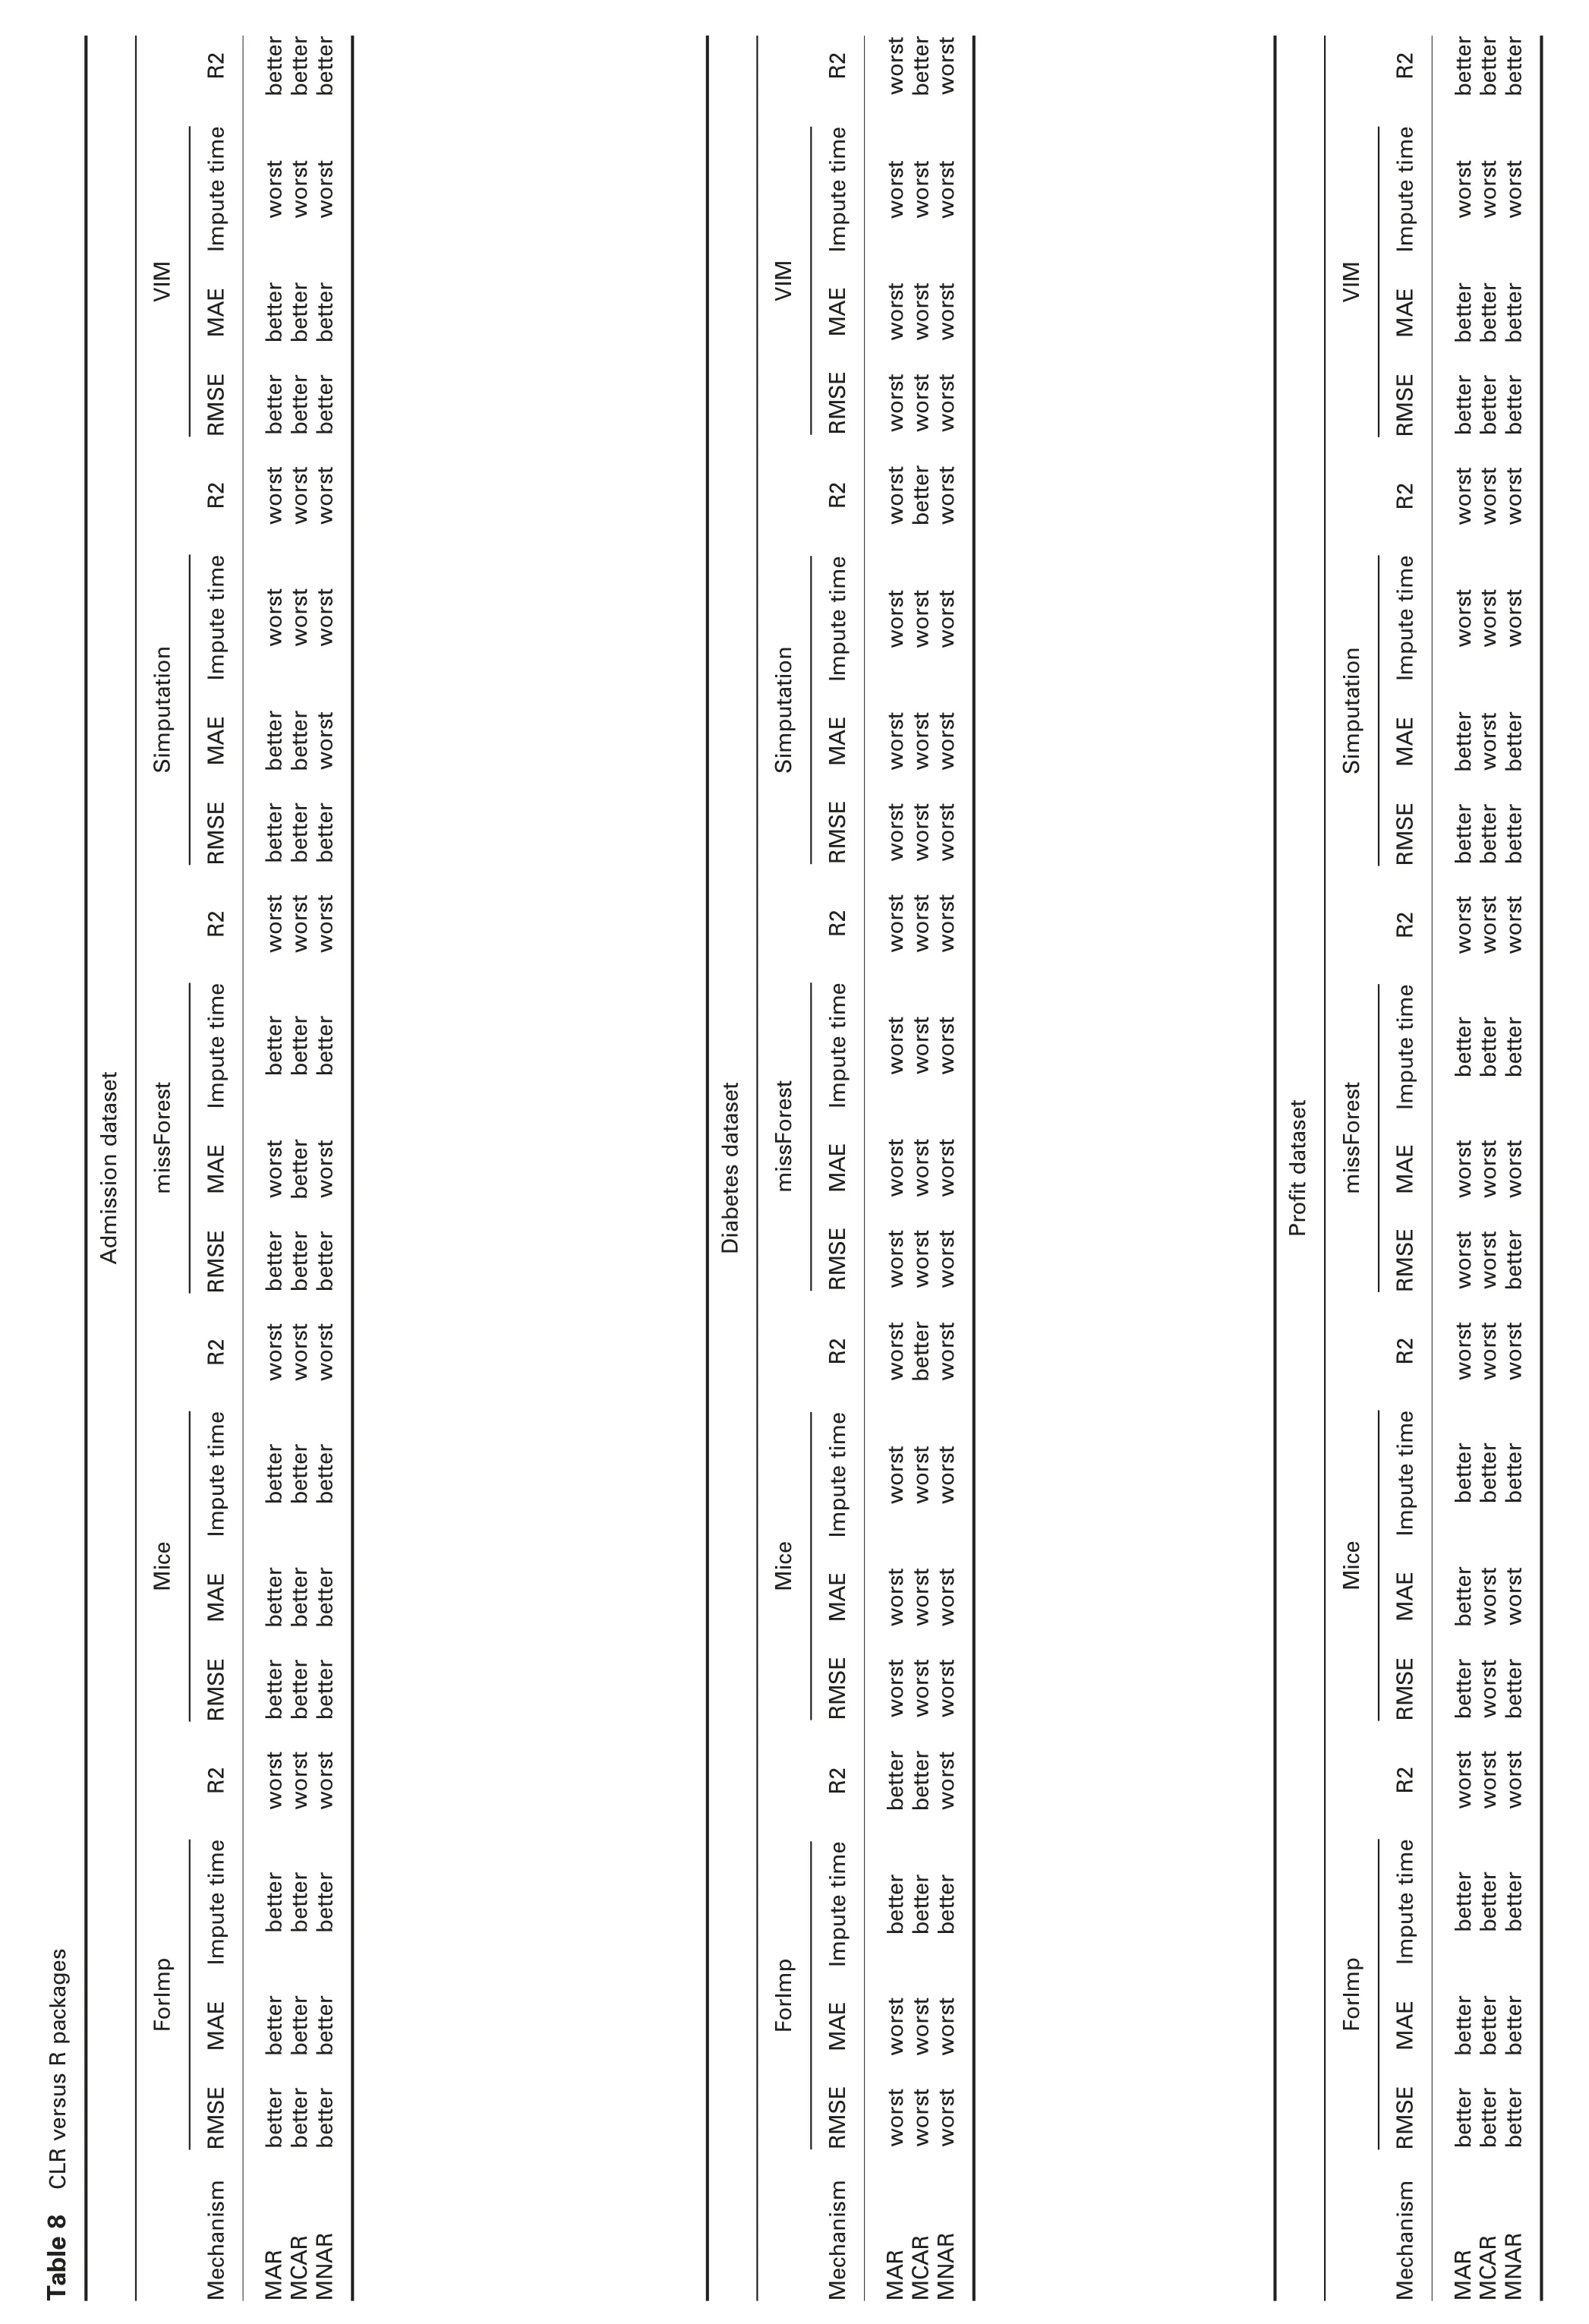
Tables 8 and 9 summarise these observations by comparing the improvements of CLR versus R packages and CLR versus Python packages,respectively.
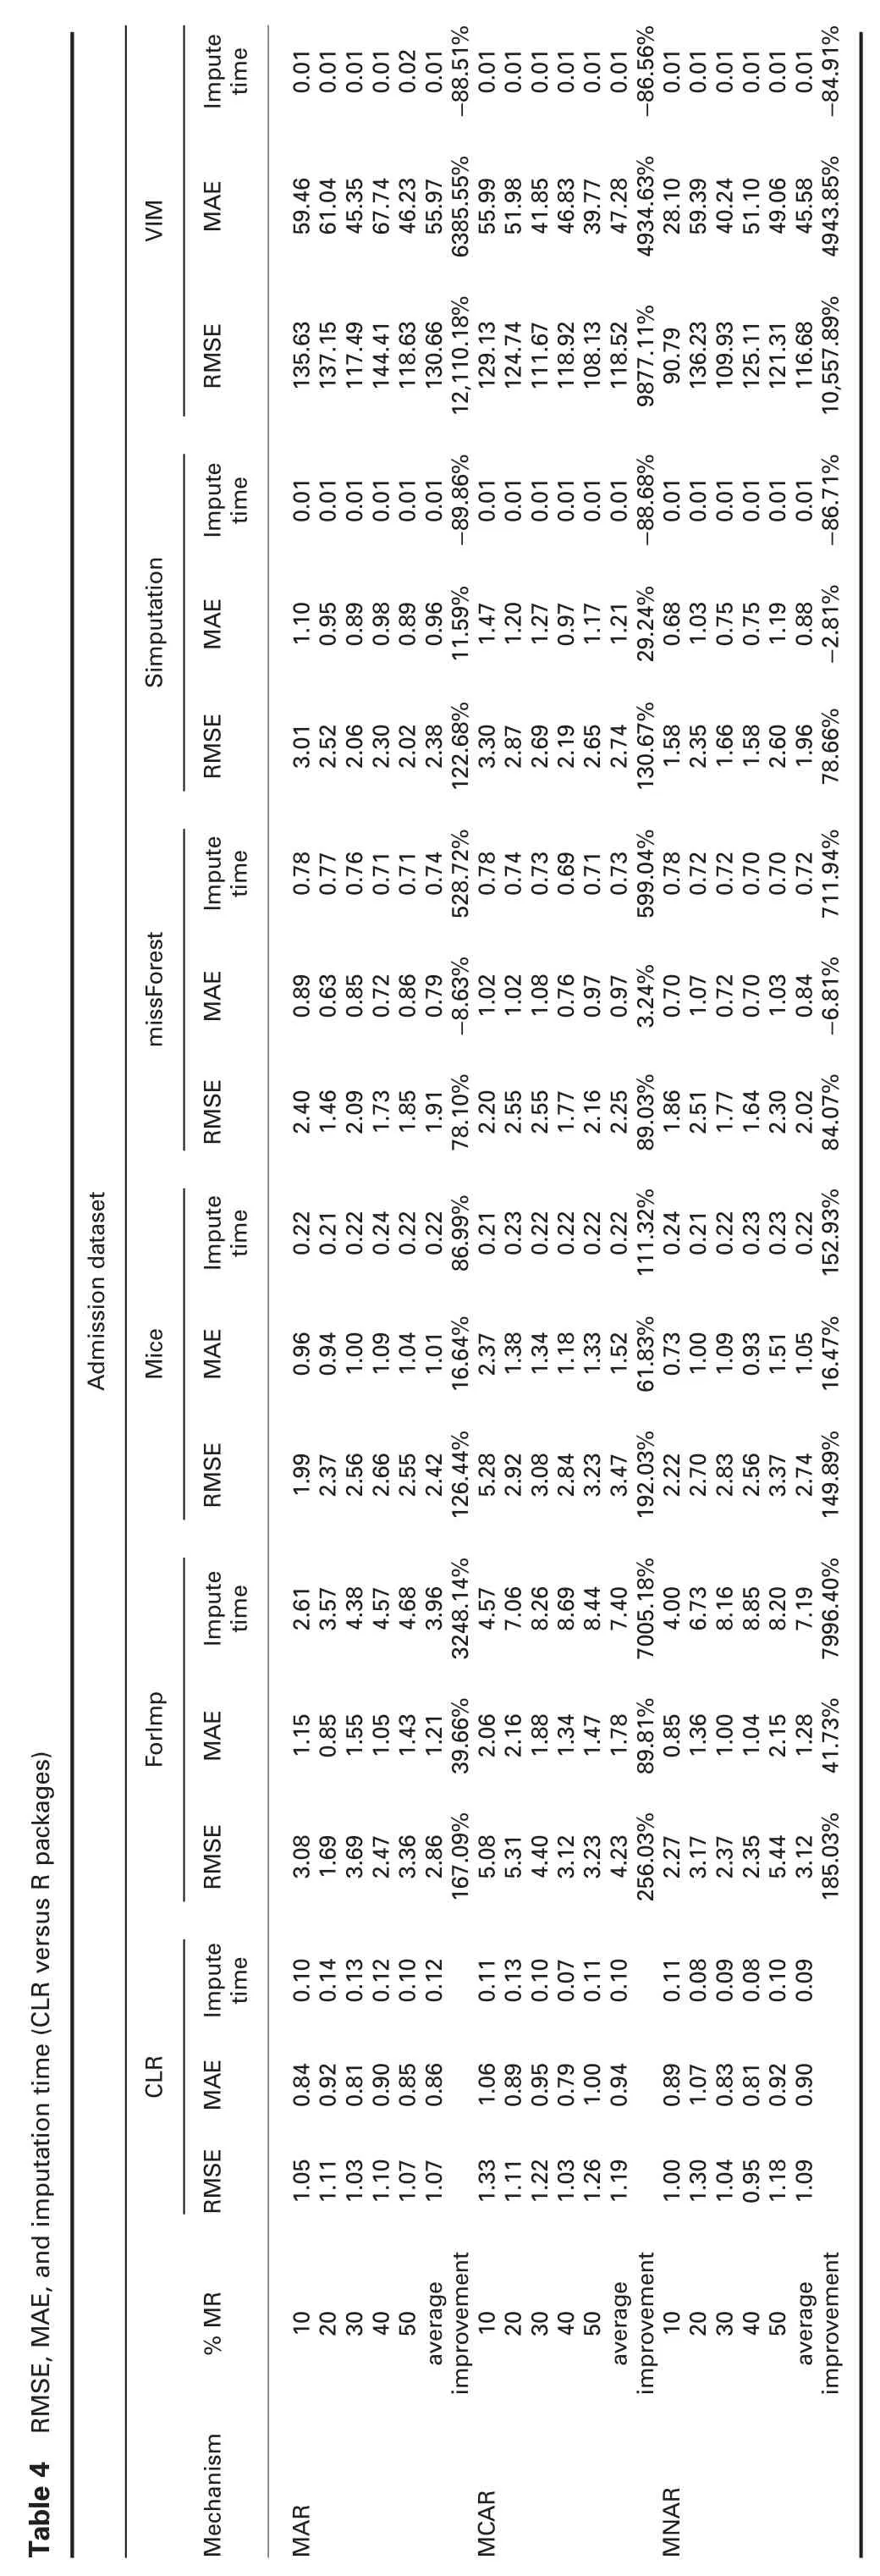
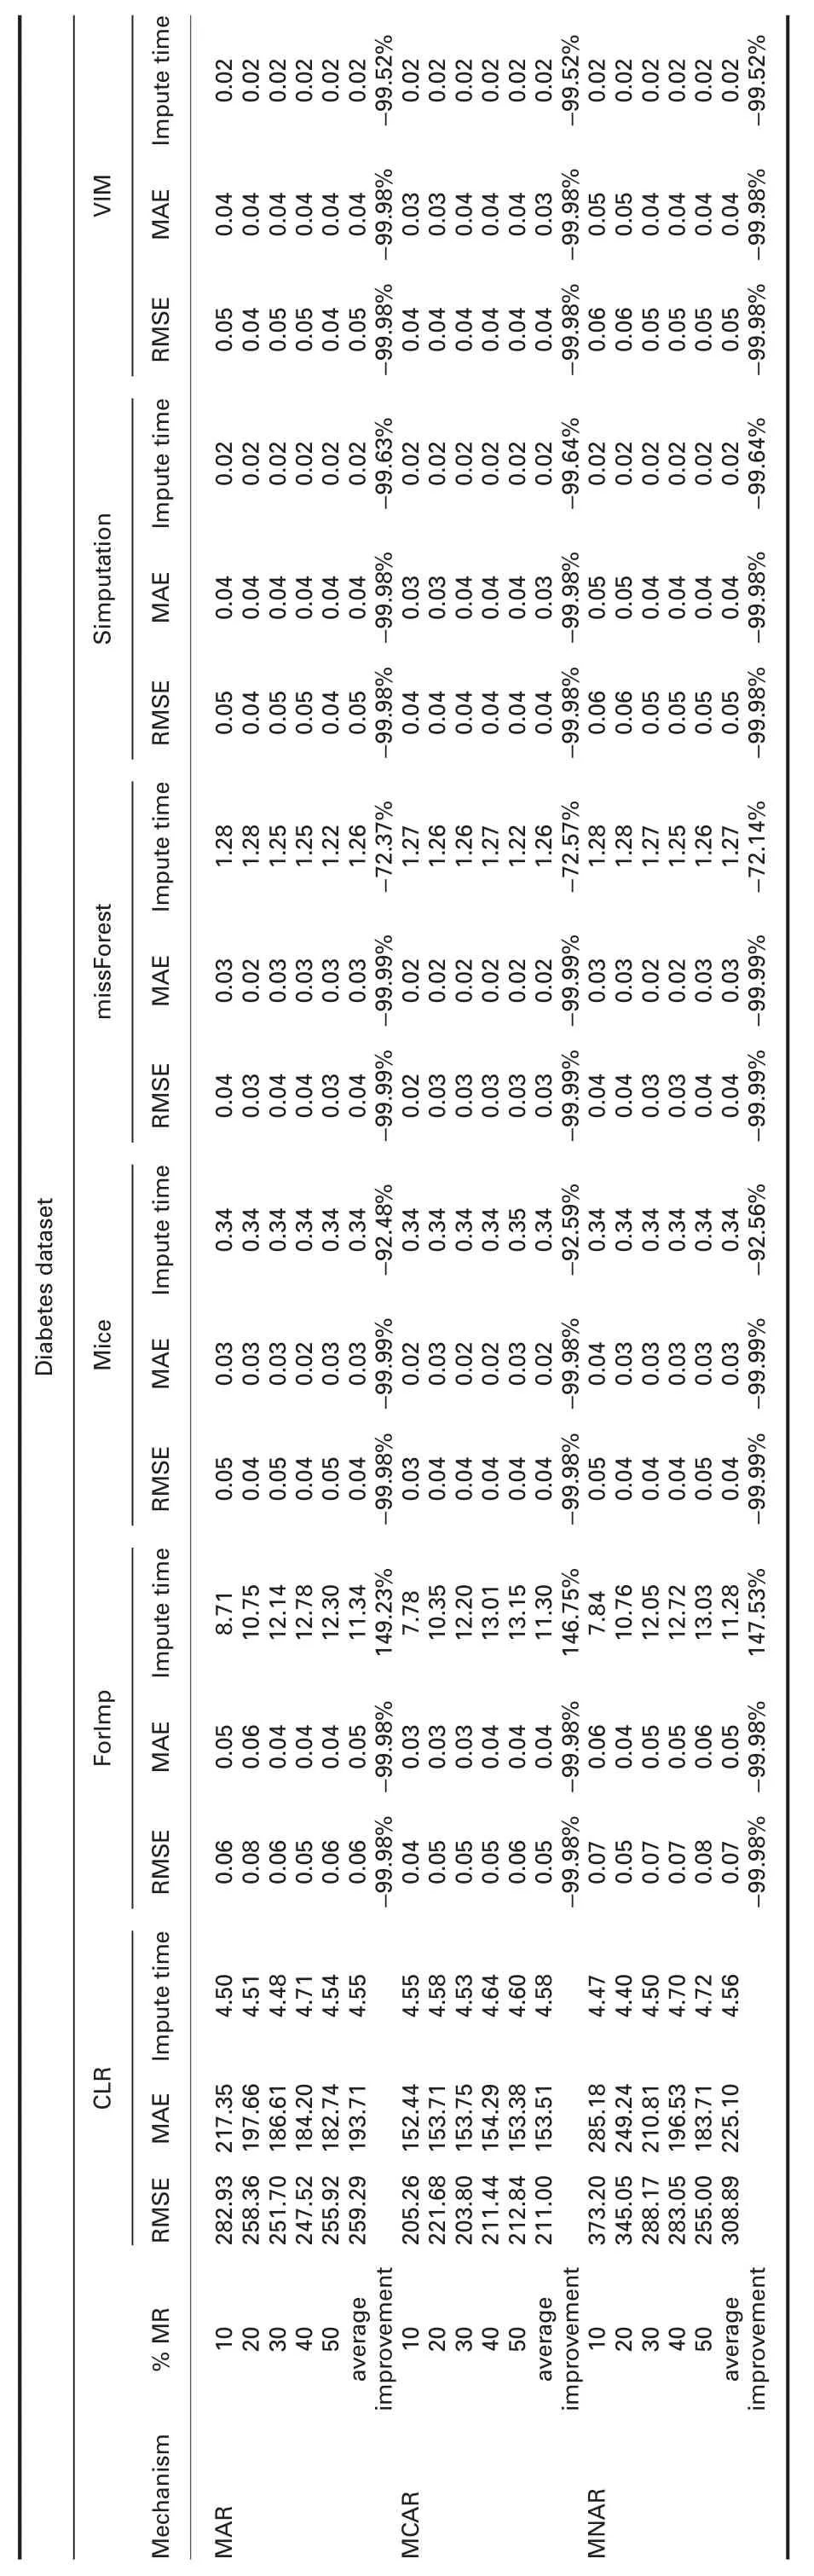

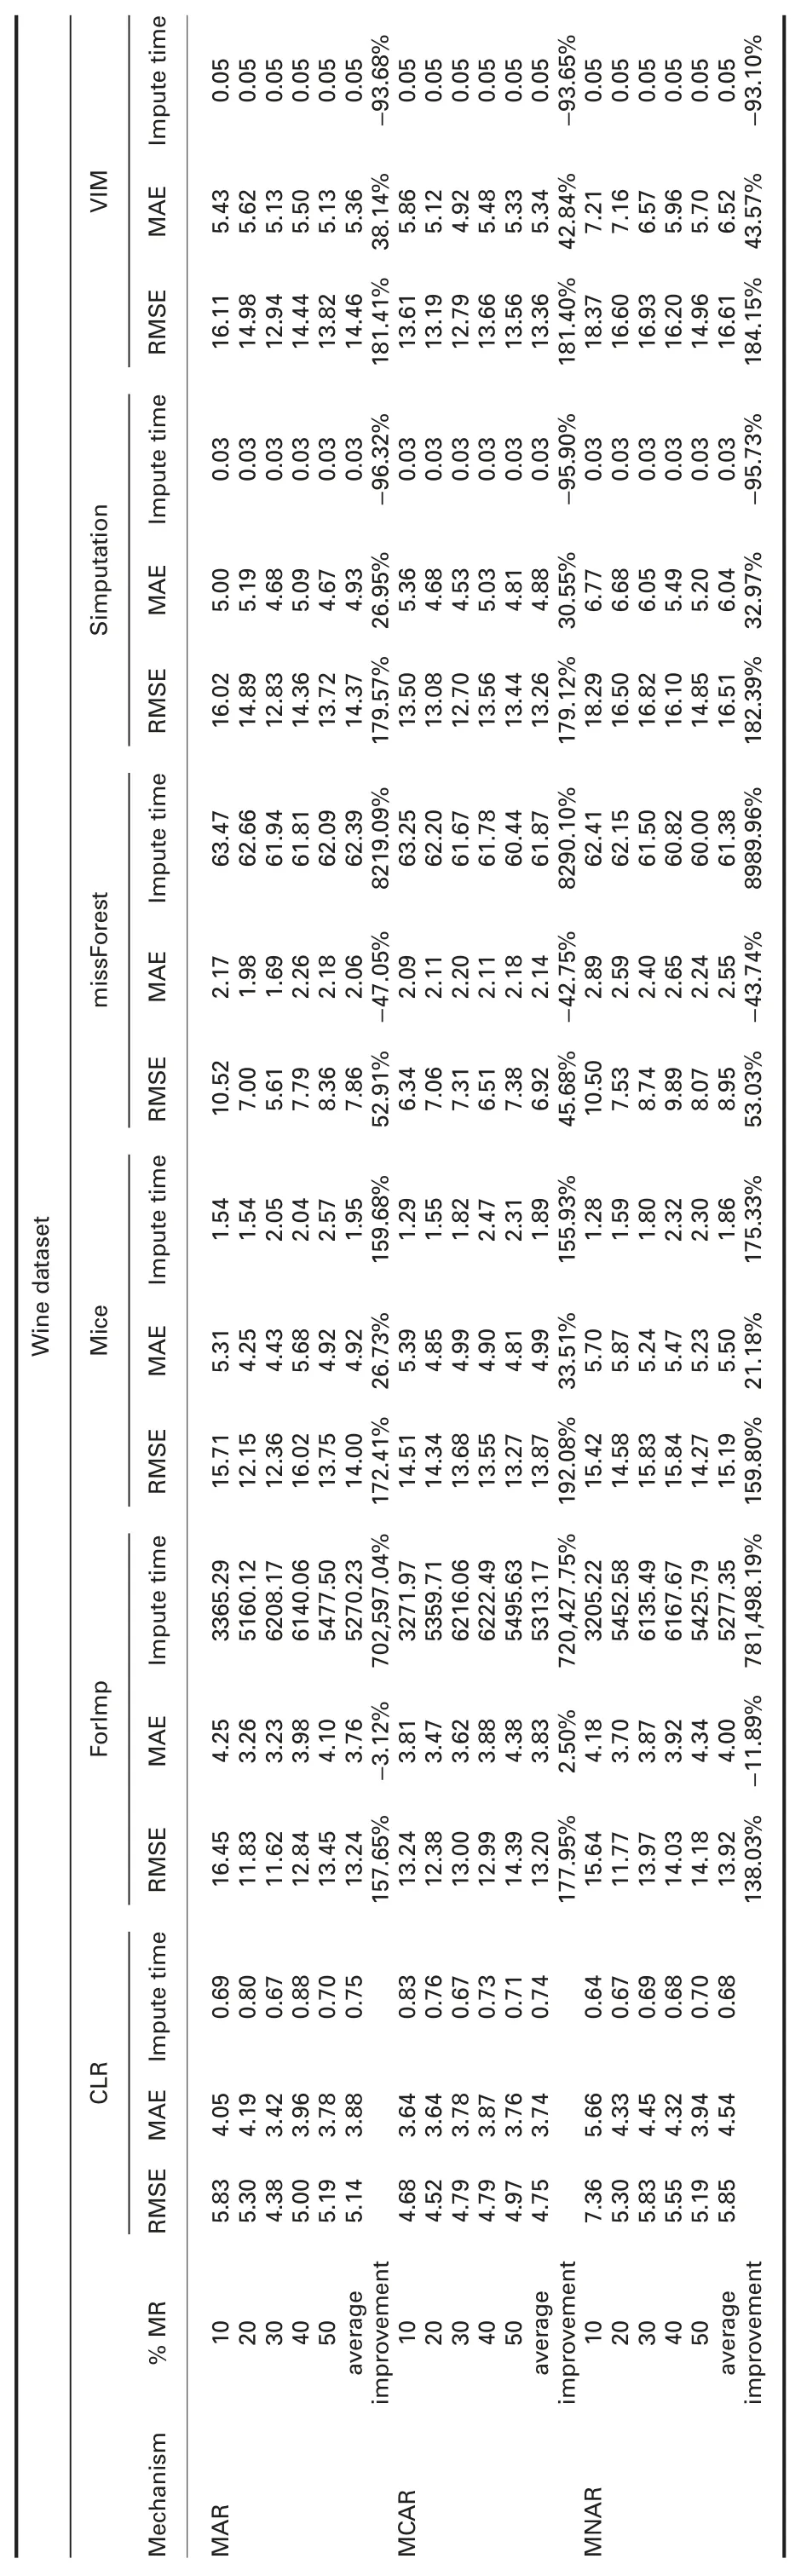

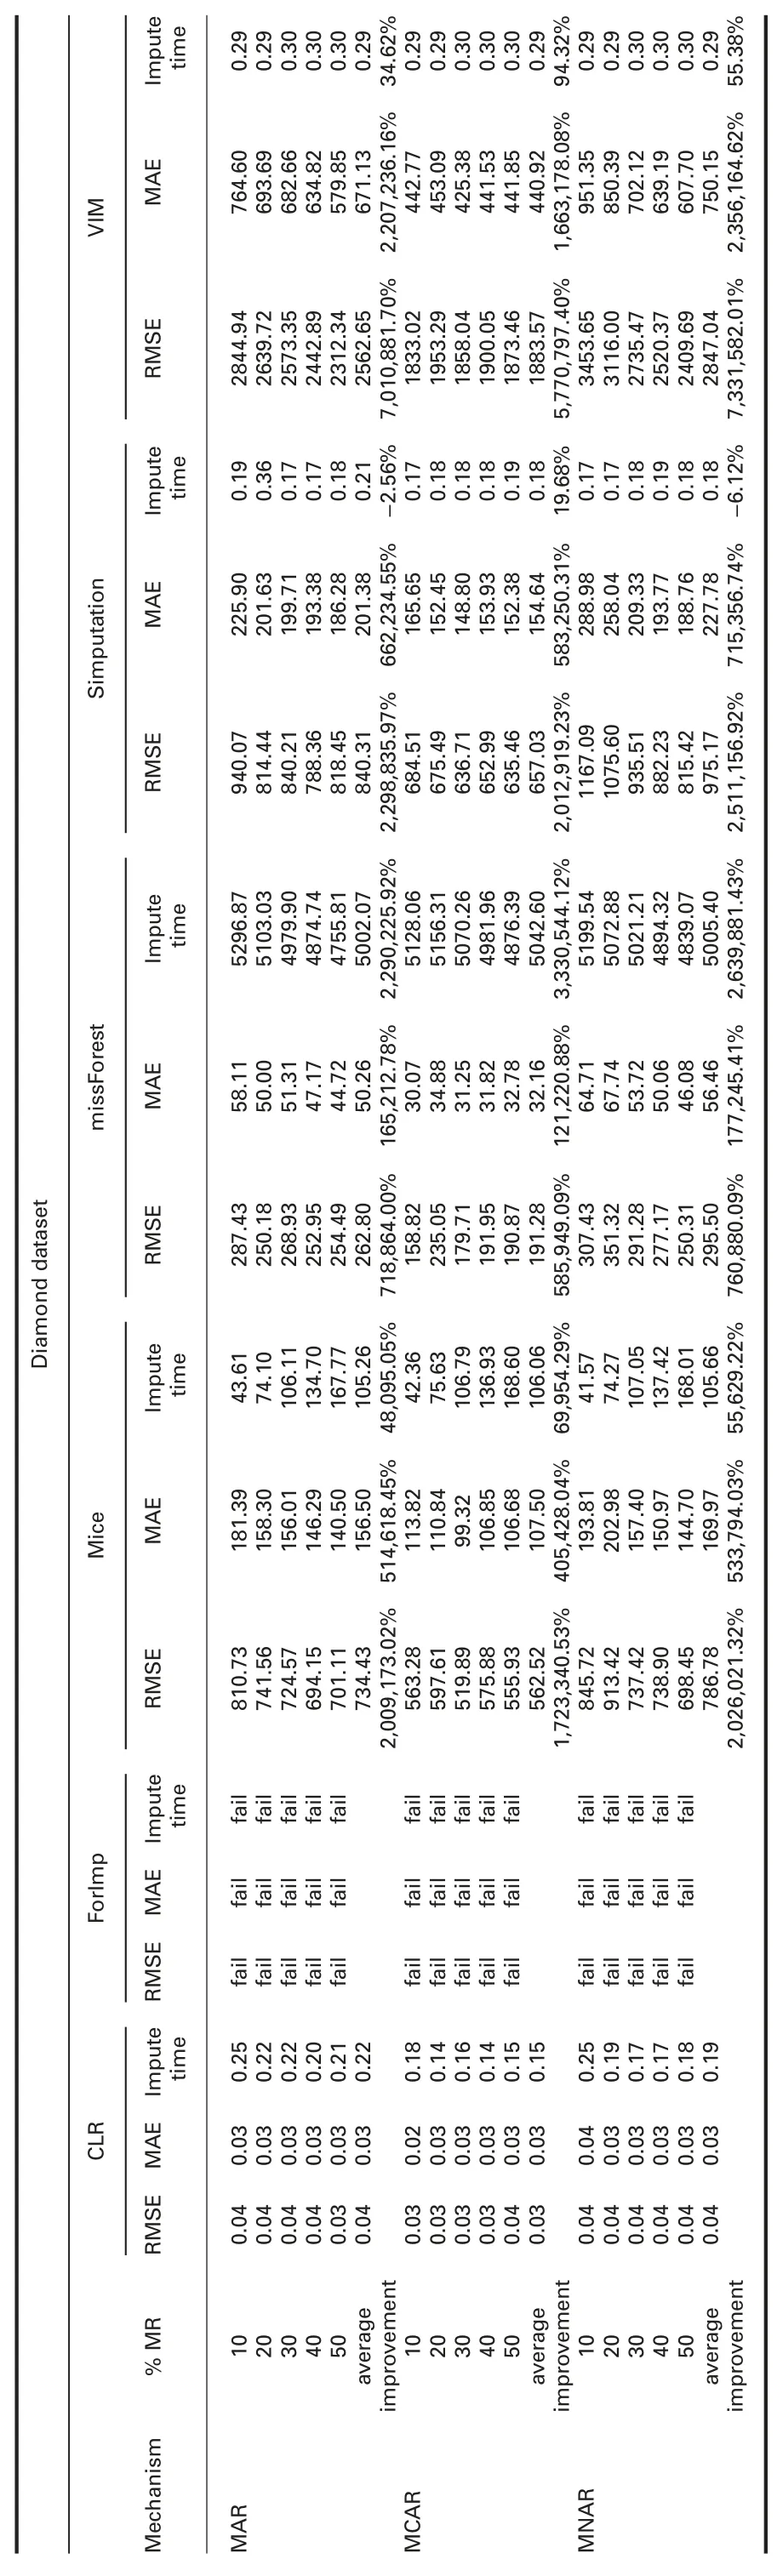
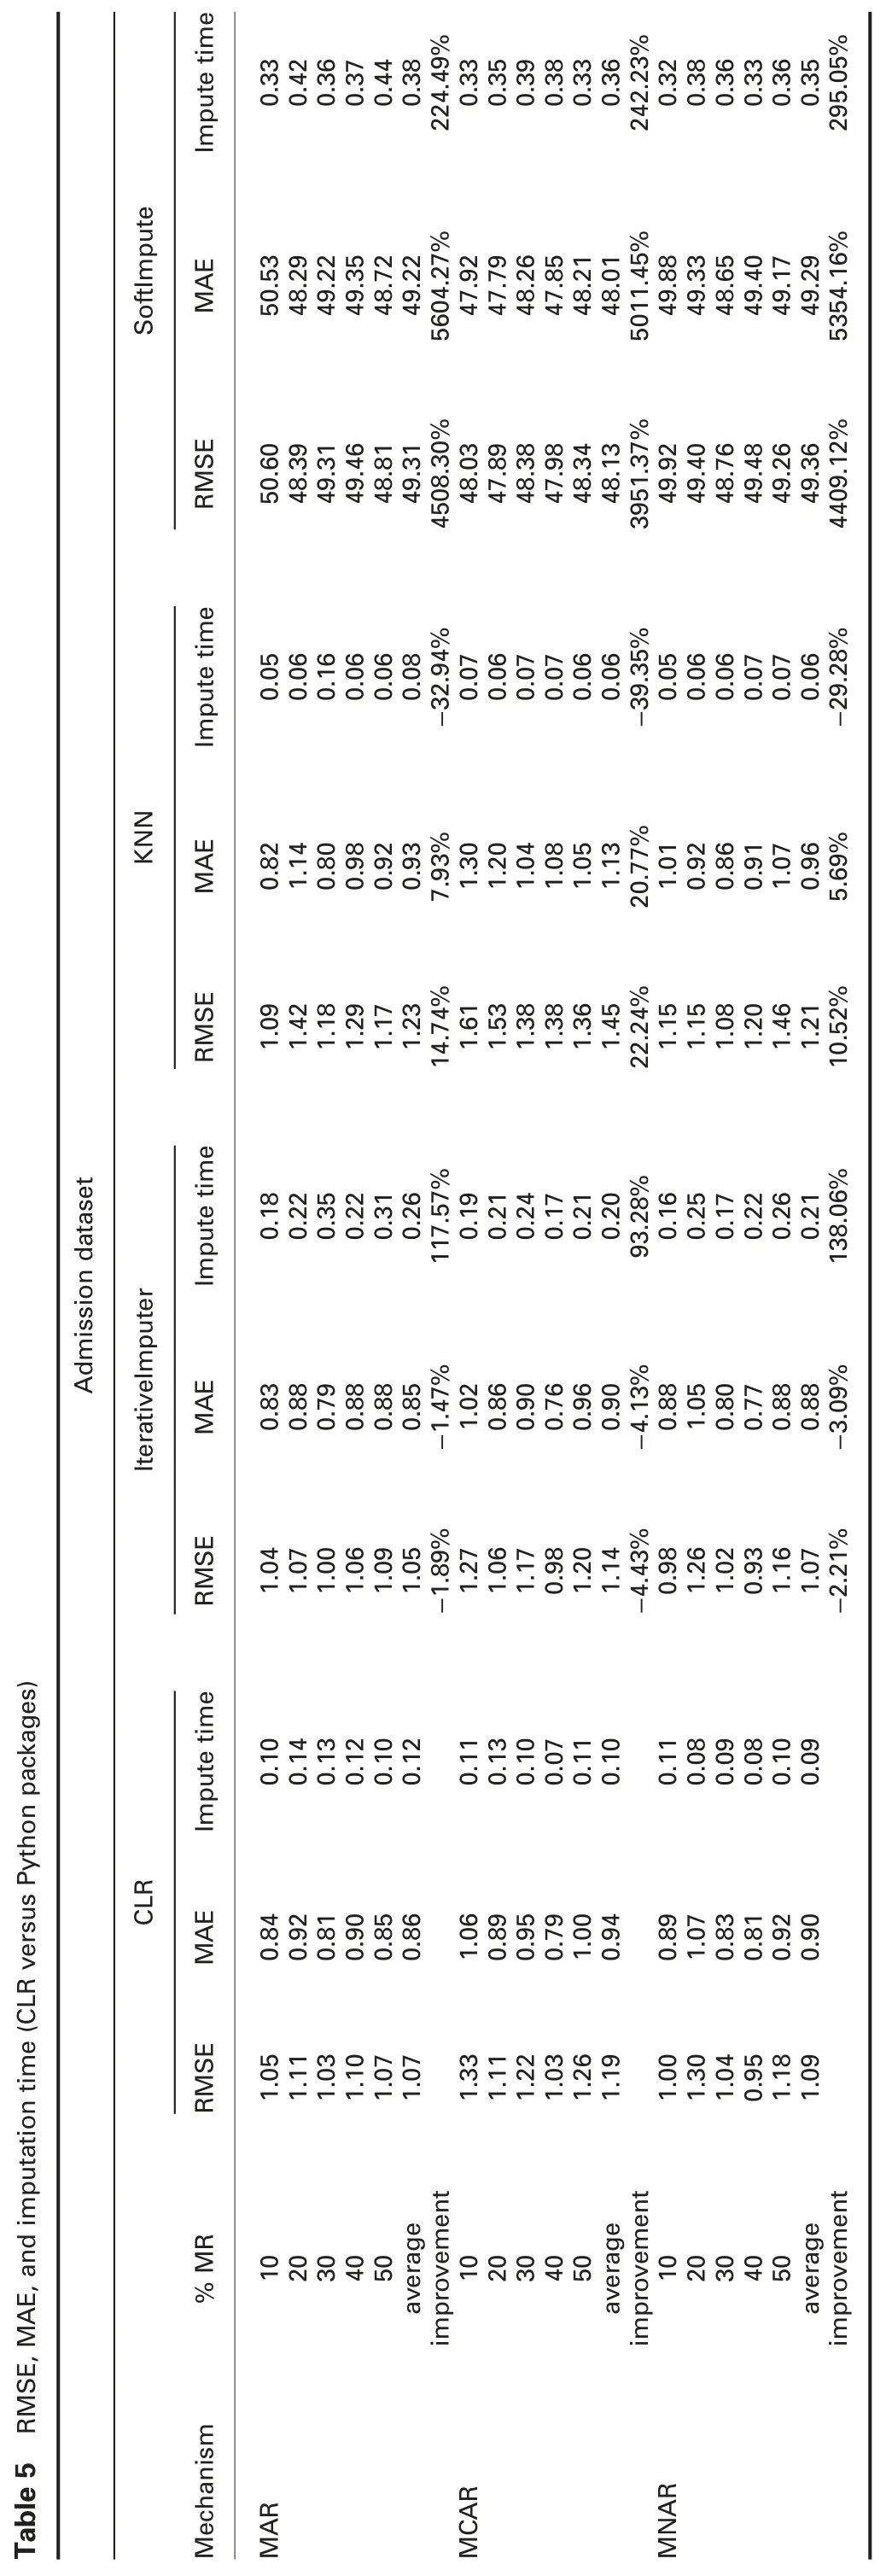

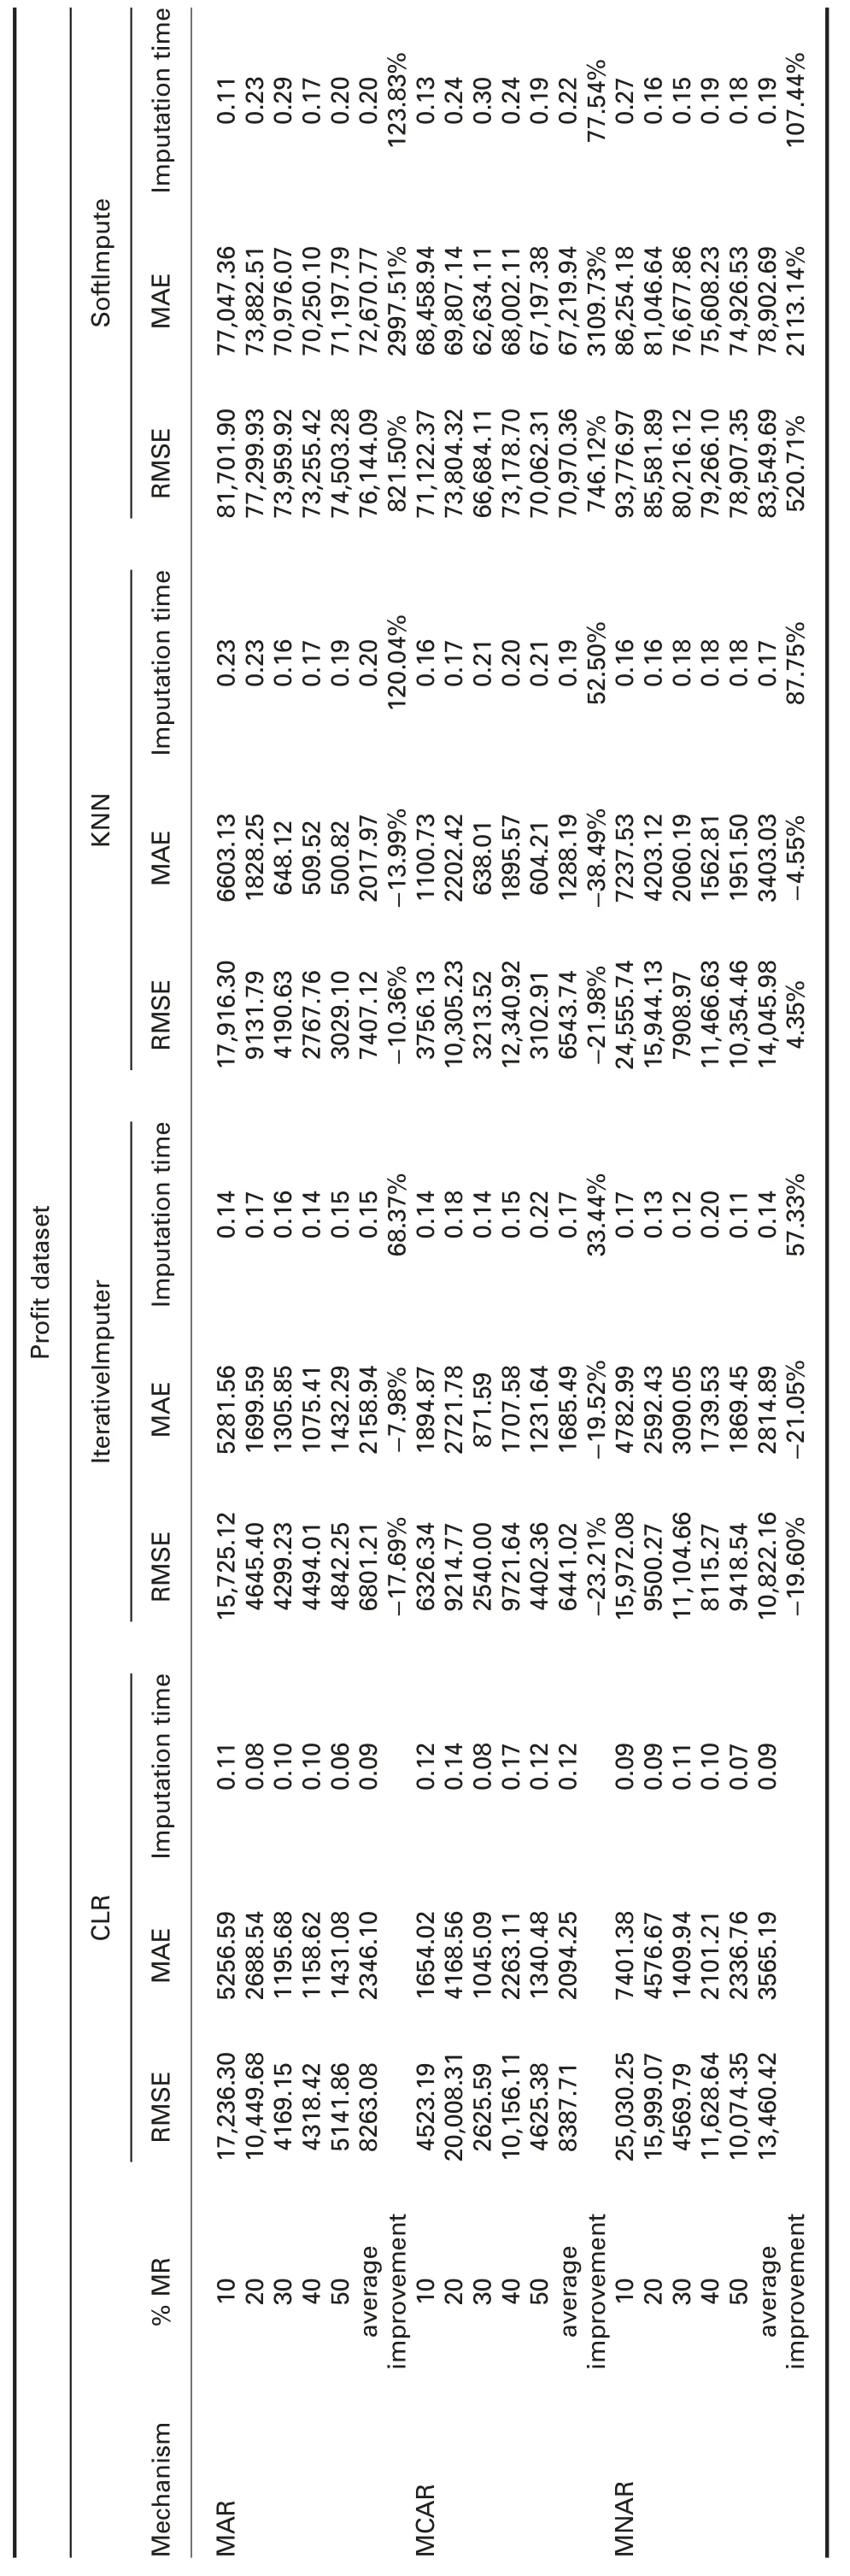


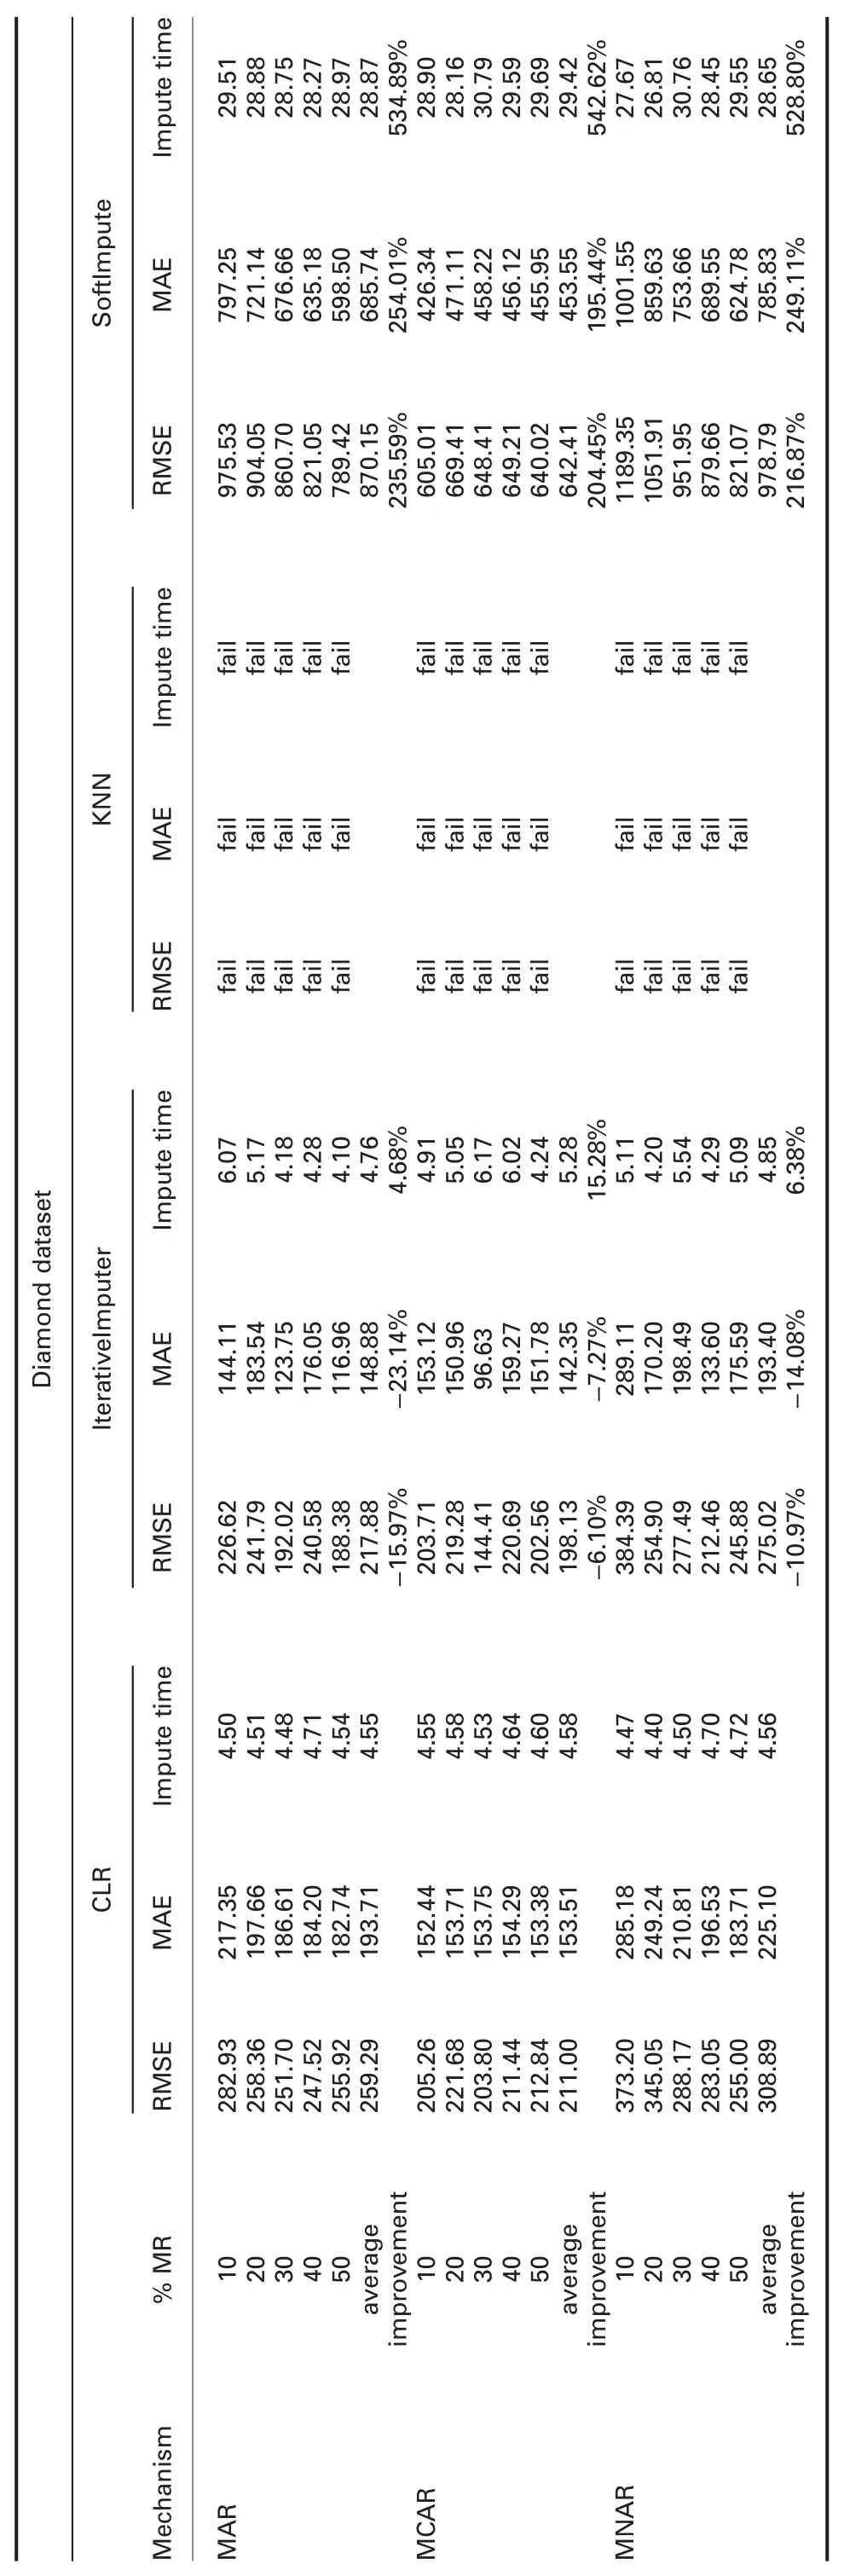

Table 6 R2(CLR versus R packages)
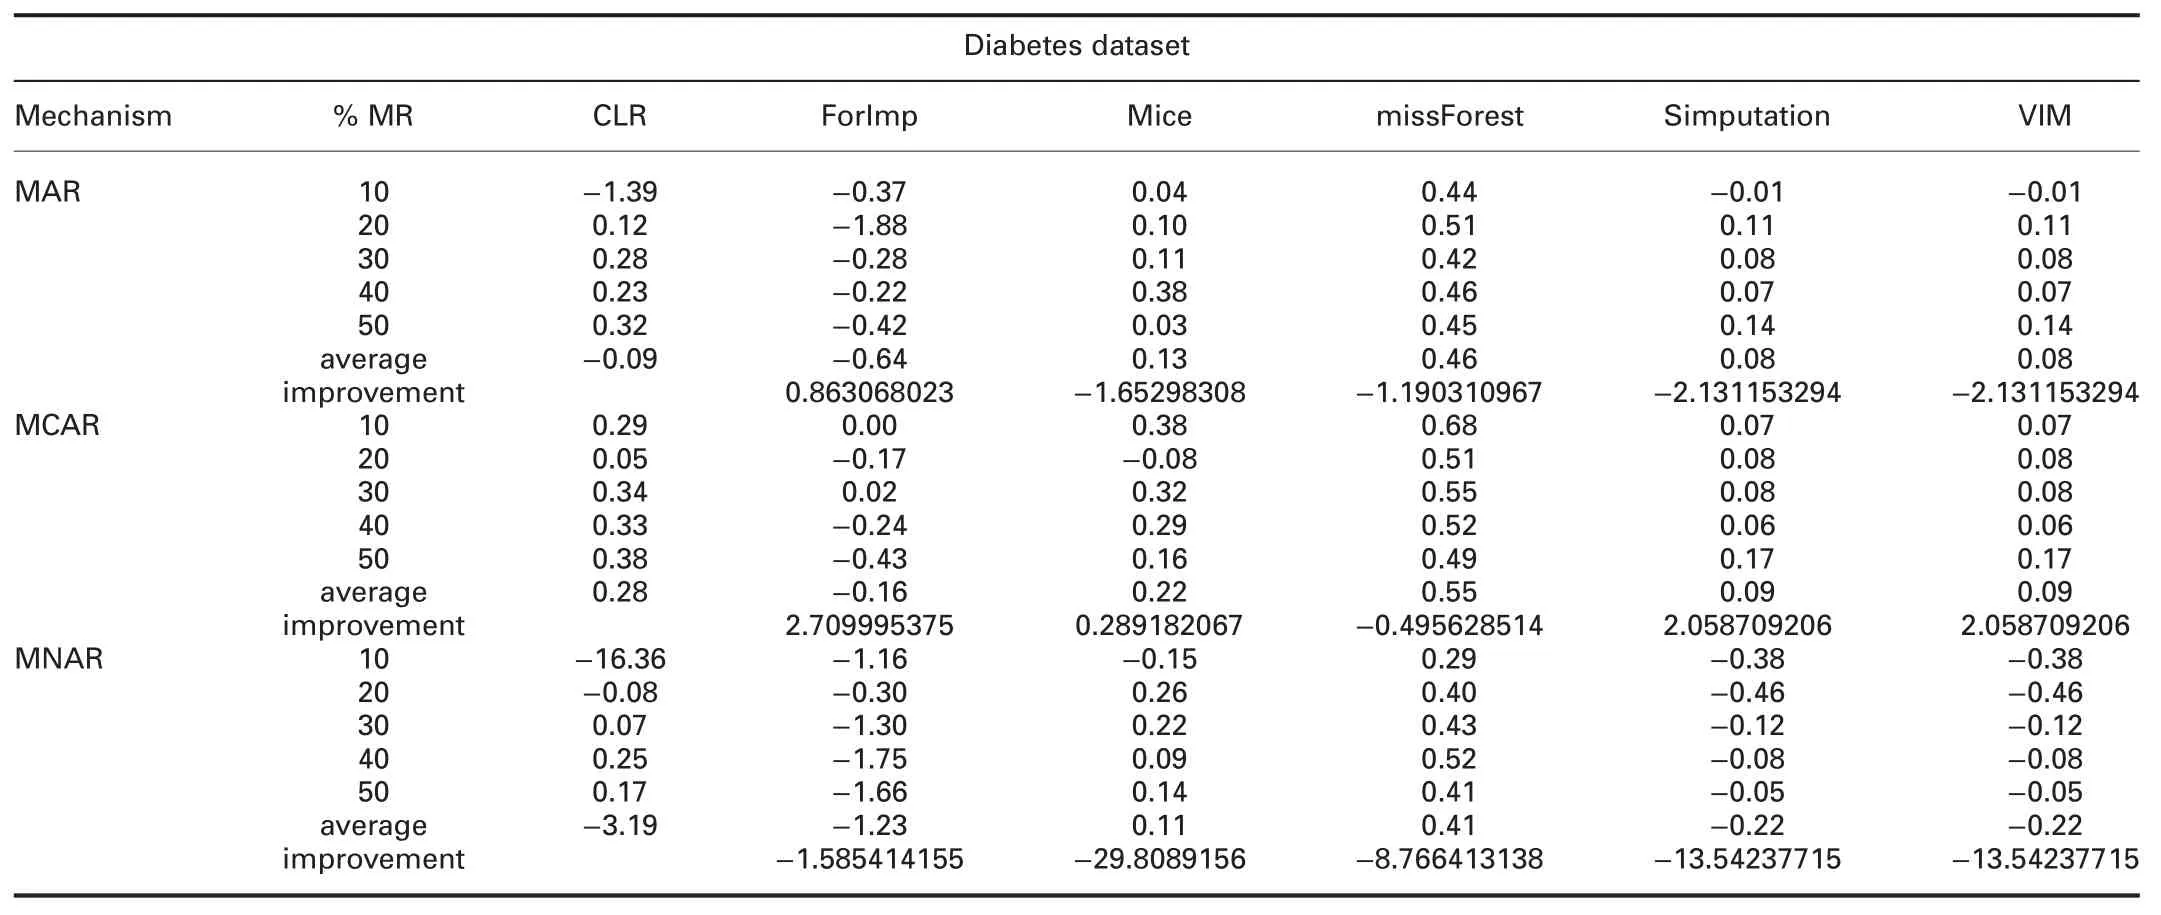
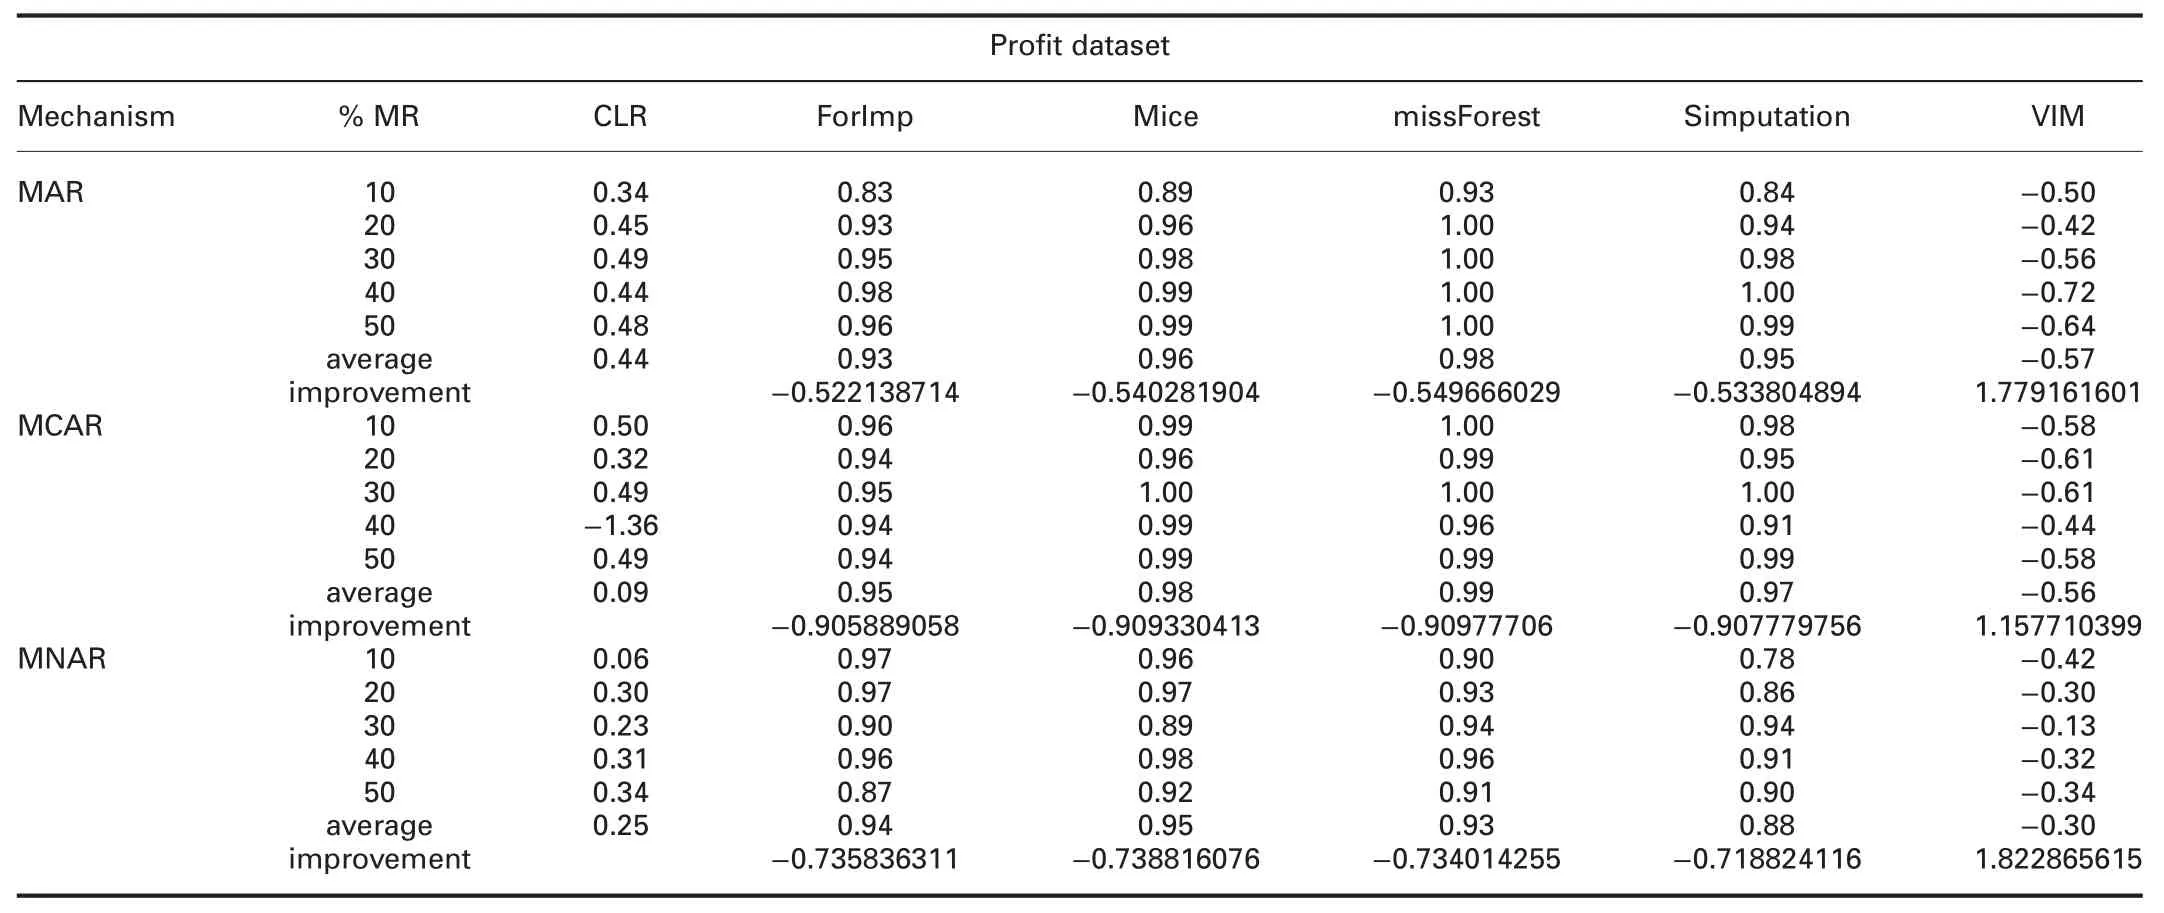

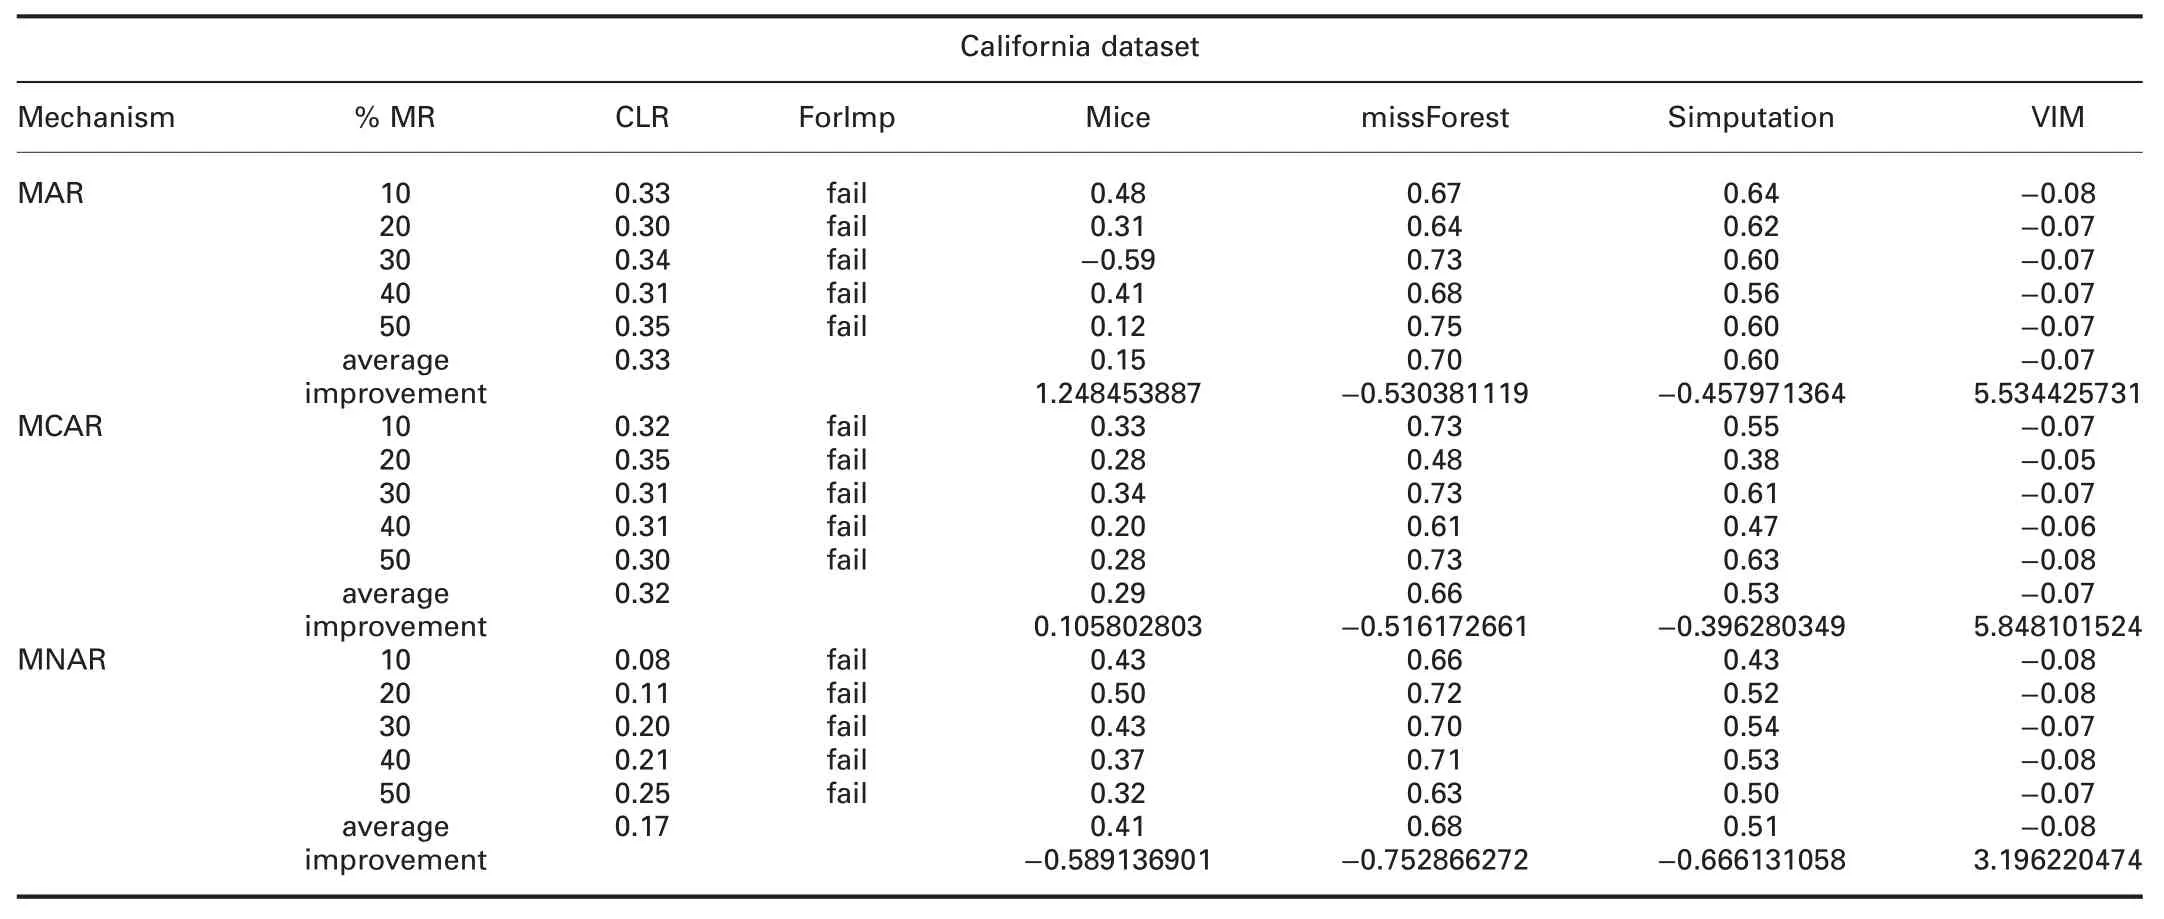
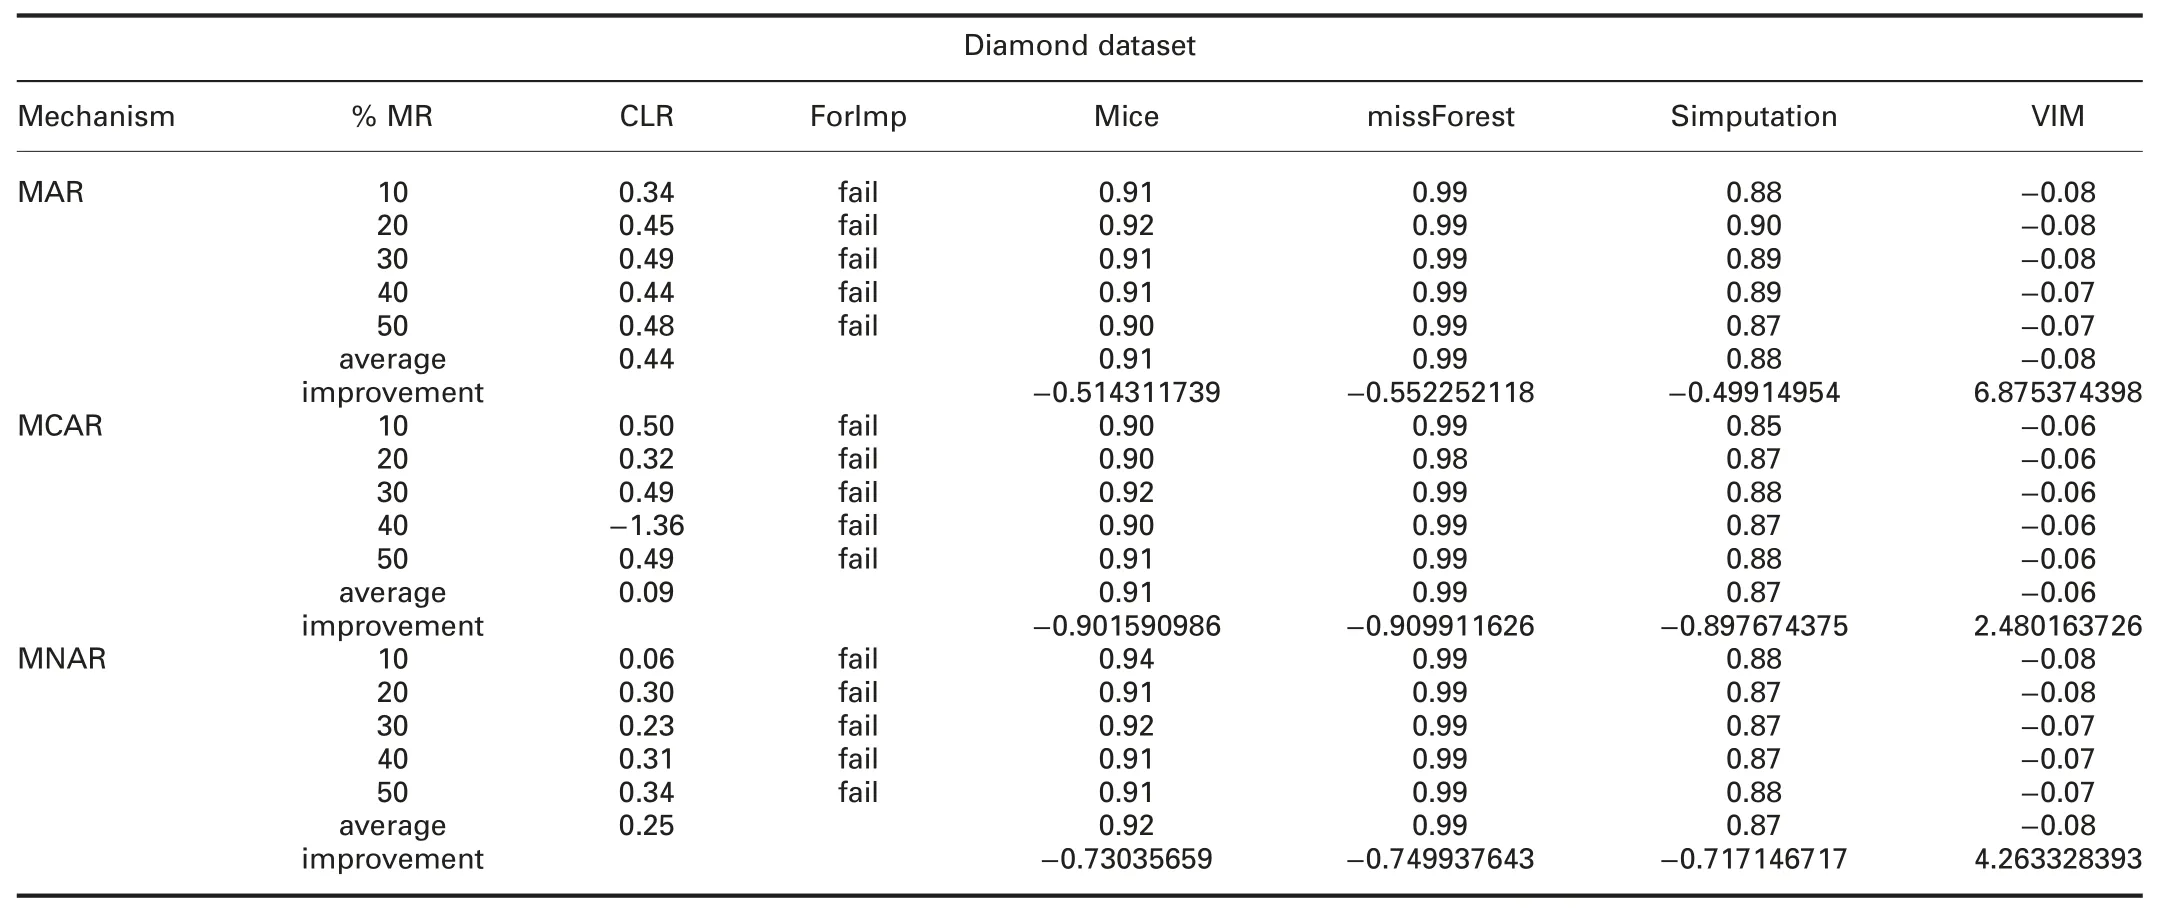
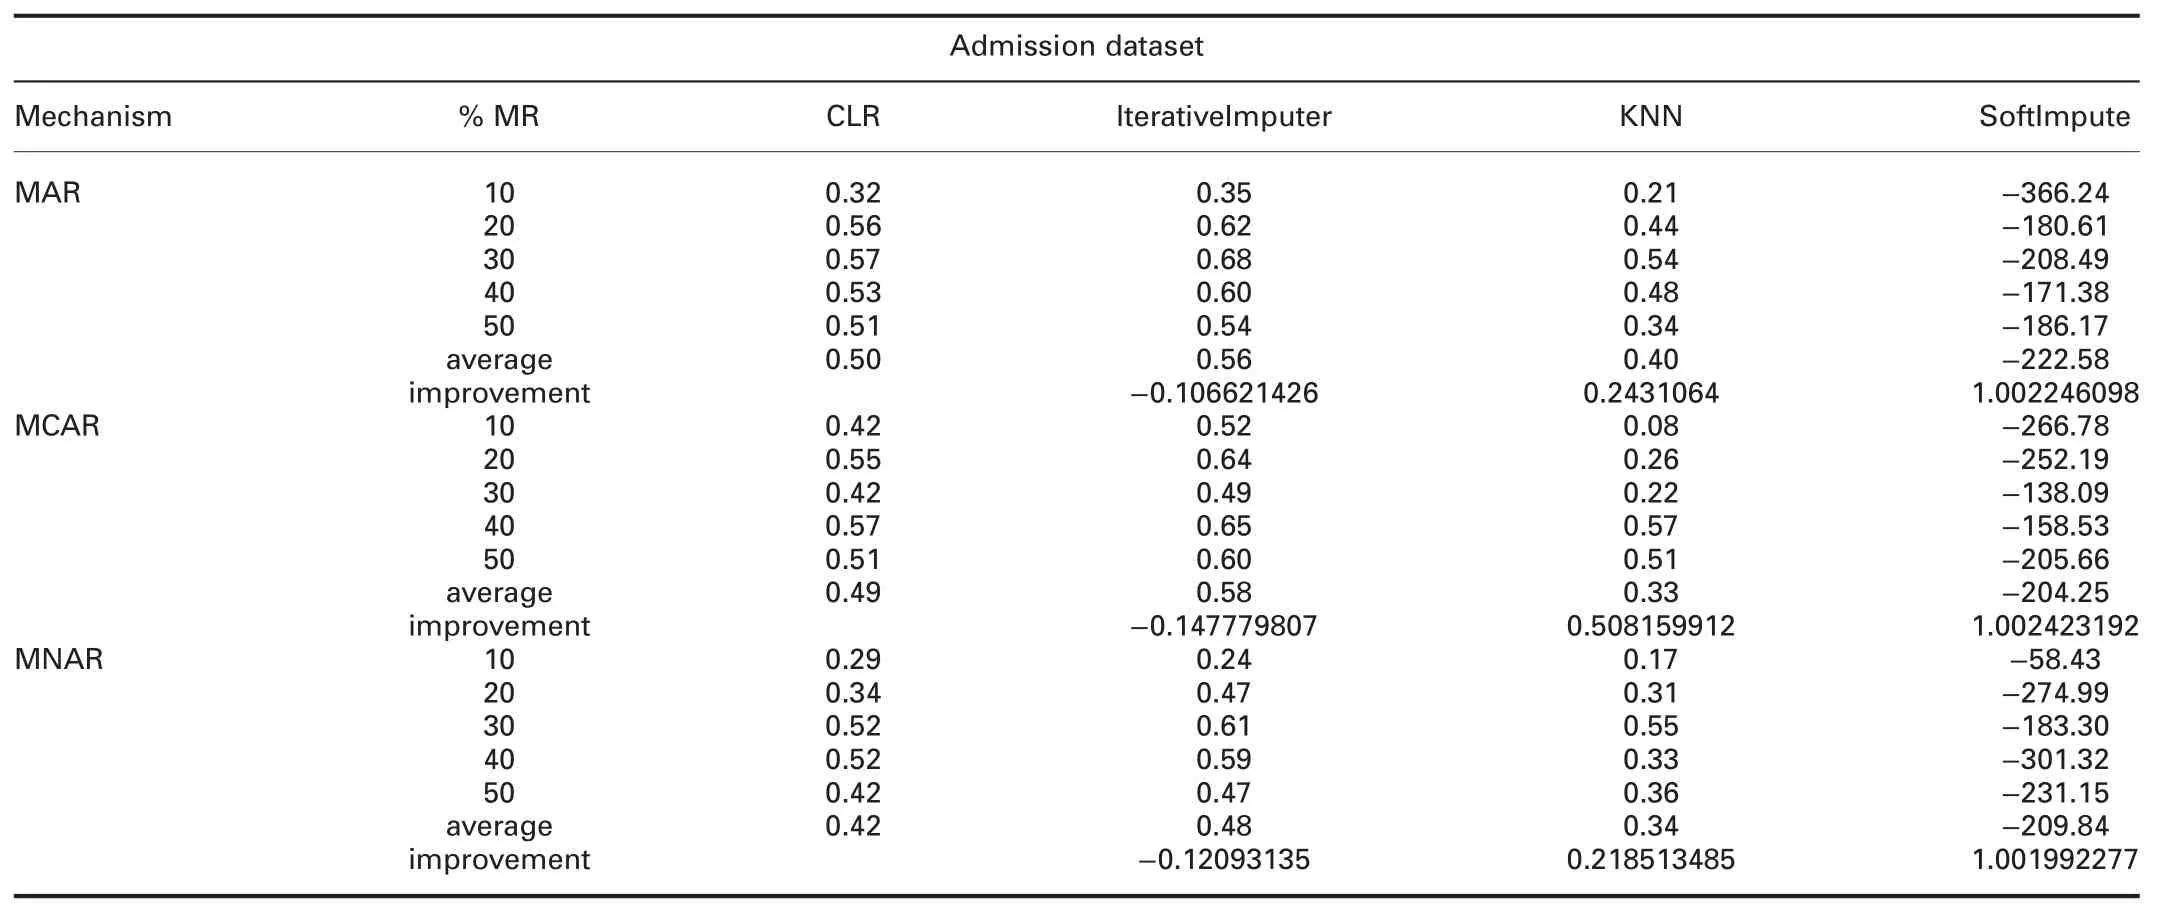
Table 7 R2(CLR versus Python packages)
?
???

?????
5 Conclusion,findings,and future work
The quality of the data has a significant impact on the statistical analysis.Dealing with missing values in the dataset is an important step in the data preprocessing stage.Therefore,it has magnitude weightiness in data analysis.In addition to providing an overview of the studies related to dealing with missing data,an imputation method has been proposed in this paper to improve the quality of the data by exploiting all available variables.Correlation between the variable of interest,which contains missing values,and the candidate variable,which will be used in the imputation,and the number of missing values in both of them are two important factors to be taken into account when choosing this candidate variable.The imputed variable will be a candidate variable for imputing another incomplete variable.The findings of the proposed method make it easy to implement,work with any dataset and does not fail in the imputation regardless of the size of the dataset or the missingness mechanism.However,the proposed method is not the optimum one,at worst;it behaves somewhat similar to the common methods.In future research avenues,the proposed imputation approach will be analysed in other datasets,other units of standard error (e.g.T-value and P-value) will be taken into consideration when selecting the candidate variable.The most important future trend is to take advantage of algorithms that deal with optimisation problems with mixed variables such as GSA-GA algorithm [40].
杂志排行

CAAI Transactions on Intelligence Technology的其它文章
- Multi-objective linear fractional inventory model with possibility and necessity constraints under generalised intuitionistic fuzzy set environment
- Advances on QoS-aware web service selection and composition with nature-inspired computing
- TLBO with variable weights applied to shop scheduling problems
- Expanded models of the project portfolio selection problem with learning effect
- Using NSGA-III for optimising biomedical ontology alignment
- Study on covering rough sets with topological methods