Logging interpretation method for reservoirs with complexpore structure in Mesozoic-Cenozoic faulted basinaround Daqing exploration area
2019-09-18YUEShanshanFANXiaominandHUANGBuzhou
YUE Shanshan, FAN Xiaomin and HUANG Buzhou
College of Geo-Exploration Science and Technology, Jilin University, Changchun 130026, China
Abstract: In Mesozoic-Cenozoic faulted basin in the periphery of Daqing exploration area, the clastic reservoirs mainly consist of siltstone and gravel-bearing sandstone. The electrical conductivity of the reservoirs is complicated due to the complex pore structures, which cannot be accurately interpreted with commonly used model. In order to solve the problem, a three-water model has been applied in this study based on in-depth analysis of the conductive mechanism of rocks in the explored area, and favorable application results are achieved.
Keywords: Daqing exploration area; Mesozoic-Cenozoic faulted basin; complex pore structures; cementation index; saturation index
0 Introduction
In the Mesozoic and Cenozoic faulted basin around Daqing exploration area, the clastic reservoirs mainly consist of siltstone and gravel-bearing sandstone. The conductive mechanism of the reservoir is complicated due to the complex pore structures. Over the past decades, many conductive models have been proposed by scholars at home and abroad. Waxman and Smits (1968) proposed a conductive model of coupled layer with additional conductivity related to the cation exchange ability of clay. Clavieretal. (1984) found that the conductivity of shaly sands is the result of parallel connection of clay water and free water, and proposed a dual-water electric conduction model. Based on the analysis of the existing conductive models and the formation mechanism of low resistivity reservoirs and the factors affecting their properties, Mo (1998) proposed a three-water model consisting of paralleled free water, micro capillary pore water and clay water conduction paths. The three-water model can well describe the electrical characteristics of low resistivity reservoirs and low porosity and permeability reservoirs by comprehensively analyzing the complex conductivity characteristics of rocks. Zhaoetal. (2004) applied the three-water model to logging evaluation of complex reservoirs in Daqing oil field. Jiang (2009) applied the three-water model to logging interpretation for low resistivity reservoirs in the Northern Gulong area of Daqing oilfield. They all achieved sound effect. Based on the analysis of the complex conductive mechanism of rocks, it is suggested that the development of micro pore is the reason for the complex conductive mechanism of rocks in this area. A batch of rock samples were selected for rock electricity experiments in this area. Based on the three-water model, we analyzed the changing trend of model parameters with experiment data in order to give the optimum free pore cementation index, micro capillary cementation index and saturation index. Finally, the model was applied in this area. The results showed that the model and its parameter selection method are suitable for logging evaluation in this area.
1 Overview of three-water model
Using the traditional volume model, the three-water model takes the total conductance of rock as the parallel connection of free water, micro capillary water and clay water (Mo, 1998; Li & Mo, 1999).
As formation water in micro capillary and clay cannot flow, hydrocarbon can only enter free water pore, the proportion of hydrocarbon substitution inφfis set asSwf.
The resistivity of rock can be considered as the resistivity formed by three kinds of pore in parallel. When the pores are filled with water:
(1)
WhereR0represents rock resistance,Rf0represents free fluid pore network resistance,Rc0represents clay water network resistance, andRi0represents micro capillary network resistance. Assuming that the resistivity of each part satisfies Archie’s formula, formula (1) is expressed as:
(2)
WhereFf,FiandFcrepresent formation factors of free fluid pore space, micro pore space and clay water pore respectively.Rwfrepresents free water resistivity,Rwcrepresents clay water resistivity, andRwirepresents micro capillary water resistivity.
Assuming that the proportions of the three porosities to the volume of rock areφf,φIandφcrespectively and the cementation indexes aremf,miandmc. According to the previous discussion, it has been known that the conductivity of water in free fluid pore is the same as that of water in micro capillary, only clay water is different. So formula (2) can be written in the following form:
(3)
When containing hydrocarbon, micro capillary water and clay pore water is not flowable in terms of permeability, so hydrocarbon replaces free water pore space. Suppose that the proportion of water in the pore space of free fluid isSwf, the saturation index isn, formula (3) is expressed as:
(4)
The relationship between the total water saturationSwandSwfis then established from well log interpretation as:
(5)
The value ofmf,mi,mcandnare approximate to the value of 1.8--2.3. Due to the geometric factors of conductive pathways of three kinds of pore water are different, somf,miandmcshould be different.
Therefore, considering the difference of conductive pathway and conductivity among free water, micro capillary water and clay water, the three-water model treats them separately in conductive model. It not only takes into account the unique conductive characteristics of clay water, but also takes into account the important influence of micro capillary water on rock resistivity, and comprehensively summarizes several different conductive mechanisms of rocks. The three-water model which involves many parameters is difficult to obtain. Defining the parameters appropriately is the key to the reliability of logging interpretation results.
2 Determination of cementation index and saturation index
2.1 Determination of free pore cementation index
21 samples are selected, with porosity and permeability over 15% and 50 mD respectively. The samples mainly comprise free pore, with less micro capillary pore and clay water pore. In the case of low precision requirement, the cementation indexmandaobtained can be used as free pore cementation indexmanda. Formation factorFis calculated using Archie formula and is cross-plotted withφ(Fig.1a). Corresponding free pore cementation indexmandaare then calculated on the basis of the least square method.
A small amount of shale exists in the pore of the selected rock samples, which will affect the electric conduction via additional conductivity and changing the pore structure. After correcting these two factors, the electrical conductivity of the rocks is consistent with that of pure sandstone. Only then can the true cementation indexmandain free pore be obtained. Since some parameters of the three-water conductivity model have not yet been determined, the widely used W-S (Waxman and Smits) model and the dual-water model are used for shale correction in this paper.
2.1.1 Shale correction with W-S model
W-S model suggests that when porosity, pore curvature and water saturation are the same, shaly sands and pure sandstone have the same electrical conductivity (Waxman & Smits, 1968). The conductivity of formation water is due to the additional conductivity caused by cation exchange on the surface of clay particles. The conductive equation is:
(6)
(7)
WhereF*represents the cementation index of pure sandstone with the same porosity, pore flexure and water saturation as rock samples. According to the above formulas we can get the value ofF*and make a cross-plot with porosityφ(Fig.1b).
In Fig.1b, the values ofmandaobtained by least squares regression are 1.771 6 and 2.095 3, respectively. We calculated the formation factors and compared them with the actual formation factors and found that the average absolute error is 2.45 and the average relative error is 8%. Compared with the value ofabefore correction, the correctedadeviates further from theoretical value 1. Similarly, the correctedmdeviates further from the theoretical value 2 than the pre-correctedm, and the correlation decreases, which is inconsistent with the expected results. Takingaas 1,mis selected according to the formation factors corrected by W-S model, so that the average relative error between the calculated formation factors and the formation factors corrected by W-S model reaches the minimum. We found that the best result is reached when m is 2.28, while average absolute error is 2.96 and average relative error is 10.5%. However, the cementation indexmandaobtained are still affected by the shale in the samples, but the effect is due to the larger pore curvature caused by the shale, rather than the additional conductivity of the shale to the cementation index. In order to eliminate this effect, we takeaas 1 to get the correspondingmvalue and cross-plot with the shale content (Fig.2a).

(a) With no correction; (b) corrected by W-S model; (c) corrected by dual-water model.Fig.1 Relationship between porosity and formation factor in different conditions

(a) Corrected by W-S model (a=1); (b) corrected by W-S model (a=2.095 3); (c) corrected by dual-water model (a=1).Fig.2 Relationship between shale content and free pore cementation index
If we make shale content zero, the value ofmis 2.406 4 after shale content correction. In Fig.2a, it can be found thatmincreases with the decrease ofVsh. According to the W-S model, when shale contentVshdecreases, pore curvature becomes smaller and the correspondingmshould also be reduced, butmincreases in the actual process, which contradicts the theoretical analysis. Considering the large deviation betweenmin Fig.2a and Fig.1b, it may indicate that themcorrected by W-S model cannot reflect the actual change, and then the relationship betweenmand shale content may be contradictory to the theoretical analysis.
In order to confirm the above analysis, we takeavalue as 2.095 3, and then obtain the correspondingm. The cross-plot betweenmand the shale content is shown in Fig.2b.
We made the shale content value zero,mvalue is 1.776 5. At the time, themvalue decreases with the decrease of the shale contentVsh. This relationship is consistent with the theoretical analysis. It can be seen from this point that whenais taken as a fixed value 1 in W-S model, the obtainedmvalue may not reflect the actual change, and then the relationship betweenmvalue and shale content may be contradictory to the theoretical analysis.
2.1.2 Shale correction with dual-water model
Dual-water model suggests that the double electric layers on the surface of clay particles result in the desalination effect on the surface of the particles, which makes the clay water on the surface of the particles salt-free and non-conductive (Clavieretal., 1984). This is different from the W-S model which considers that clay water has the same conductivity as external water. Its conductive equation is:
(8)
The dual-water model considers the conductivity of "far" water and clay (near water) as equivalent formation water conductivity according to volume effect, which is then divided by the formation factors to get conductivity of water-saturated rocks. Therefore, the formation factors here are consistent with those of pure sandstone with the same porosity, pore curvature and water saturation. According to the core analysis data and the formulas above, we can getF0and cross-plot with porosityφ(Fig.1c).
According to least squares regression, the values ofmandacan be obtained from the cross-plot, which are 2.300 2 and 1.002 1, respectively. Compared the formation factors calculated withmandaobtained with actual formation factors, the corrected value ofais closer to the theoretical value of 1 than before and the corrected value ofmis near the theoretical value of 2. Meanwhile, the correlation is improved, which is consistent with the expected results.
However, the cementation indexes obtained are still affected by the shale in the rock samples, which makes the pore curvature bigger (Huangetal., 2009). In order to eliminate this effect, we takeaas 1, and then get the correspondingmvalue. Themvalue and the shale content are cross-plotted (Fig.2c). If the shale content is zero, we can get themvalue of 2.264. Themvalue decreases with the decrease of shale contentVsh, which is consistent with the theoretical analysis. Considering the small difference between themvalues of Fig.1c and Fig.2c, themvalues of both are consistent.
To sum up, it is indicated that the values ofmandacorrected by W-S model deviate more from the theoretical values than before, while the values ofmandacorrected by dual-water model are closer to the theoretical values than before. Therefore, the values ofmandacorrected by the dual-water model are taken as the final free pore cementation indexmanda, which are 2.264 and 1 respectively.
2.2 Determination of micro pore cementation index
In this paper, oil-saturated method was adopted to calculate micro pore cementation indexm. Oil-saturated method means that when oil and gas fill the free pore of the whole rock, there are only micro pore and clay water pore left in the rock. If we take oil and gas as rock matrix, the whole rock contains only micro pore and clay water pore, and then W-S model or dual-water model is used to correct the additional conductivity of clay, and the cementation indexmof micro pore can be obtained. Sometimes the minimum water saturation achieved by rock electrical analysis is much larger than the irreducible water saturation, which makes it unreliable to return to the saturation of irreducible water. Therefore this kind of data is not adopted. According to this principle, 10 rock samples with reliable data were selected and the resistivity increase rate was calculated when gas has filled rock sample and only bound water pore is left, and the correspondingCwiwas then calculated.
According to W-S model, oil and gas in free pore is taken as rock matrix, the influence of oil and gas entering on conductivity of clay can be ignored, so we can get:
(9)

Similarly, according to the dual-water model, the oil and gas in the free pore is regarded as the rock matrix, so the influence of oil and gas entering on the conductivity of clay is not considered, so we can also get:
(10)

(a) Corrected by W-S model; (b) corrected by dual-water model.Fig.3 Relationship between porosity and corrected formation factor using oil-saturated method with different models
So, the porosity corresponding toFwi0becomesφ*Swi. According to the above conductivity equation, the corrected formation factorsFwi0can be calculated and cross-plotted with porosityφ*Swi(Fig.3b). The micro capillary cementation indexmandacorrected by the dual-water model can then be calculated, which are 2.393 1 and 0.473 8, respectively. Takingaas fixed value 1,mis 2.14 according to the principle of minimum average error.
From the cross-plotting of formation factors after correction of the two models, as shown in Fig.4, it indicates that the correlation between the two calculated formation factors is good, and the correlation coefficient reaches 0.986 4. Only in some places, the formation factor obtained after the correction of the dual-water model is much bigger than that obtained after the correction of the W-S model. Based on the formation factor corrected by W-S model, the average absolute error is 24.25 and the average relative error is 4.5%.
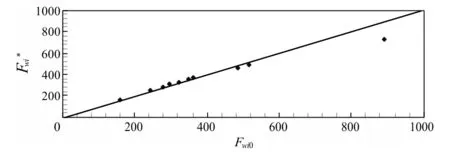
Fig.4 Cross-plot of formation factors corrected by W-S model and dual-water model
Since the difference of formation factors between the two models is small, whenais fixed at 1, the difference of micro pore cementation indexmbetween the two models is very small, i.e., 2.11 and 2.14. Therefore, the average of these two methods is taken as the micro capillary cementation indexmwhich is 2.125 obtained by oil-saturated method. From this, the micro capillary pore index valuesaandmwith oil-saturated method can be obtained, which are 1 and 2.125 respectively.
2.3 Determination of Saturation Index
In order to determine saturation indexnandb, 26 rock samples were tested for rock electricity experiment of water-oil displacement (Table 1). The resistivity indexesIand water saturationSwfrom these 26 samples were cross-plotted (Fig.5). According to the principle of least square method, the values ofnandbare obtained as 1.916 2 and 0.951 6 respectively. In this case, according to the principle of minimum mean absolute error, the value ofnis 1.869.
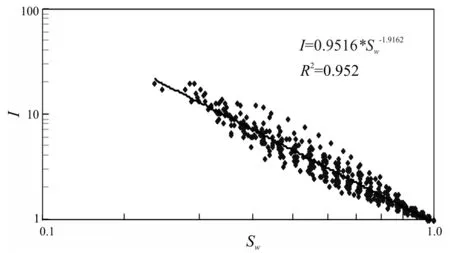
Fig.5 Relationship between resistivity index and water saturation
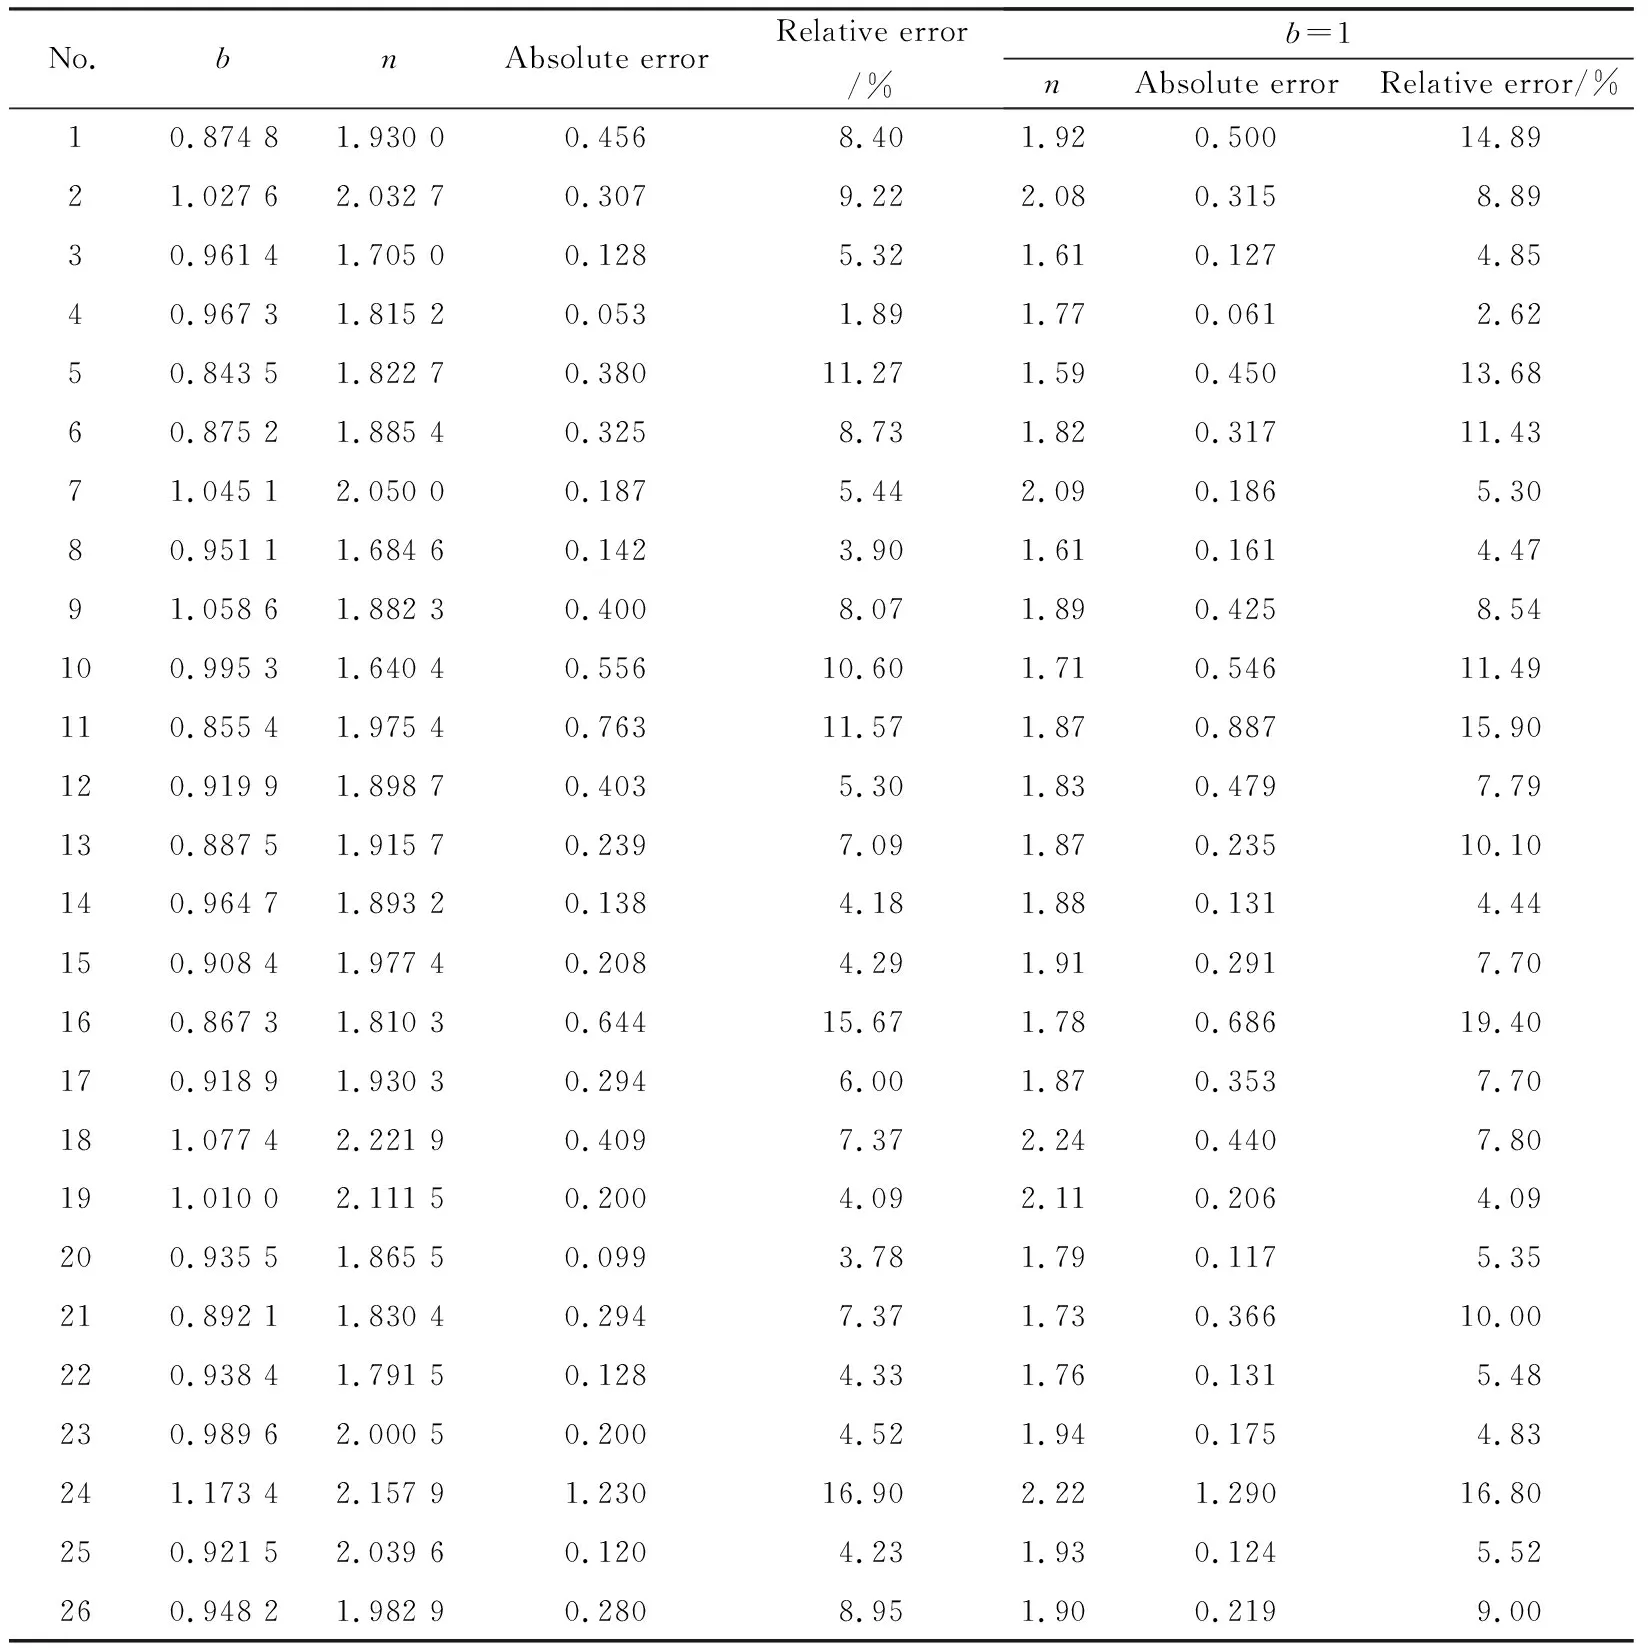
Table 1 Saturation indexes of 26 rock samples
3 Calculation results of three-water model
On the basis of accurately determined reservoir parameters, the three-water model is used to process and interpret some mis-interpreted wells using conventional method in the research area, and compare the processing results with the test data. In Fig.6, PORT represents total porosity, PORM represents micro porosity, PORC represents clay porosity, SWB represents bound water saturation, SW represents water saturation, PERM represents permeability, SH represents shale content, VCL represents clay content, and PORE represents effective porosity. Fig.6a shows the processing result of section A of a well in Daqing. According to the oil and gas indication in the figure and the difference of neutron and density, 770--800 m is interpreted as gas-bearing water zone, which is consistent with that of interpretation of oil test. Fig.6b is the processing result of section B of a well in Daqing. According to the oil and gas display in the figure and the difference of neutron and density, 1 200--1 300 m is interpreted as gas-water layer, which is consistent with oil test. It can be seen that this method can effectively identify shaly sand reservoirs with complex pore structure, and is superior to conventional interpretation model.
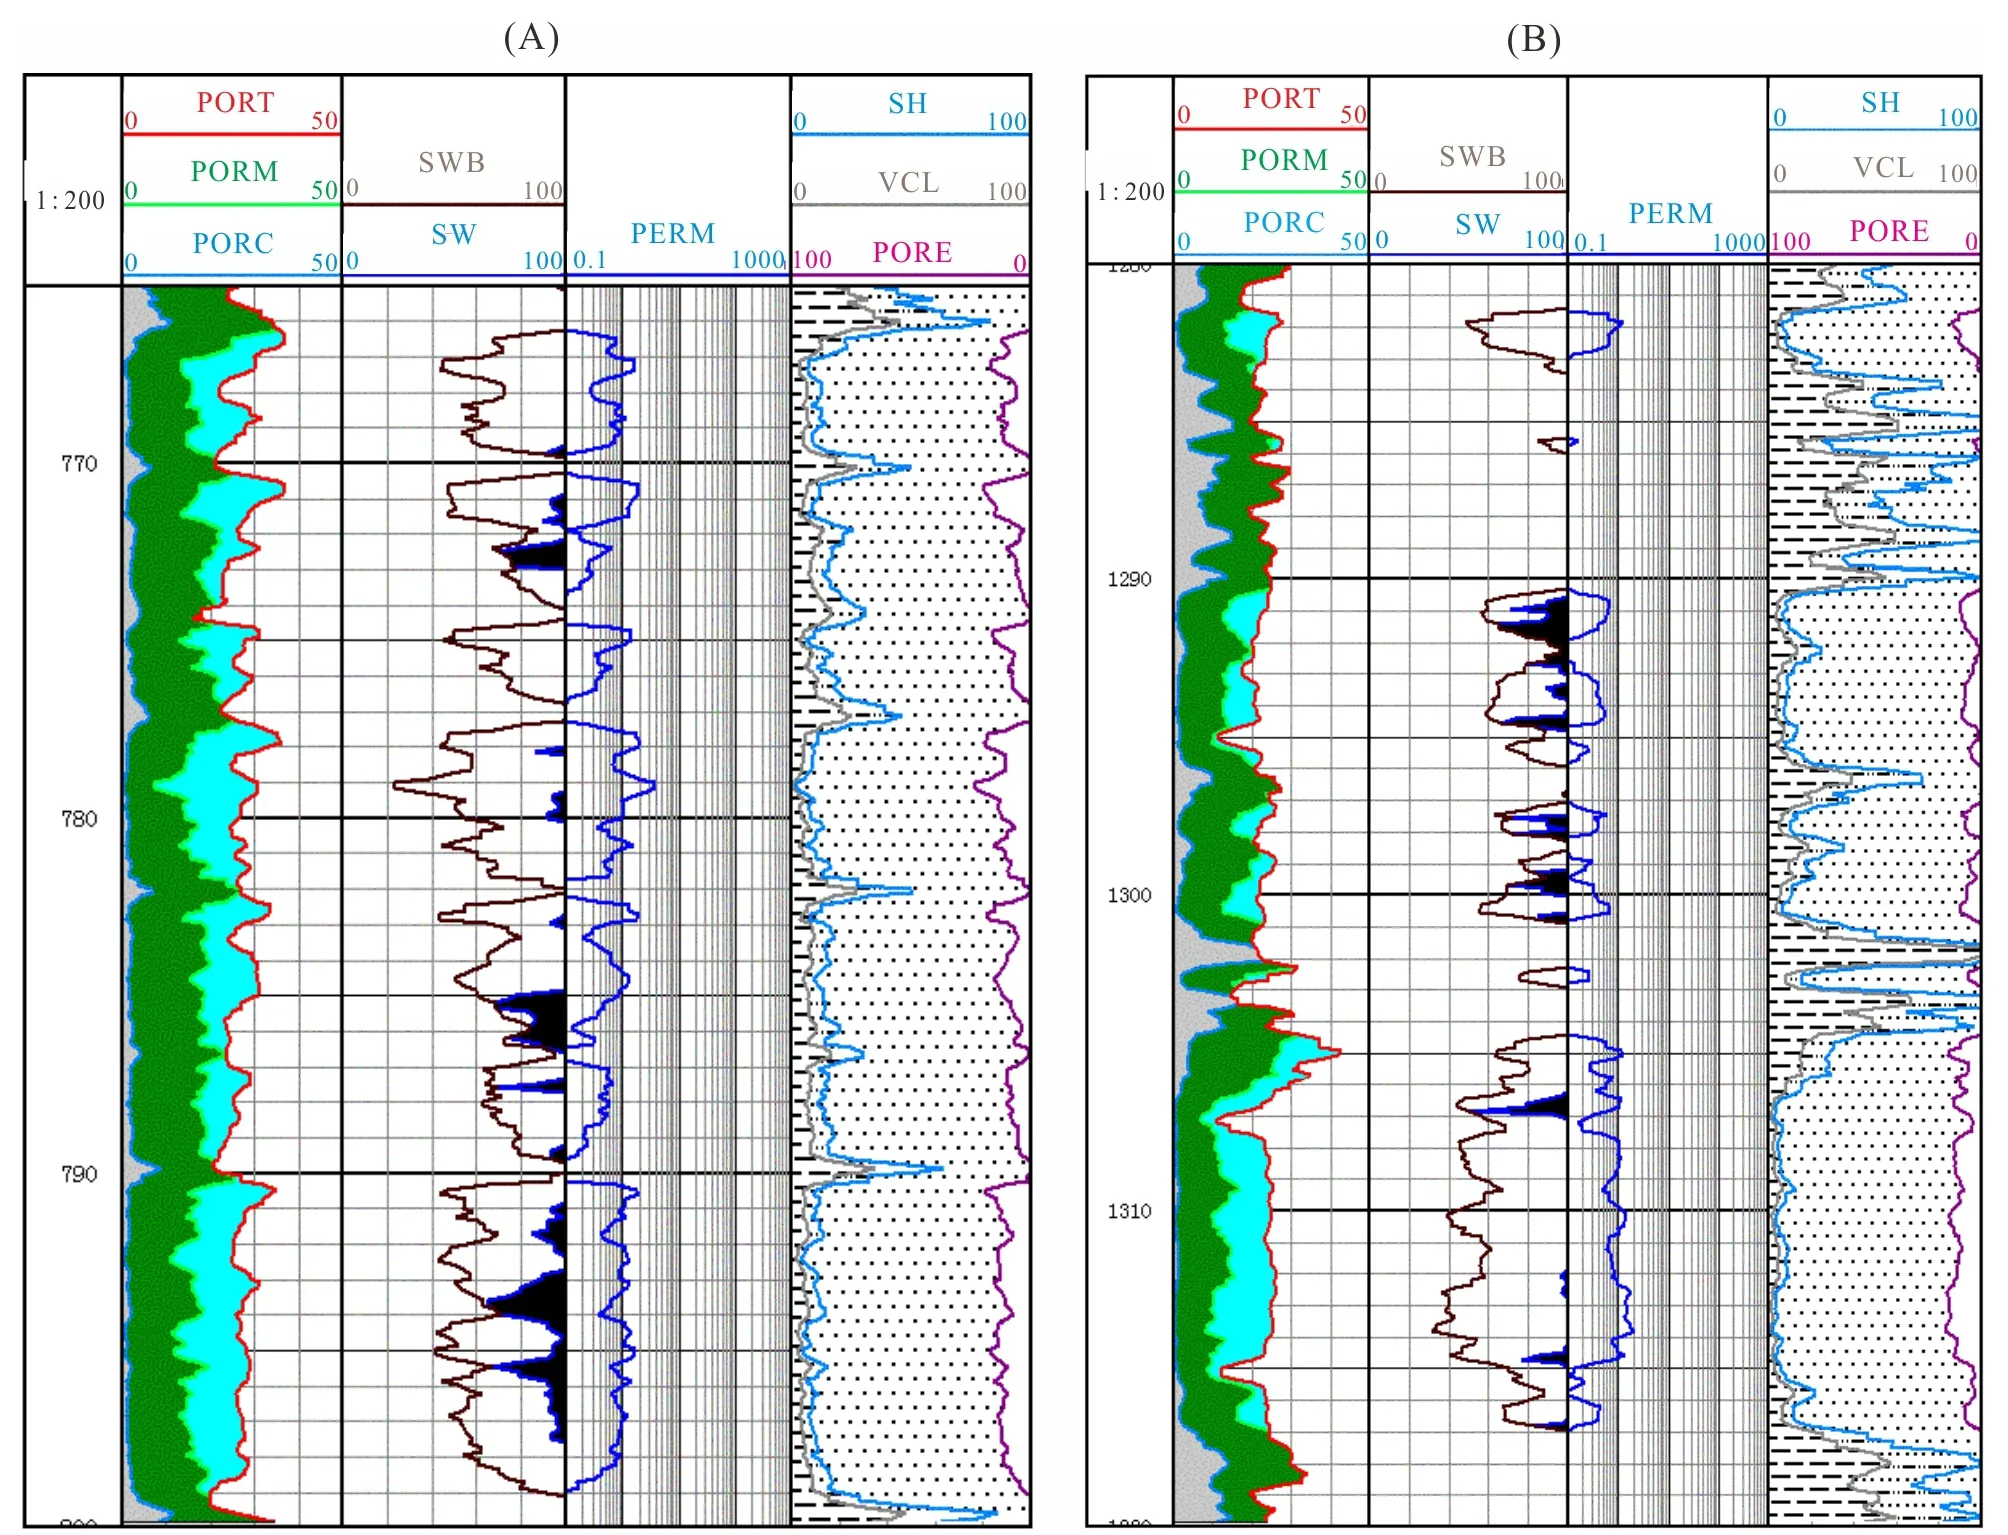
Fig.6 Processing result diagrams for section (A) and section (B) in some wells in Daqing oil field
4 Conclusions
Based on the thorough analysis of conductive mechanism of shaly sands and optimizing of model parameters, the three-water model is used to deal with the periphery of Daqing exploration area. The following conclusions are reached in this study:
(1)It is proved that the following model parameter methods used in this paper is effective for reservoirs in the research area: free pore cementation index is obtained by regression of porosity and formation factors after additional conductivity correction with dual-water model; the micro capillary pore cementation index is obtained by regression of formation factors corrected and porosity with oil-saturated method; the saturation index is obtained by regression between resistivity indexIand water saturationSwobtained from rock electricity experiment of water-oil displacement.
(2)The three-water model is applied to the reservoirs with complex pore structure in the periphery of Daqing exploration area. The application results show that the model is superior to the conventional model and indeed improves the identification of oil, gas and water.
杂志排行
Global Geology的其它文章
- Zircon U-Pb geochronology and geochemistry ofgranite in Huoluotai area of northern Great Hinggan Range
- Identification model of geochemical anomaly basedon isolation forest algorithm
- Structural mechanism and construction method of mud andwater inrush in Xiangyun tunnel of Guangtong-Dali railway
- Regularized focusing inversion for large-scalegravity data based on GPU parallel computing
- Slope reliability analysis based onMonte Carlo simulation and sparse grid method
- Mode decomposition methods and their application inground penetrating radar data processing
