Identification model of geochemical anomaly basedon isolation forest algorithm
2019-09-18SHANGYinminLULaijunandKANGQiankun
SHANG Yinmin, LU Laijun and KANG Qiankun
College of Earth Sciences,Jilin University, Changchun 130061, China
Abstract: The methods for geochemical anomaly detection are usually based on statistical models, and it needs to assume that the sample population satisfies a specific distribution, which may reduce the performance of geochemical anomaly detection. In this paper, the isolation forest model is used to detect geochemical anomalies and it does not require geochemical data to satisfy a particular distribution. By constructing a tree to traverse the average path length of all data, anomaly scores are used to characterize the anomaly and background fields, and the optimal threshold is selected to identify geochemical anomalies. Taking 1∶200 000 geochemical exploration data of Fusong area in Jilin Province, NE China as an example, Fe2O3 and Pb were selected as the indicator elements to identify geochemical anomalies, and the results were compared with traditional statistical methods. The results show that the isolation forest model can effectively identify univariate geochemical anomalies, and the identified anomalies results have significant spatial correlation with known mine locations. Moreover, it can identify both high value anomalies and weak anomalies.
Keywords: isolation forest model; geochemical anomaly; ROC curve; Youden index
0 Introduction
Geochemistry is one of important methods in mineral exploration. Geochemical anomaly identification is the core of geochemical exploration. In recent years, scholars have proposed various geochemical methods to obtain the lower cutoff of anomalies. The traditional method of obtaining the lower cutoff of anomalies is mainly based on the traditional statistical principle. Assuming that the geochemical data obeys the normal distribution or the lognormal distribution, and the anomalies limit is determined by calculating the statistical parameters of the data. For example, traditional statistical method (Galuszka, 2007; Hawkes & Webb, 1962) and univariate analysis (Singer & Kouda, 2001) are used to deal with Gaussian distribution data, while multivariate data analysis (Geranianetal., 2015) handle multivariate Gaussian distribution data, and the processing methods follow power-law distribution analyze fractal and multi-fractal data (Dengetal., 2010; Li & Cheng, 2004; Luzetal., 2014). According to Chen & An (2016), when the geochemical data in the actual measurement does not satisfy the assumption of normal distribution, good results can still be obtained by detecting geochemical anomalies in the interpolated elements data. In this paper, the isolation forest algorithm is chosen to establish a model, and univariate geochemical anomaly identification is performed from the interpolated element data with unknown distribution.
Isolation forest is a member of random forest family, so both random and isolation forest are composed of large number of decision trees. Isolation forest is a model based on similarity. The number of hyperplanes needed to calculate “isolated” samples is obtained by randomly dividing the hyperplanes. To isolate one sample in a high-density space, it needs many cuts. On the contrary, samples with low density often stay in one subspace (Liuetal., 2008). Since some content values of geochemical elements for geochemical anomalies are often different from the background field of the elements in the region, geochemical anomalies can be distinguished by constructing isolation forest model for selected geochemical elements (Wu & Chen, 2018). This paper takes the soil geochemical data of Fusong area in Baishan City, Jilin Province as an example. Based on the proven mineralization information of the area, the geochemical indicator elements are selected to build a model based on the isolation forest algorithm, and the model is then applied to the geochemical anomaly detection. The Youden index determines the optimal threshold to identify and extract elemental anomalies.

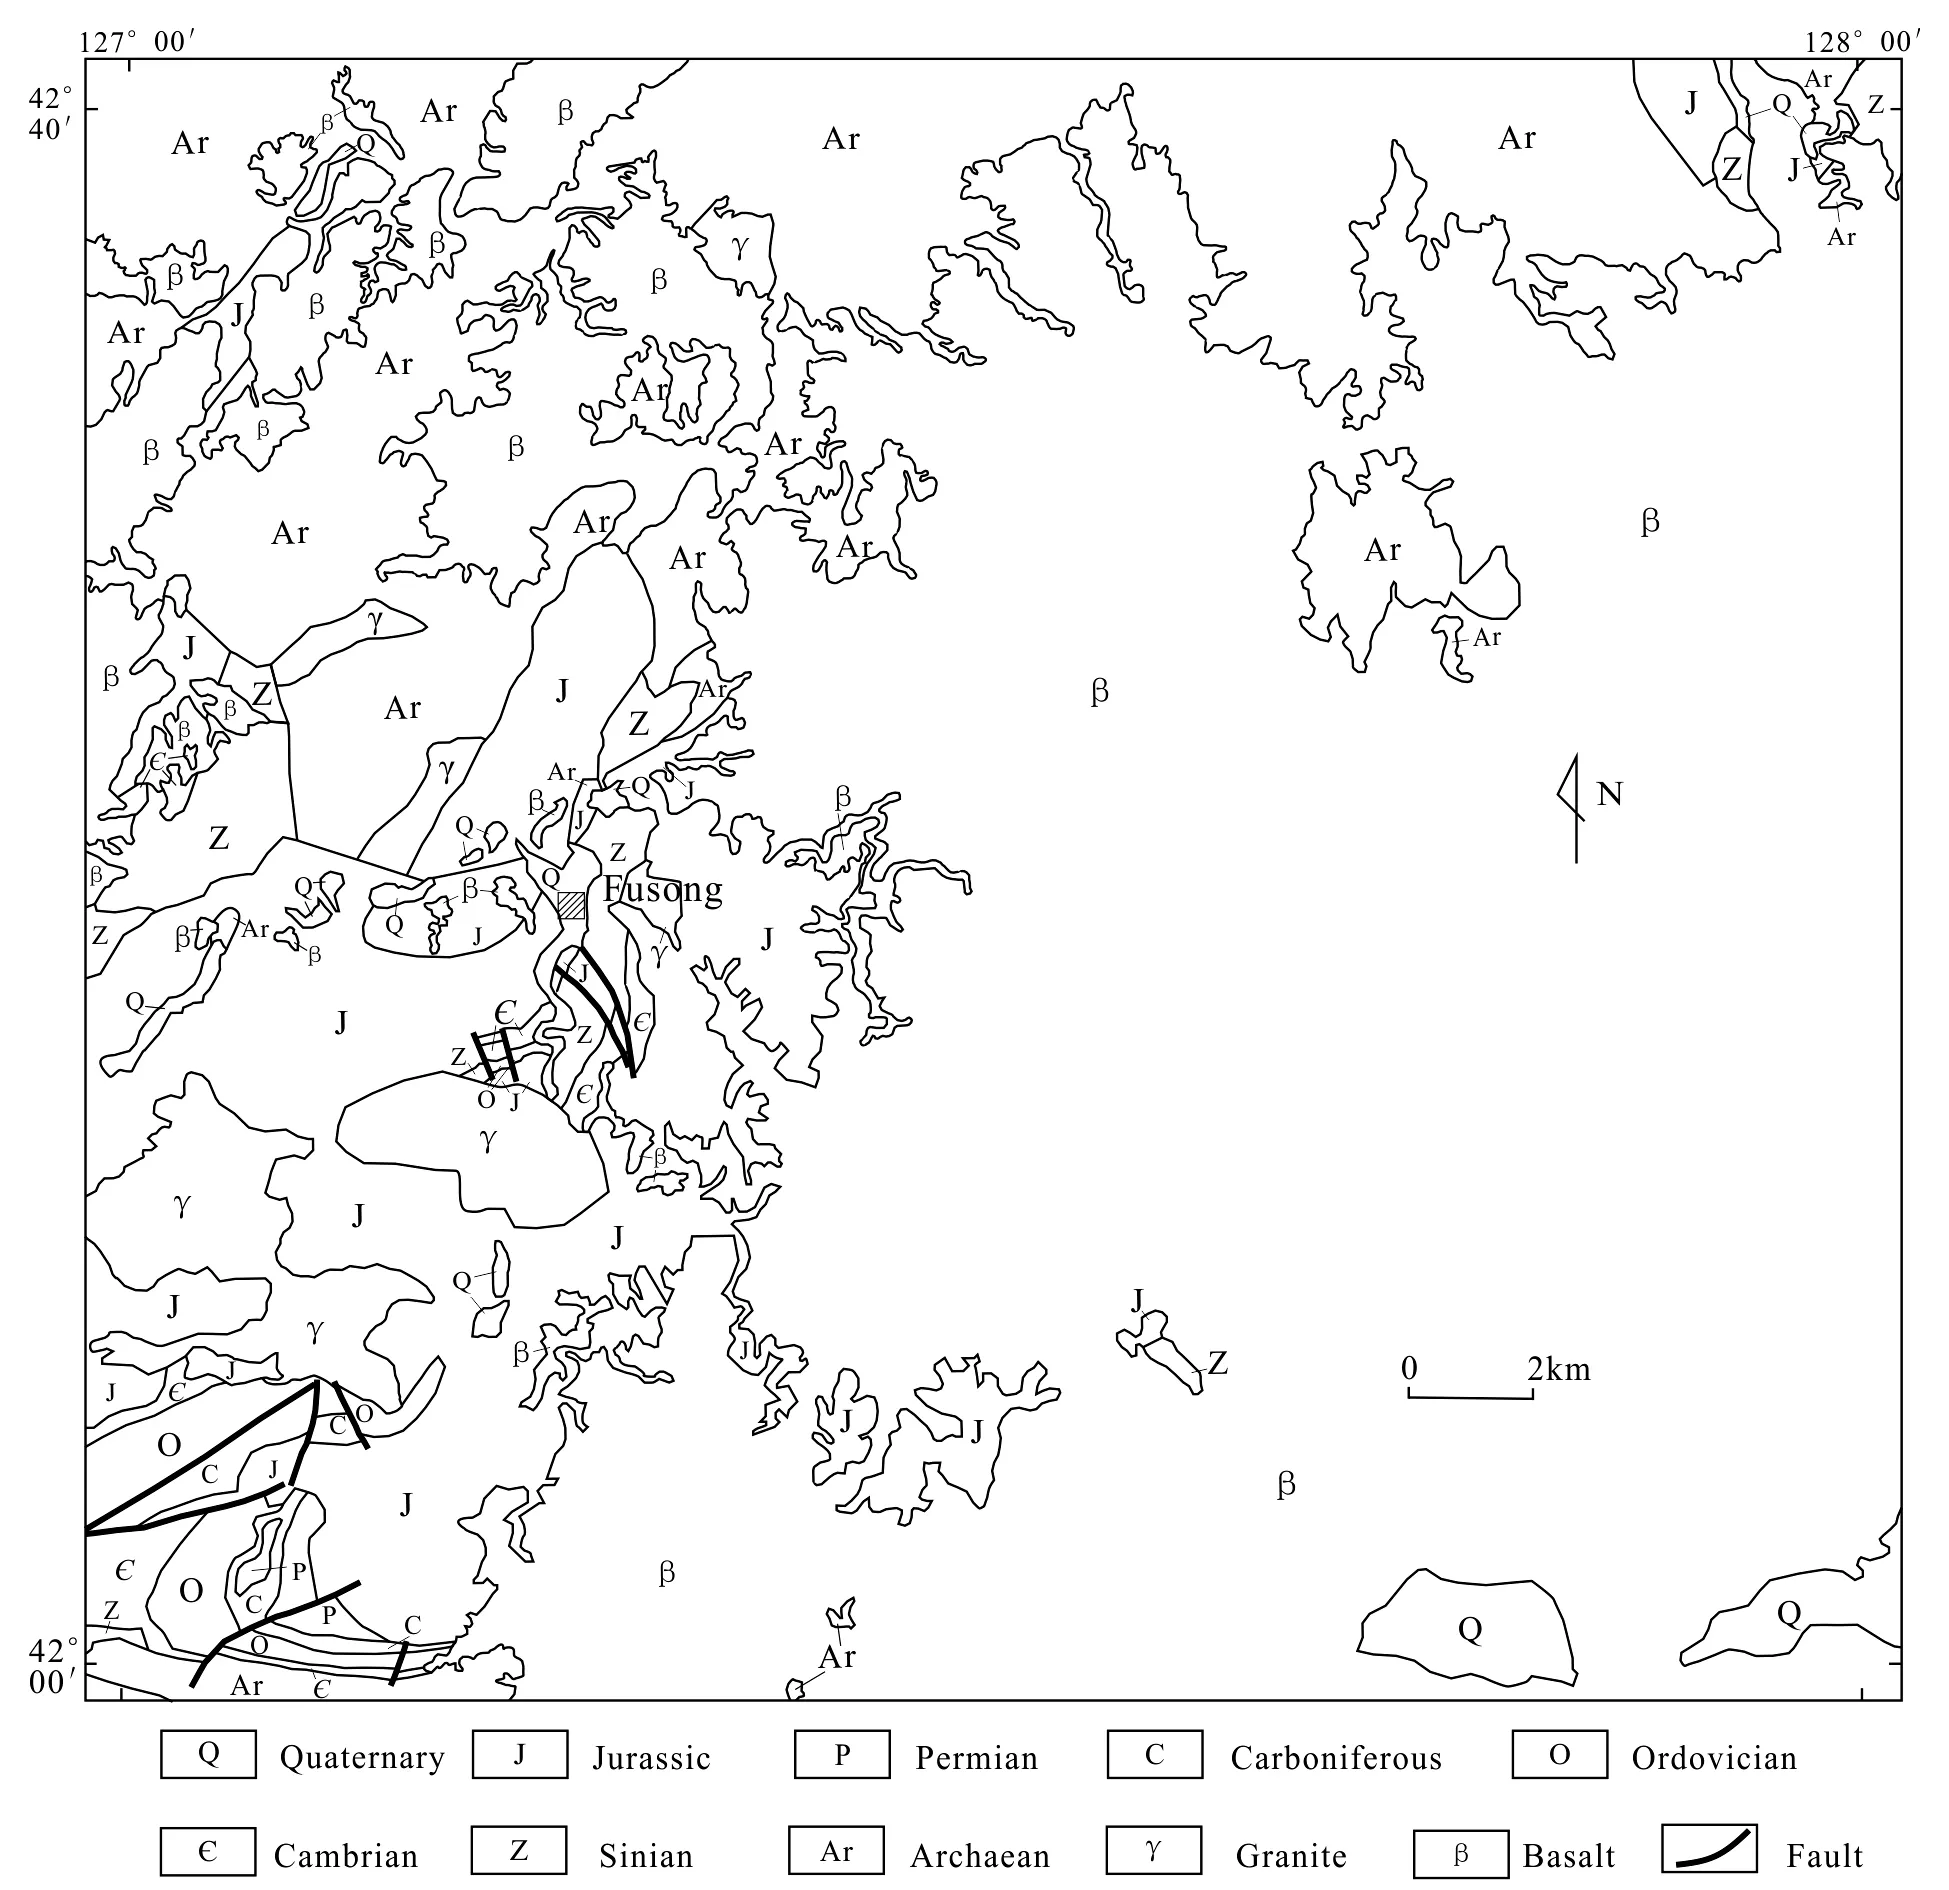
Fig.1 Simplified geological map of the studied area
1 Research area and data
1.1 Geology of the study area
The strata from Archean to the Cenozoic are well developed in Fusong area of Baishan City, Jilin Province (Lianetal., 2018) (Fig.1). The study area is located in the eastern part of the northern margin of the North China Plate. The terrain gradually dips from the southeast to the northwest, and the landform type is classified as Changbai Mountain landform. The geological structure mainly consists of Changbai Mountain volcanic lava, which occurs as lava terraces, terraces and floodplains, low hills and low mountains after the Quaternary glaciation (Leng, 2016; Yang, 2019). The fault structures in the study area are mainly NNE, NW and NEE-trending, with frequent regional magmatic activities, both intrusive and eruptive. The rocks consist of basalt, granite, and mixed granite. Among them, the Early Triassic and the Mid-Jurassic acidic magmatic intrusion played a key role in regional mineral migration and enrichment, and finally formed various types of metal deposits (Li & Zhang, 2014; Lv, 2017).
1.2 Geochemical survey data
This study uses 1∶200 000 soil geochemical survey data, and 1 524 samples were collected. The sample distribution is shown in Fig.2.

Fig.2 Distribution map of geochemical samples in the studied area
The purpose of the study is to select Fe2O3and Pb as indicator elements for univariate geochemical anomaly identification based on two known iron ore points and a lead-zinc mineralization point in the study area. The statistical results of the basic characteristics of the data are shown in Table 1.

Table 1 Fe2O3(%) and Pb (10-6) of geochemical data in the study area
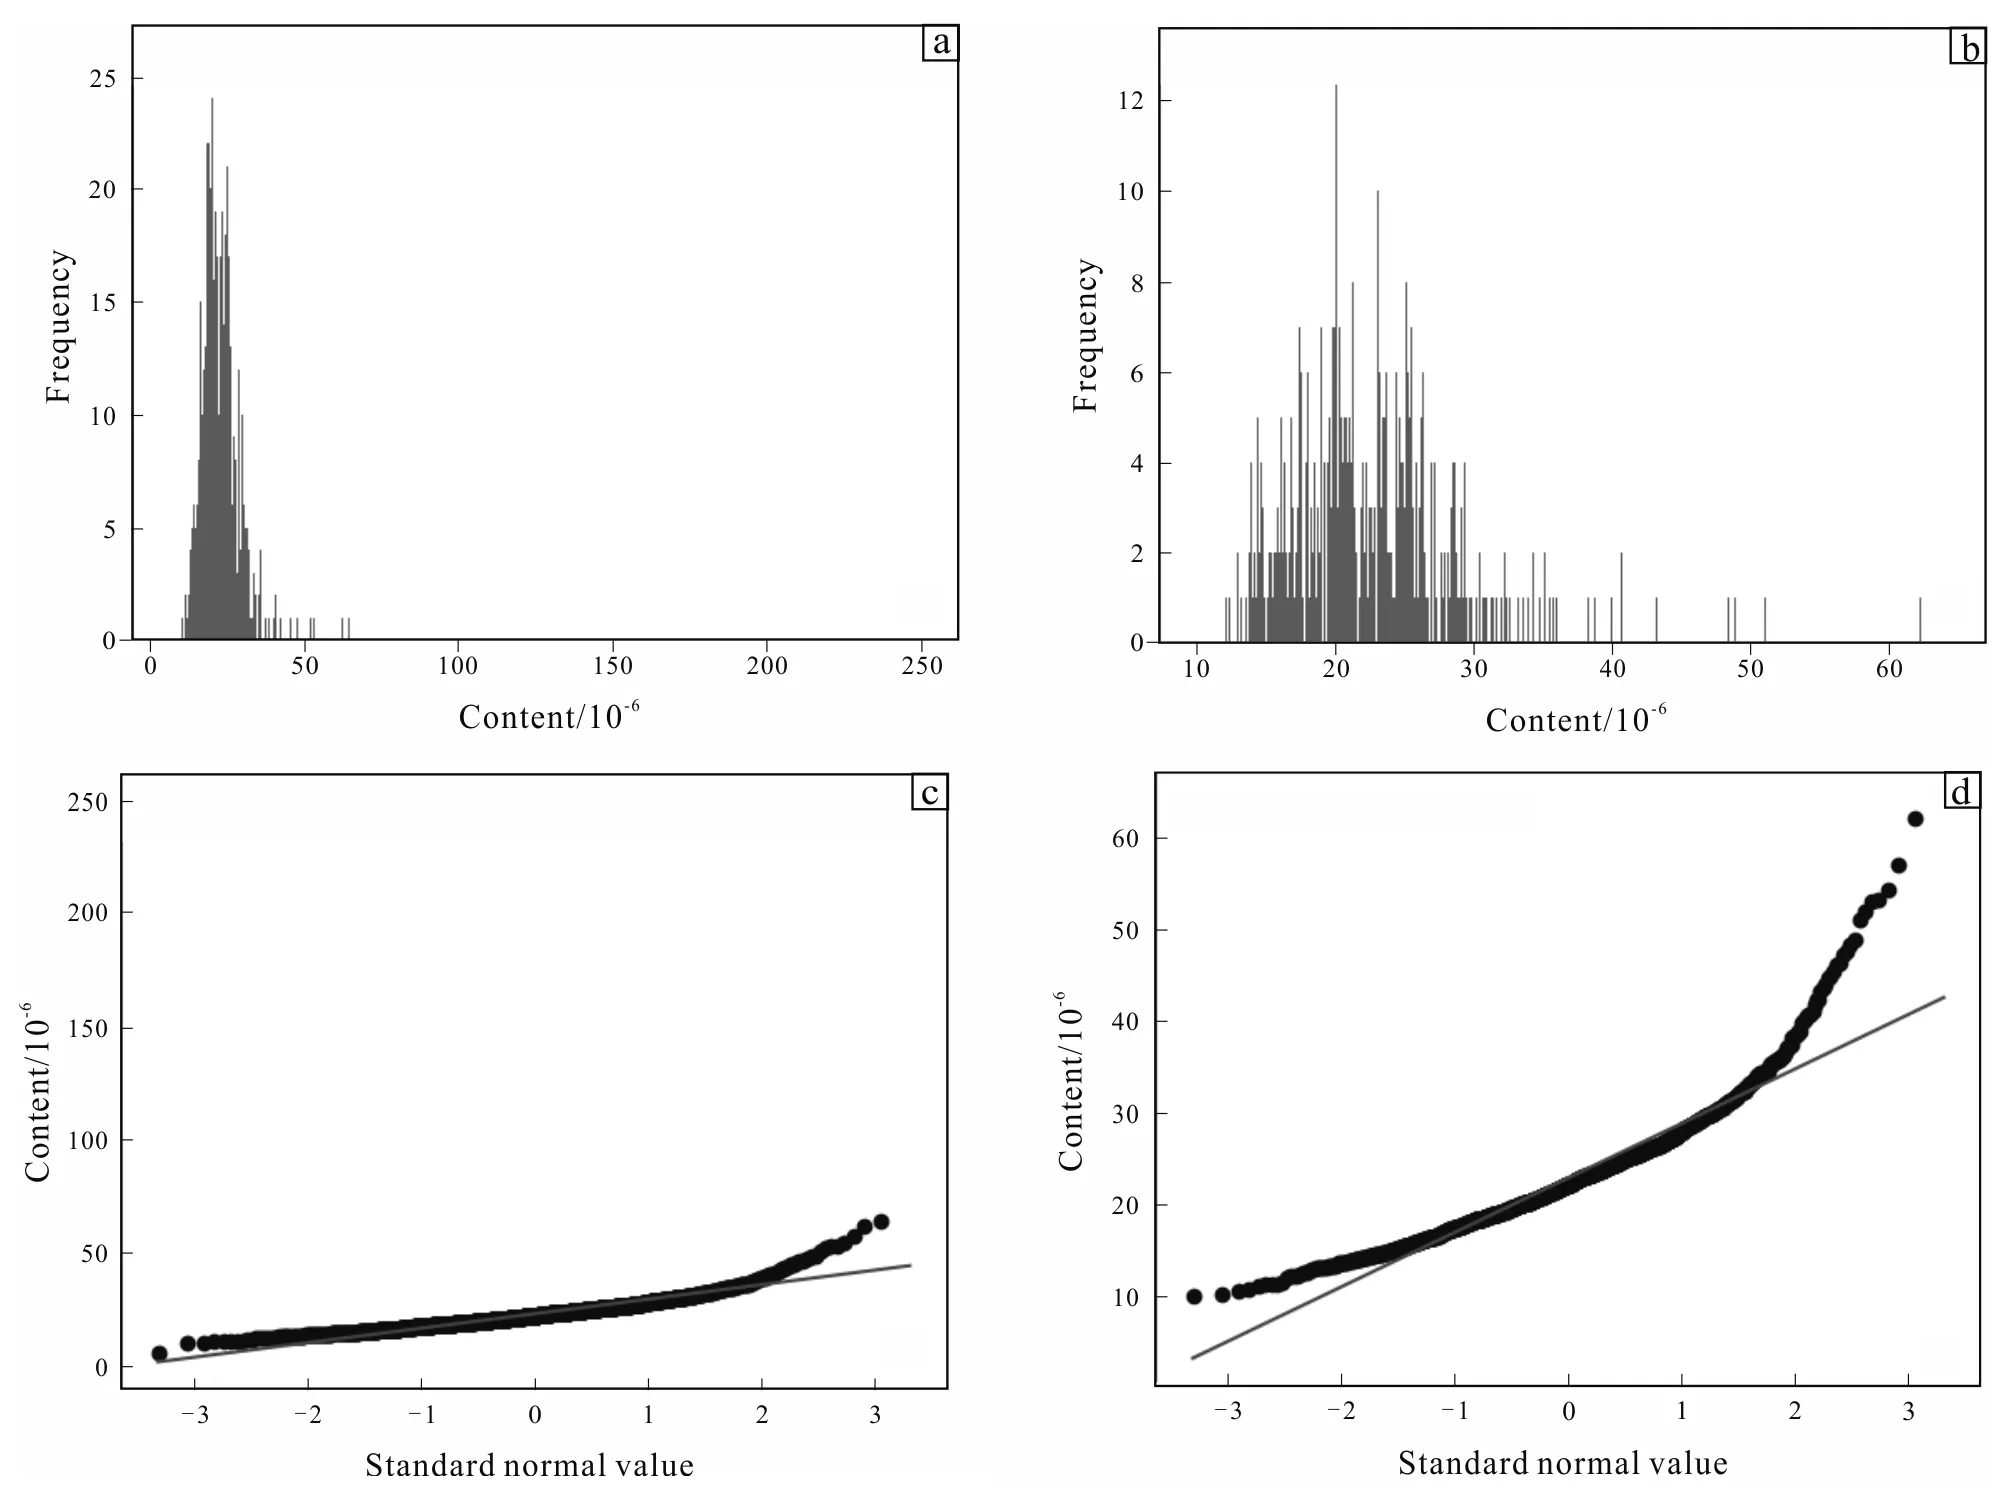
Due to the “high value” appearance in the geochemical raw data, the analysis and identification of geochemical information will be seriously affected to some extent (Agterberg, 2014; Liu, 2015; Caoetal., 2018). In this paper, the distribution of the element variable data is illustrated by histogram and Q-Q graphs, and the "high value" data points will be eliminated. Taking Pb element as an example, the results before and after the elimination are shown in Fig.3, and finally 1 522 samples data after removing the high value are obtained.
After the high value is removed, the Fe2O3and Pb geochemical indicator element data are unevenly distributed. Inverse distance weighted interpolation method is applied to the data using Surfer software to generate 100×67 uniformly distributed grid element data. A grid point containing a known mineralization point is defined as an ore point, and a grid point that does not contain a mineralization point is a non-ore point.
2 Research method
Isolation forest is an unsupervised anomaly detection method with linear time complexity and high precision. There are many theoretical definitions of anomalies, usually depending on the specific application scenario. Isolation forest is suitable for the anomaly detection of continuous data and defines anomalies as “easy to be isolated outliers”, which can be understood as points that are sparsely distributed and distant from dense groups. In geochemical data, the anomalies point is a point that is easily isolated from the large and dense background field in the surrounding area.

(a) Histogram of variable Pb in geochemical data before eliminating high values; (b) Q-Q distribution of variable Pb in geochemical data before eliminating high values; (c) histogram of variable Pb in geochemical data after eliminating high values; (d) Q-Q distribution of variable Pb in geochemical data after eliminating high values.Fig.3 Histograms and Q-Q distribution of variable Pb in geochemical data before and after eliminating high values
Isolation forest uses an efficient strategy to find easily isolated points. Assuming we use a random hyperplane to cut the data space, and generate two subspaces at a time. Then continue to repeat cutting using random hyperplane till there is only one data point in each subspace. Intuitively, it can be found that clusters with high density need to be cut many times to achieve this situation (Liuetal., 2008).
Isolation forest uses a binary tree to segment the data. Because it is a random cut, the Monte Carlo method is used to obtain a convergence value, and the cut is repeated from the beginning to average the cutting result (Liuetal., 2008). When applied to the identification of geochemical anomalies, training samples were randomly selected from a population of geochemical samples. To achieve isolation, a threshold between the maximum and minimum concentration values of the selected element must be selected and a random partition must be generated. The random partitioning of the training samples is repeated until all training samples are isolated (Wu & Chen, 2018).
The specific implementation process of the method is divided into two parts, the training process and the prediction process. The training process is to construct an iTree, extract a batch of samples from the full amount of data, select a feature attribute as the starting node, and randomly select a threshold between the maximum and minimum values of the feature attribute. If the data in the sample is smaller than the threshold it is assigned to the left branch, if it is greater than or equal to the threshold it is assigned to the right branch. The step is repeated in the left and right branch data till the following conditions are met:
(1)Data are not dividable, that is, it contains only one data point, or all data are the same.
(2)The isolation tree reaches the defined maximum depth.
The method realizes random extracting of multiple sample data and constructing multiple iTrees to ensure the difference between different trees. The prediction process is to synthesize the results of multiple iTrees and calculate the anomaly score for each data point. Assuming there is a datax, to calculate its score, we need to estimate its path length in each iTree (Liuetal., 2008) according to the value of different features from the root node along an iTree, from top to bottom, until a leaf node is reached. Assuming that the number of samples in the iTree training sample that falls in the child node withxisT.size, the path lengthh(x) of the dataxon the iTree can be calculated as:
h(x)=e+C(T.size)
(1)
Whereerepresents the number of edges that dataxpasses from the root node of the iTree to the leaf node.C(T.size) can be considered as a correction value, which represents the average path length of a binary tree constructed fromT.sizestrip sample data. In general, the formula forC(n) is as below (Liuetal., 2008):
(2)
WhereH(n-1)=ln(n-1)+ξ,ξis the Euler constant. The final anomaly score of dataxis a combination of the results of multiple iTrees,Score(x) is expressed as:
(3)
WhereE(h(x)) represents the mean of the path length of dataxin multiple iTrees,ψrepresents the number of training samples for a single iTree, andC(ψ) represents the average path length of a binary tree constructed withψpieces of data. Normalization is also applied. From formula (3) it can be seen that the value ofScore(x) is [0,1]. The smaller theE(h(x)) is, the closer theScore(x) is to 1. The larger theE(h(x)) is, the closer theScore(x) is to 0.5 (Liuetal., 2008).
If when the average path length of the dataxin multiple iTrees is shorter, the score is closer to 1, indicating that the dataxis anomaly. Whereas when the average path length of the dataxin multiple iTrees is longer, the score is closer to 0, indicating that the dataxis more normal; if the average path length of dataxin multiple iTrees is close to the overall mean, the score will be around 0.5.
Two parameters need to be set when constructing an isolation forest model. One is the numbernof training samples and the other is the numbertof iTrees. According to the experimental results in Liuetal. (2008), good results can be achieved in most cases whenn=256 andt=100, and can be used as the default parameter for abnormal detection using isolated forest.
3 Experimental results and analysis
In this study area, the number of optimal training samples and the number of iTrees determined by multiple experiments are 100 and 100, respectively. An isolation forest with 100 iTrees is constructed, of which each tree is randomly constructed by randomly subdividing 100 subsamples of the geochemical indicator element samples selected, and finally the anomaly score of each grid element data is calculated based on their path length on 100 iTrees.
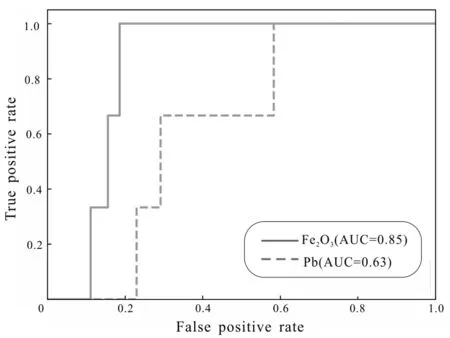
To more intuitively quantify the spatial correlation of the Fe2O3and Pb geochemical indicator elements with known mineralization points, a series of thresholds are obtained by dividing the difference between the maximum and minimum values of the anomaly fraction by equal intervals. Each discrete threshold is used to distinguish between grid points carried by ore and non-ore points. Grid points with anomaly scores greater than the threshold are predicted as ore-bearing points, while grid points with anomalies scores less than the threshold are predicted as non-ore points. A binary classification system can be established based on all discretization thresholds, and then the ROC curve and the AUC value of the corresponding indicator element can be obtained based on the predicted ore-bearing point, the predicted ore-free grid point, the true known ore-point, and the true known non-ore point information. The bigger the AUC value, the higher the classification quality of the classifier, and a stable spatial correlation between the indicator element and the known ore point can be evaluated. Fig.4 shows the ROC curves of the Fe2O3and Pb geochemical indicator elements based on the isolation forest model.

Fig.4 ROC curves of isolation forest model
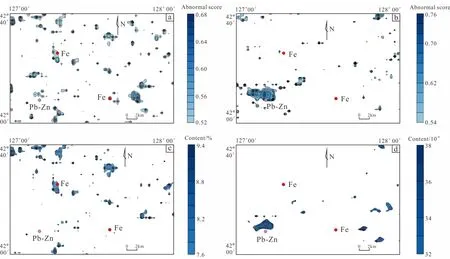
Based on the grid data of the anomaly score, the threshold method can be used to divide the grid into geochemical anomalies and backgrounds. Youden index (Ruoppetal., 2008) can determine the best threshold (Chen, 2015) to identify geochemical anomaly. In medical statistical analysis, the Youden index is used to capture the performance of diagnostic examinations. It is summarized as the difference between the true positive rate and the false positive rate. Its value ranges from 0 to 1. When the diagnostic test gives the same proportion of positive results in samples with and without disease, the Youden index value is 0, indicating that the test is useless. A value of 1 indicates a false positive or false negative with no errors, indicating that the test is perfect. The index gives the same proportion to both the false positive and false negative values, so all tests with the same index value give the same weight for the final value of the misclassification. In geochemical anomaly identification, Youden index can be used to find the correlation between identified geochemical anomalies and known ore location points. Larger value of the Youden index can led to stronger correlation between identified geochemical anomalies and known ore location points. The optimal threshold of Fe2O3and Pb anomalies scores is determined based on the Youden index and the geochemical anomaly based on the isolation forest model is obtained. The anomaly contour maps of Fe2O3and Pb anomaly scores are drawn by using Surfer software, and the results are compared with that of traditional statistical method, which is a statistical based geochemical anomaly identification method, as shown in Fig.5.
It can be seen from Figs.4,5, (a) that the univariate geochemical anomaly identified based on the isolation forest model has significant spatial correlation with the known ore points, indicating that the method for geochemical anomaly identification is feasible; (b) The high-value anomalies identified by traditional statistical method is generally consistent with the anomalies identified in the isolation forest model approach, indicating that both methods can well identify high-value anomalies; (c) Some weak anomalies can be identified by the isolation forest model method, but cannot be identified in traditional statistical method, indicating that the isolation forest model method is superior to traditional statistical method in univariate geochemical anomaly detection, it is able to identify low value anomalies apart from high value anomalies.

(a) Fe2O3 element anomaly contour map with isolation forest model method; (b) Pb element anomaly contour map with isolation forest model method; (c) Fe2O3 element anomaly contour map with traditional statistical method; (d) Pb element anomaly contour map with traditional statistical method.Fig.5 Fe2O3 and Pb element anomaly maps with two different methods
4 Conclusions
(1) The univariate geochemical anomaly identified by the geochemical anomaly detection model based on the isolation forest algorithm has significant spatial correlation with the known ore points in the study area.
(2) The high-value anomalies identified by traditional statistical method is generally consistent with the anomalies identified in the isolation forest model approach.
(3) Some weak anomalies that can be identified by the isolation forest model method, cannot be identified in traditional statistical method, i.e., the isolation forest model method can identify both low-value anomalies and high-value anomalies.
杂志排行
Global Geology的其它文章
- Zircon U-Pb geochronology and geochemistry ofgranite in Huoluotai area of northern Great Hinggan Range
- Structural mechanism and construction method of mud andwater inrush in Xiangyun tunnel of Guangtong-Dali railway
- Regularized focusing inversion for large-scalegravity data based on GPU parallel computing
- Logging interpretation method for reservoirs with complexpore structure in Mesozoic-Cenozoic faulted basinaround Daqing exploration area
- Slope reliability analysis based onMonte Carlo simulation and sparse grid method
- Mode decomposition methods and their application inground penetrating radar data processing
