An enrichment model using regular health examination data for early detection of colorectal cancer
2019-09-10QiangShiZhaoyaGaoPengzeWuFanxiuHengFumingLeiYanzhaoWangQingkunGaoQingminZengPengfeiNiuChengLiJinGu
Qiang Shi, Zhaoya Gao, Pengze Wu, Fanxiu Heng, Fuming Lei, Yanzhao Wang, Qingkun Gao,Qingmin Zeng, Pengfei Niu, Cheng Li,2,4, Jin Gu,2,5
1Department of General Surgery, Shougang Hospital, School of Life Sciences, Peking University, Beijing 100871, China; 2Peking-Tsinghua Center for Life Sciences, Academy for Advanced Interdisciplinary Studies, Peking University, Beijing 100871, China; 3Key Laboratory of Carcinogenesis and Translational Research (Ministry of Education/Beijing), Department of Information Technology, Peking University Cancer Hospital &Institute, Beijing 100142, China; 4Center for Statistical Science, Center for Bioinformatics, Peking University, Beijing 100871, China; 5Key Laboratory of Carcinogenesis and Translational Research (Ministry of Education/Beijing), Department of Gastrointestinal Surgery, Peking University Cancer Hospital & Institute, Beijing 100142, China
Abstract Objective: Challenges remain in current practices of colorectal cancer (CRC) screening, such as low compliance,low specificities and expensive cost. This study aimed to identify high-risk groups for CRC from the general population using regular health examination data.Methods: The study population consist of more than 7,000 CRC cases and more than 140,000 controls. Using regular health examination data, a model detecting CRC cases was derived by the classification and regression trees(CART) algorithm. Receiver operating characteristic (ROC) curve was applied to evaluate the performance of models. The robustness and generalization of the CART model were validated by independent datasets. In addition, the effectiveness of CART-based screening was compared with stool-based screening.Results: After data quality control, 4,647 CRC cases and 133,898 controls free of colorectal neoplasms were used for downstream analysis. The final CART model based on four biomarkers (age, albumin, hematocrit and percent lymphocytes) was constructed. In the test set, the area under ROC curve (AUC) of the CART model was 0.88 [95%confidence interval (95% CI), 0.87-0.90] for detecting CRC. At the cutoff yielding 99.0% specificity, this model's sensitivity was 62.2% (95% CI, 58.1%-66.2%), thereby achieving a 63-fold enrichment of CRC cases. We validated the robustness of the method across subsets of test set with diverse CRC incidences, aging rates, genders ratio, distributions of tumor stages and locations, and data sources. Importantly, CART-based screening had the higher positive predictive value (1.6%) than fecal immunochemical test (0.3%).Conclusions: As an alternative approach for the early detection of CRC, this study provides a low-cost method using regular health examination data to identify high-risk individuals for CRC for further examinations. The approach can promote early detection of CRC especially in developing countries such as China, where annual health examination is popular but regular CRC-specific screening is rare.
Keywords: Classification and regression trees; colorectal cancer; regular health examination data; routine lab test biomarkers
Introduction
Colorectal cancer (CRC) is the third most common cancer in males and second most common in females across the world (1). With changes in modern lifestyles, such as highfat diets and sedentary occupations (2), the number of new CRC cases has increased rapidly, with estimated 1.8 million new cases and 861,663 deaths in 2018 worldwide (1). In China, the incidence and mortality rates of CRC in 2015 are 27 and 13 per 100,000, respectively, ranking CRC as the fifth most frequent cancer nationwide (3). In Beijing,CRC incidence is higher in urban areas than in rural areas,but the incidence rate is increasing faster in rural areas than in urban areas (4).
Most colorectal carcinomas develop from a preclinical state of adenoma, which takes years to progress to advanced cancers (5,6). During this progression, early-stage CRC can be diagnosed by invasive imaging techniques, such as flexible sigmoidoscopy and colonoscopy (7,8). Early detection and removal of adenomas can reduce CRC incidence and mortality significantly (7-10). In the US, the 5-year survival rate for CRC cases diagnosed at early stages is 90%, in contrast to 65% for all CRC cases (11). From 1989 to 2011, the largest reductions in CRC mortality rates, more than 25%, have been achieved in European countries with better accessibility to CRC screening programs (12). Over the last decade, newer tests based on DNA, RNA and protein biomarkers in stool and blood have also improved the accuracy of CRC screenings (7,13-17).
However, challenges remain for regular CRC screening of large populations, especially in developing countries such as China. First, people are often unwilling to undergo invasive examinations such as colonoscopy due to physical or psychological reasons and expensive cost (7). Low compliance results in incomplete CRC screening of the populations. Second, given the very low prevalence of CRC and the low specificity of current screening tests (18,19), it is not cost-effective for the whole population to receive invasive or molecular biomarker-based screenings for CRC,especially in regions with no or limited access to treatment(20). Third, since different countries have different health policies, economics and medical cultures, it is difficult to develop a universal CRC screening program suitable for all countries (7,21-23).
An alternative to invasive CRC screening for the whole population is to first identify high-risk groups for CRC by non-invasive examinations or questionnaires, and then to perform invasive CRC examination only in these high-risk groups. Such two-step schemes (13) have been experimented in certain regions of China and have advantages of better compliance, lower overall cost and feasibility across different regions and cultures (24-26).Under the premise of good sensitivity, an extremely high specificity or low false positive rate (FPR) in initial screening is crucial to ensure that only very small proportion of CRC-free individuals are incorrectly assigned to the high-risk group which will receive further invasive examinations. However, existing mathematical model-based methods for CRC screening cannot balance sensitivity and specificity well. Usually, FPRs are more than 5% at around 60% sensitivity, reducing the utility of these methods for the general population screening (27-33).
In this study, we aimed to identify the high-risk groups for CRC from the general population by their routine lab test biomarkers from regular physical health examination data. Based on the classification and regression trees(CART) model detecting CRC cases, we achieved a 63-fold enrichment of CRC cases in the identified high-risk group relative to the original population with high sensitivity and specificity.
Materials and methods
Study population
Study data were from two independent hospitals in Beijing,China: Peking University Cancer Hospital (PUCH) and Peking University Shougang Hospital (PUSH). Specially,routine lab test data of CRC cases were from Departments of Gastrointestinal or General Surgery, while data of controls free of colorectal neoplasms were from physical health examination centers that provide services to the public. The PUCH data set consists of 7,068 diagnosed CRC cases from 2010 to 2015 and 80,194 controls who received physical health examinations but were not clinically diagnosed with CRC from 2007 to 2014. The PUSH data set consists of 453 CRC cases from 2011 to 2016 and 66,570 controls from 2009 to 2016(Supplementary Table S1). All patient and control records were anonymized and de-identified prior to analysis.
Ethics approval and consent to participate
Approval for the study was provided by the Ethics Committee of Peking University Shougang Hospital(IRBK-2017-035-01). The Ethics Committees granted waivers of informed consent since this study involved analysis of retrospective data and all patient and control records were anonymized and de-identified prior to analysis.
Availability of data and materials
The R code and part data analyzed during the study are available in the GitHub repository, https://github.com/ChengLiLab/CRC_screening. The completed datasets are available from the corresponding author on reasonable request.
Data quality control
We performed quality control for the two data sets before analysis. First, when CRC cases underwent routine lab examinations multiple times, we only reserved the first preoperative data, which best represent the original symptoms of patients before interventions or treatments.Correspondingly, if controls underwent examinations more than once, we only used the latest one. Second, we deleted those samples without gender or age records. Third, for the PUCH data set, we filtered the top 35% and top 40% of lab test biomarkers that have the least missing values for the CRC and control groups, respectively. The cutoffs filtering biomarkers were determined by the distributions of the number of non-missing values. Finally, we obtained 38 biomarkers that overlapped between the two top lists.We then extracted the final PUCH data set containing these 38 biomarkers for both CRC and control groups(Supplementary Table S1). Furthermore, we corrected obvious data input mistakes, for example, one individual's age recorded as 410. Similarly, we obtained a qualitychecked PUSH data set containing 30 biomarkers in which 27 biomarkers were common between the two data sets(Supplementary Table S1).
CART
CART (34) is an important algorithm of decision tree. A CART model can be represented by a binary tree, which splits its branches at feature thresholds according to the Gini splitting rule. To avoid overfitting, we used minimal cost complexity pruning (35) to prune the original tree.Compared with other methods, not only the CART model is easier to interpret, but also the CART algorithm is more robust in handling missing values with better computational speed and accuracy (34,36,37).
Data allocation
We divided the PUCH data set into two parts, 80% for training models and the remaining 20% for testing the performance of the final model. Then we divided the training set into two parts, 75% for developing models and 25% for validating the models.
However, influenced by specific instrument, the values of lab test biomarkers were not always comparable across hospitals.Sometimes, the reference values of the same biomarkers were different between PUCH and PUSH.Therefore, the CART model trained from PUCH cannot be directly applied to PUSH. As a further validation of the method, we used the 70% of PUSH data set to train another CART model by the same biomarkers as the final CART model from PUCH, and tested its performance using the remaining 30% of PUSH data set.
Variable selection for CART
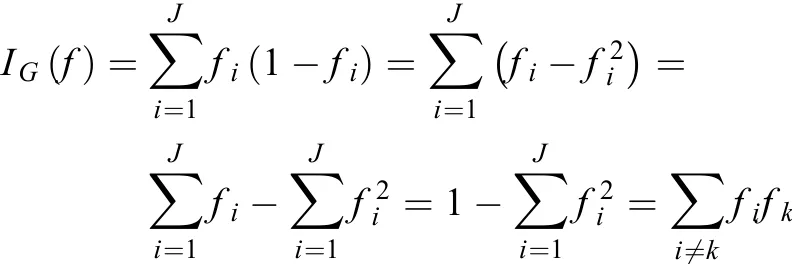
For each variable used in the CART model, the variable importance is defined as the sum of the decrease in impurity at all nodes where it is used as a splitter (34). For a classification withclasses, letbe the percentage ofclass samples in a node, and Gini impurity is defined as:
After obtaining the first CART model, we selected the important variables according to their importance and combined these variables to train a new CART model. We repeated the process of refining the CART model from the training set and validating its performance using the validation data, until the best CART model was derived.The surrogate split method is used to handle missing values in CART (34).
Measuring performance of models
We evaluated models by overall performance and specific performance in different application scenarios. First, as an overall measure of performance, we used the area under the receiver operating characteristic (ROC) curve (AUC).Second, we inspected the sensitivities at cutoffs yielding 99.0% specificity, which represents how many real CRC cases can be detected at the cost of misclassifying 1% of CRC-free individuals as CRC cases.
Results
Sample selection and routine lab test biomarkers
After data quality control, 4,211 CRC cases and 77,099 controls free of colorectal neoplasms of the PUCH data set and 436 CRC cases and 56,799 controls of the PUSH data set were used for downstream analysis (Table 1,Supplementary Table S1). In both data sets, patients were significantly older in CRC group than the control(P<2.2e-16) (Table 1, Figure 1A). In addition, the proportion of male was higher than female in both CRC and control groups. Particularly, 73.2% of the controls in the PUSH data set were male, due to that PUSH provided health services to a major steel factory company in China(Table 1). The two data sets both covered CRC cases clinically diagnosed at multiple tumor stages and locations(Table 1).For the PUCH training set, we obtained 38 common biomarkers from routine lab tests, in which 14 biomarkers were employed for downstream analysis that showed significant differences between the CRC and control groups in term of both statistics and effect size (Table 2,P<0.001, |Cohen's d| ≥0.5). CRC patients often have abnormal blood counts and some of these biomarkers have been used for CRC screening, diagnosis and prognosis(27-31,38-40). For example, blood albumin was significantly lower in the CRC group compared to the control (P<2.2e-16) (Figure 1B). Based on these observations, we hypothesized that a multivariate classification model can distinguish CRC cases from CRCfree individuals.
A CART-based CRC classification model using routine lab test biomarkers
Based on routine lab test biomarkers in the PUCH training set, a model detecting CRC cases was constructed by the CART algorithm, and this model's performance wasevaluated using the test set by the ROC curve (Figure 1C,Supplementary Figure S1). The final, best CART model consisted of only four biomarkers: age (Age), albumin (Alb),hematocrit (HCT) and percent lymphocytes (LYMPH%).Meaningfully, all four biomarkers had large effect sizes(Table 2, |Cohen's d| ≥0.8) between the CRC and control groups. In addition, we also built a simple model as the baseline comparison only using age as the predicting variable.

Table 1 Characteristics of study population
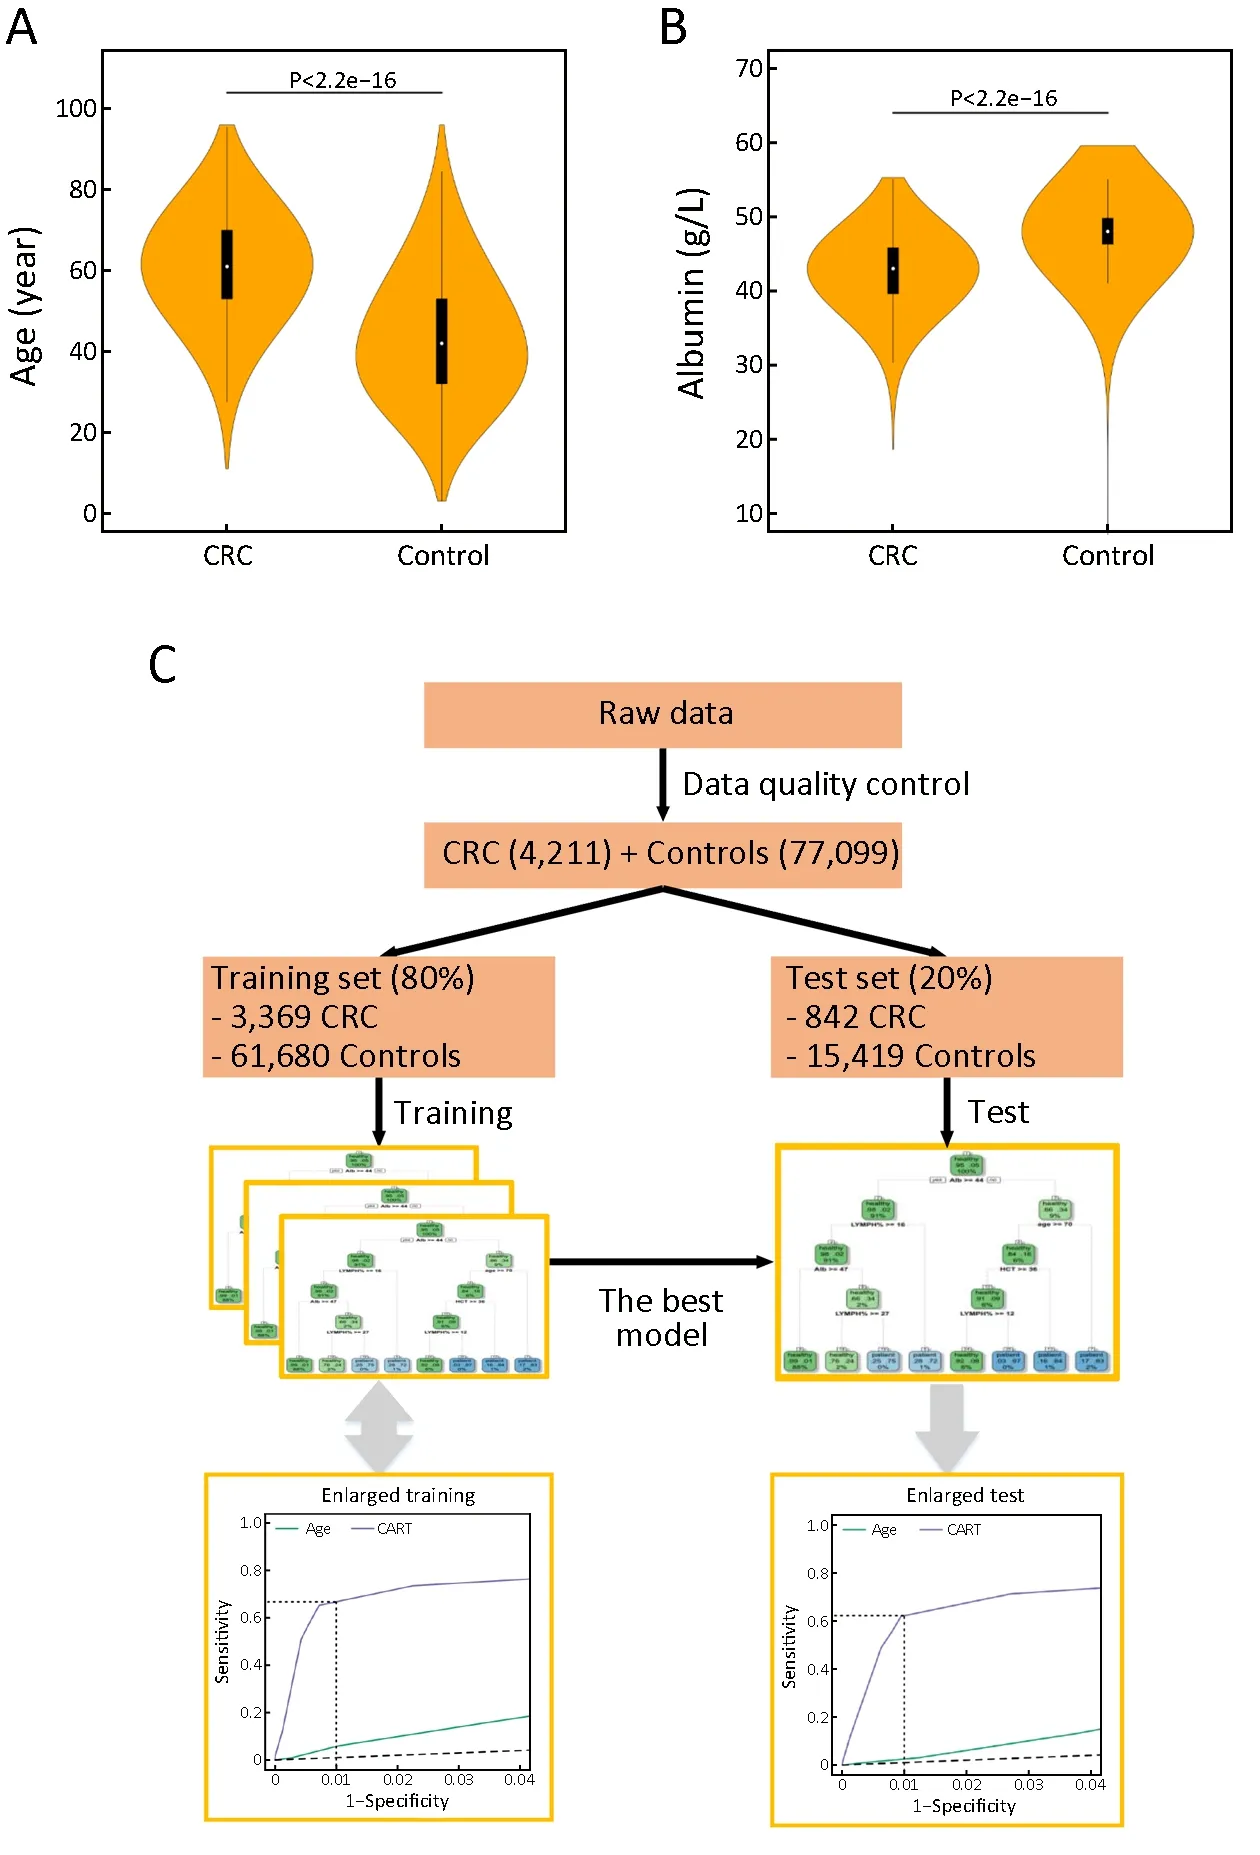
Figure 1 Distributions of two biomarkers and flowchart of model generation. Violin plots of age (A) (P<2.2e-16) and albumin (B)(P<2.2e-16) distributions for colorectal cancer (CRC) and control groups; (C) Flowchart of model generation. CART, classification and regression trees.
In the training set, the AUC values of the CART and age models were 0.90 [95% confidence interval (95% CI),0.88-0.91] and 0.81 (95% CI, 0.80-0.82), respectively(Figure 2A), showing that the CART model was superior to the age model overall. Noteworthy, the sensitivity of the CART model was 67.0% (95% CI, 63.7%-70.2%), much higher than 4.8% (95% CI, 3.2%-6.4%) of the age model when defining cutoffs yielding 99.0% specificity(Figure 2B). Therefore, the CART model can correctly identify 67% of real CRC cases at the cost of misclassifying 1% of CRC-free individuals as CRC cases. The CARTpredicted probabilities of being CRC were indeed higher for real CRC cases than for controls (Figure 2C). Thereliability of the CART model was validated by its performance on the test set. Specifically, the AUC of the CART model was 0.88 (95% CI, 0.87-0.90) and the sensitivity was 62.2% (95% CI, 58.1%-66.2%) at the 99.0% specificity (Figure 2D,E). And CART-predicted probabilities of being CRC also supported this (Figure 2F).We concluded that the CART model was able to distinguish CRC cases from CRC-free individuals with high sensitivity and specificity.
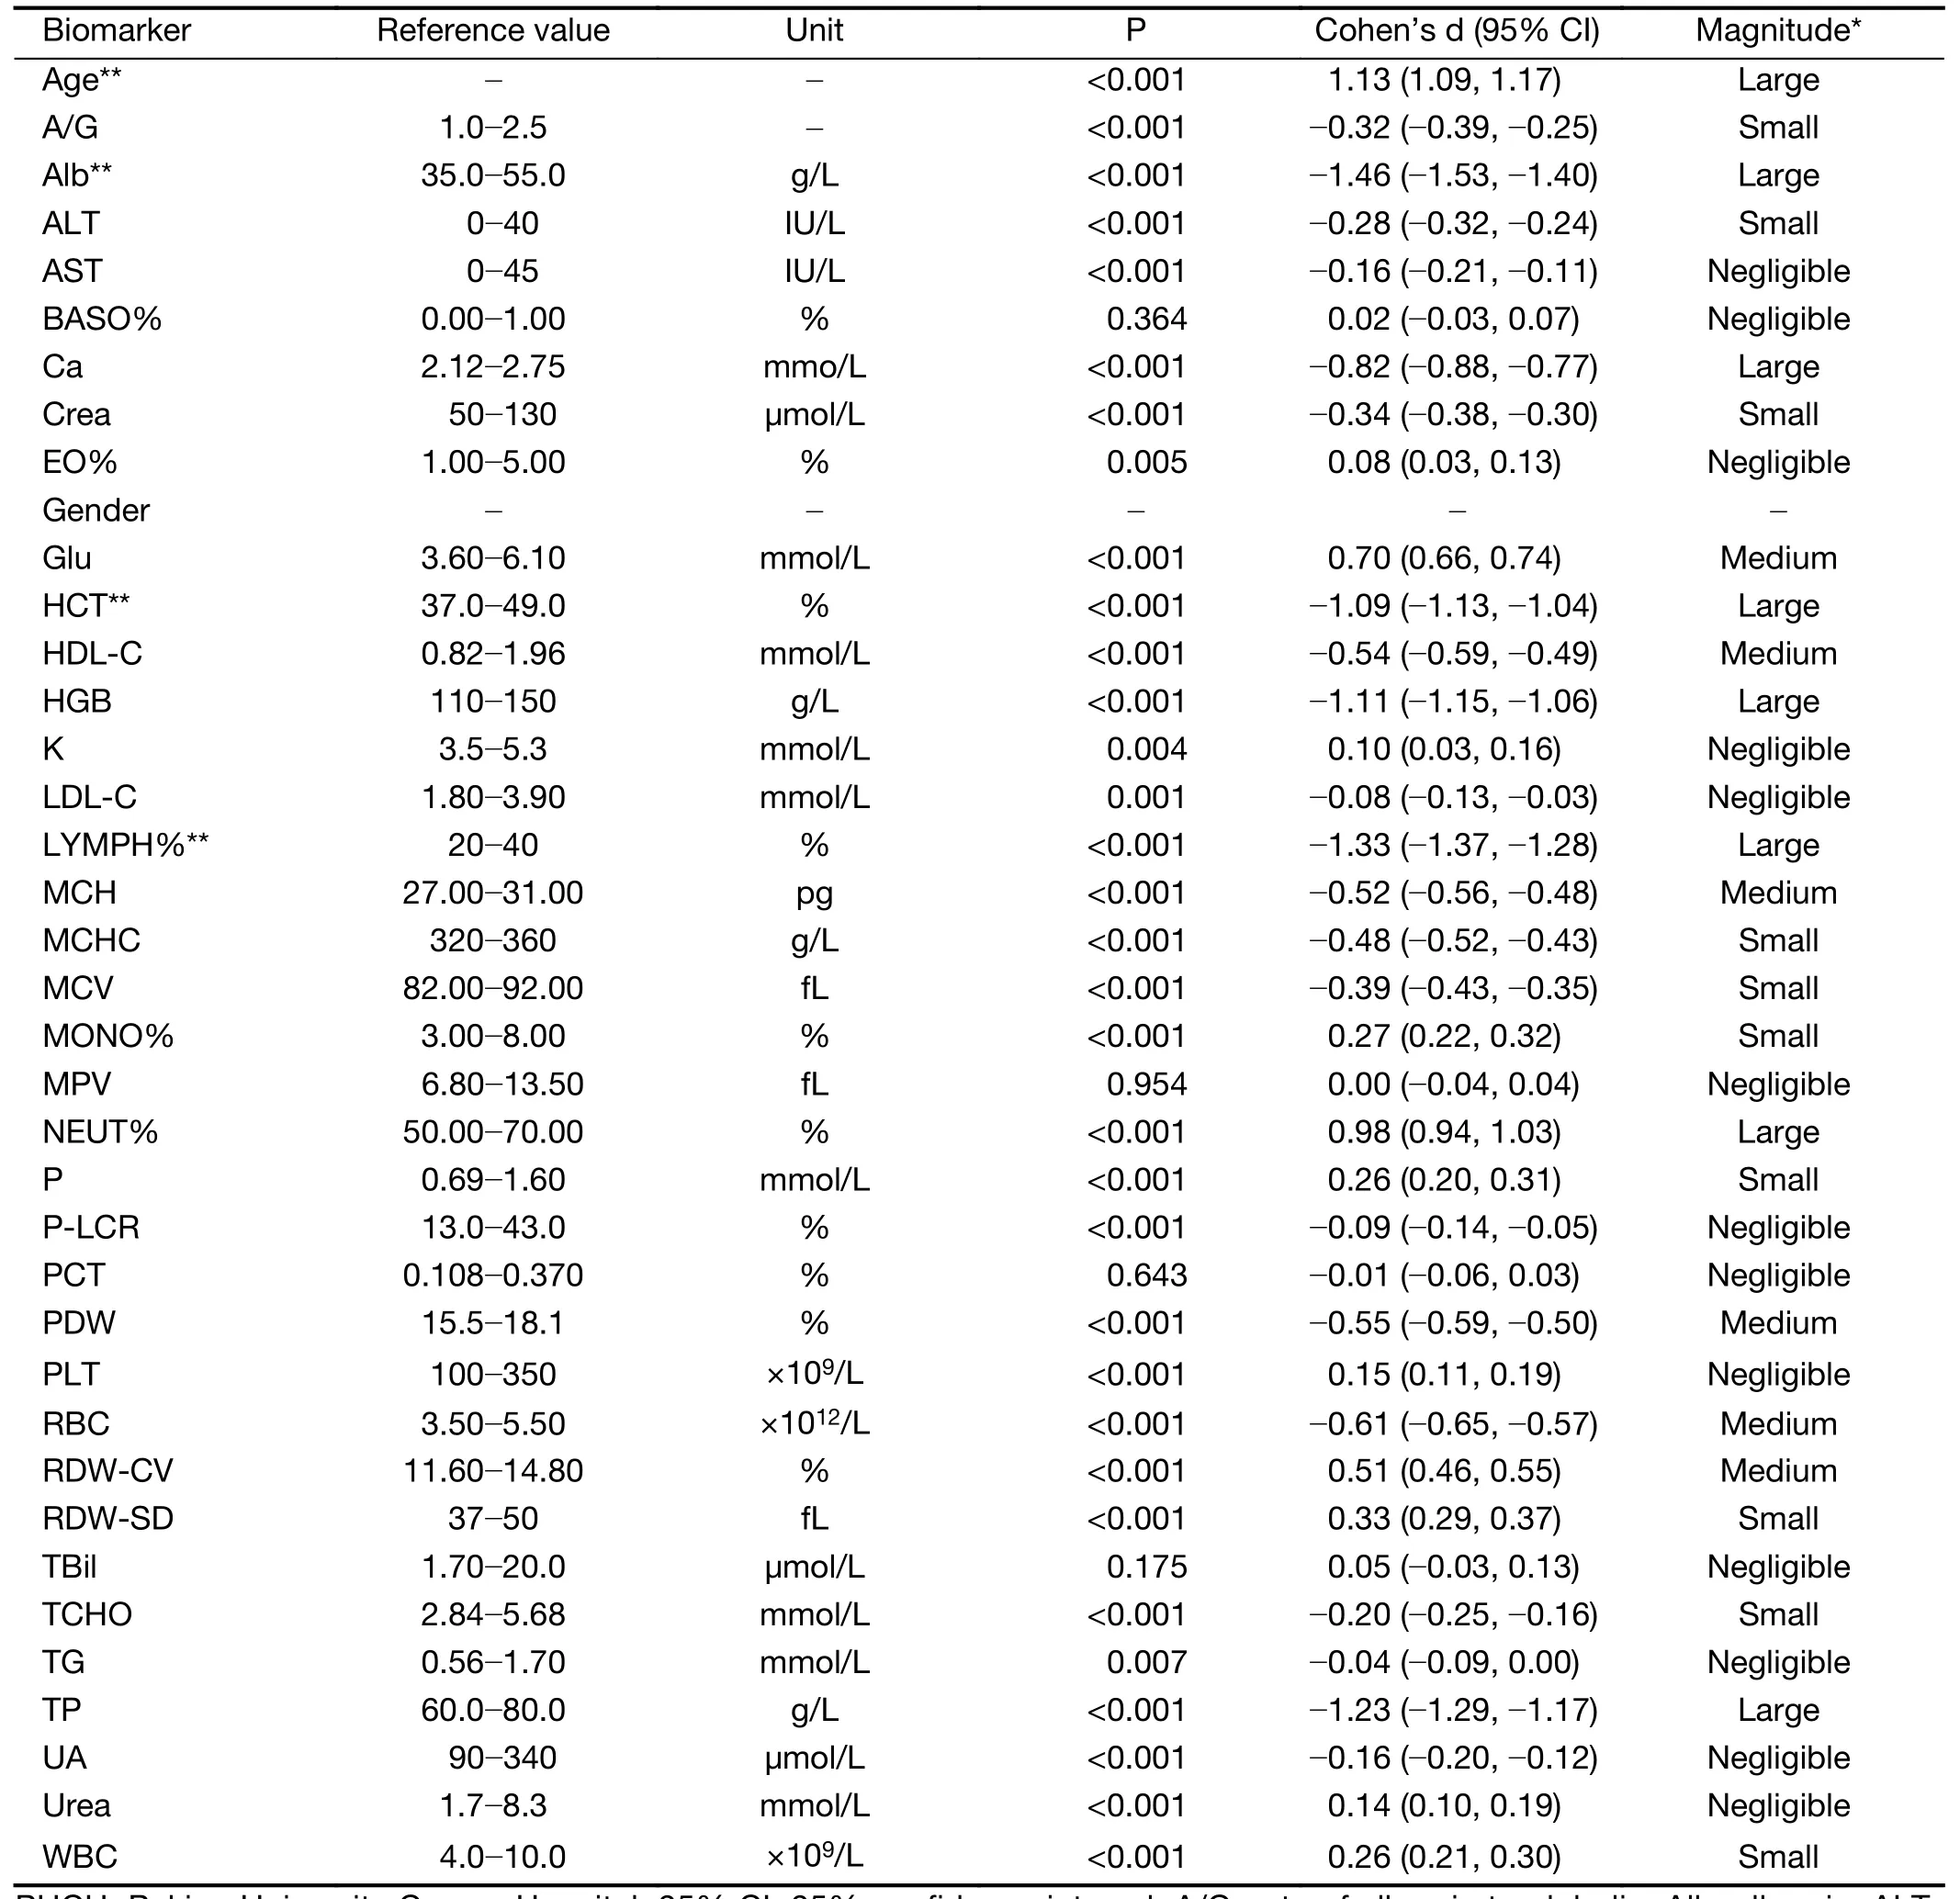
Table 2 Biomarkers of quality-controlled PUCH population
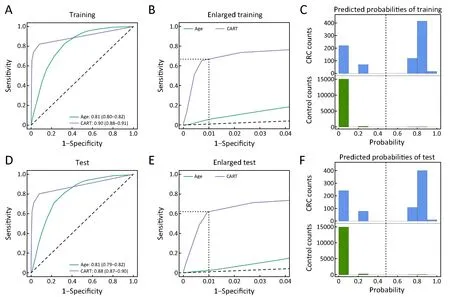
Figure 2 Performance of models on training set and test set. (A) Receiver operating characteristic (ROC) curves of age model and final classification and regression trees (CART) model on the training set. The values shown are area under the curves (AUCs) as well as 95%confidence intervals (95% CIs) based on 1,000 bootstrap iterations. P<0.001 for two-tailed Delong's test between the two ROC curve; (B)Enlarged local ROC curves in Figure 2A. Dashed lines show that the sensitivities at the 99.0% specificity of the CART and age models are 67.0% (95% CI, 63.7%-70.2%) and 4.8% (95% CI, 3.2%-6.4%), respectively. 95% CIs were constructed based on 1,000 bootstrap iterations; (C) CART-predicted probability distribution of being colorectal cancer (CRC) in the training set. Vertical dashed line shows that the cutoff probability is 0.48 yielding 99.0% specificity; (D-F) Similar figures as Figure 2A-C when applying the same models to test set.(D) P<0.001 for two-tailed Delong's test between the two ROC curve; (E) Dashed lines show that the sensitivities at the 99.0% specificity of the CART and age models are 62.2% (95% CI, 58.1%-66.2%) and 3.73% (95% CI, 2.42%-5.04%), respectively; (F) Vertical dashed line shows that the cutoff probability is 0.48 yielding 99.0% specificity.
In order to ensure that the CRC and control groups are comparable for sample collection period, we selected the subset of PUCH data in which the CRC cases and controls were both from 2010 to 2014 and performed training and testing of the CART model. The final CART model consisted of the same four biomarkers as before: Age, Alb,HCT and LYMPH%. AUCs were almost the same as the previous results using the whole data (Supplementary Table S2). At the 99.0% specificity, sensitivities were also almost the same as the previous results using the whole data(Supplementary Table S2). Therefore, we have demonstrated that our results were little affected by the time periods of sample collection.
Robustness and generalization of CART model
Next, we examined whether the CART model could be applied to the general population with diverse characteristics. First of all, we applied the CART model to randomly sampled subsets of the test set with different class ratios varying from 1:10 to 1:10,000. Surprisingly, these imbalanced sample-class ratios (41) resulted in highly uniform AUCs and sensitivities at the 99.0% specificity(Figure 3A), which demonstrates that the CART model will be effective for different regions with various CRC incidence rates.
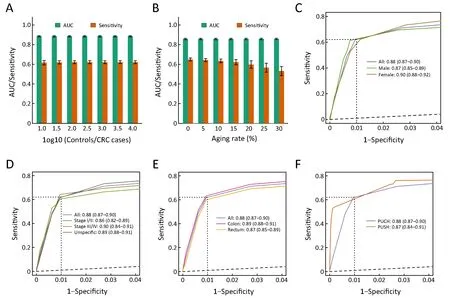
Figure 3 Robustness and generalization of classification and regression trees (CART) model. (A) Area under the curves (AUCs) and sensitivities at 99.0% specificity of CART model on subsets of test set with different sample-class ratios. Every bar shows the mean of 1,000 random samples. Error bar is standard error derived from these 1,000 random samples; (B) Similar figure as Figure 3A for subsets of test set with different proportions of elderly individuals; (C) Gender-specific receiver operating characteristic (ROC) curves. Three solid curves show CART model's performance on the whole test set (All), male subset (Male) and female subset (Female), respectively. Values shown are AUCs as well as 95% confidence intervals (95% CIs). Dashed lines highlight the sensitivities at the 99.0% specificity; (D,E) Similar figures as Figure 3C for tumor stage-specific (D) and tumor location-specific (E) subsets of test set; (F) Data source-specific ROC curves. Peking University Cancer Hospital (PUCH) curve shows the final CART model's performance on the test set of PUCH. Peking University Shougang Hospital (PUSH) curve shows the performance of CART model, trained from the 70% of PUSH data set, on the remaining 30%of PUSH data set. All P>0.05 for two-tailed Delong's test between any two ROC curves within the same panel. CRC, colorectal cancer.
In addition, previous studies indicated that the incidence rate of CRC increased with age (42). To determine age's effect on this model, we applied the CART model to randomly sampled subsets with different proportions of elderly cases who were more than 60 years old. The results showed that the CART model still had good predictive power especially for groups with aging rates less than 20%(Figure 3B), which indicates that the CART model can be effective in almost all developing world and some developed countries.
Next, we showed that the CART model's performance on only male or female subsets were almost as good as the whole test set, which indicates that the CART model was less affected by gender factor (Figure 3C, Supplementary Figure S2A). Similarly, we demonstrated that the CART model can detect both early-stage (stages I/II) and advanced-stage (stages III/IV) CRC, and detect specifiedstage as well as unspecified-stage CRC with similar performances (Figure 3D, Supplementary Figure S2B). We also showed that the CART model had no predicted bias for CRC locations (Figure 3E, Supplementary Figure S2C).In addition, we found the CART model has slightly better sensitivity for proximal colon neoplasia than distal colon neoplasia (Supplementary Table S3).
Importantly, influenced by specific instrument and reagents used, the values of lab test biomarkers were not always comparable across hospitals (Supplementary Figure S3). Sometimes, the reference values of the same biomarkers were different between PUCH and PUSH.Therefore, the CART model trained from PUCH could not be directly applied to PUSH. In order to test this approach's applicability across different data sources, we trained another CART model using the same four markers (Age, Alb, HCT and LYMPH%) on the 70% of PUSH data set, and tested its performance on the remaining 30%of PUSH data set. For PUSH, we obtained similar AUC(0.87, 95% CI, 0.84-0.91) and sensitivity (60.8%, 95% CI,53.1%-68.4%) at the 99.0% specificity, indicating the CART model performed well on the PUSH (Figure 3F,Supplementary Figure S2D). Taken together, the CART model was applicable to different populations with diverse CRC incidences, aging rates, genders ratio, distributions of tumor stages and locations, and data sources.
Comparative effectiveness of CART-based screening relative to stool-based screening
The CART model can predict a high-risk group for CRC from the population who received regular health examination, which likely contains a higher proportion of non-symptomatic or early-stage CRC cases than the general population. This provides a framework for enriching CRC cases from the general population using regular health examination data. Assuming the CRC incidence rate is 25 per 100,000 in one region(Supplementary Figure S4A), the CART model will predict a high-risk group that contains 16 CRC cases (62.2%sensitivity) and 1,000 CRC-free individuals (99.0%specificity) from a population of 100,000 individuals(Figure 2E, Supplementary Figure S4B). The proportion of CRC cases in this high-risk group (16 per 1,016) represents a 63-fold enrichment relative to in the region's population(25 per 100,000).
We next considered how the CART model compares with the stool-based tests for enriching CRC cases. Guaiac fecal occult blood test (gFOBT) is a vital criterion for clinical diagnosis of CRC (43) that has only 33.3%sensitivity at 95.2% specificity (19). Compared with gFOBT, fecal immunochemical test (FIT) has higher sensitivity for adenomas and cancers by specifically detecting human hemoglobin and does not require dietary restriction before test, thus having higher participation(44,45). For quantitative FIT, a lower cut-off increases the detection of advanced neoplasia but lowers the specificity thus demanding more follow-up colonoscopy (46).
Previous study showed that the specificity of FIT is 94.0% at the 79.0% sensitivity (47). Due to the very low prevalence of CRC, the CART model had a much higher positive predictive value over FIT screening (1.6% vs.0.3%) (Table 3), which greatly enriches the CRC cases and reduces the cost of follow-up tests such as colonoscopy.The theoretically calculated FIT's enrichment factor for CRC cases was 13-fold, lower than the CART model's 63-fold enrichment factor. In addition, we plotted ROC curve of FIT by public studies (19,48-52) (Supplementary Table S4) and showed that the sensitivity of FIT was only 25.0% at the 99.0% specificity, although FIT had the slightly higher AUC than the CART model (0.90 vs. 0.88)(Figure 4, Supplementary Figure S2E). Taken together,CART-based screening is more effective than stool-based screening.
Discussion
CRC screening programs have been established in many western countries and paid for by health insurance.However, in developing countries such as China, which have huge populations, relatively weak economic foundations and unbalanced regional development,nationwide CRC screening is cost-prohibitive and full compliance is difficult to realize. In this study, we utilized widely-adopted regular heath examination data in China todevelop a statistical classification model that can identify high-risk cases for CRC from the general population. Such routine lab test data are currently available to individuals who participated in physical health examinations but are not largely used for pooled analysis. Therefore, our approach does not incur additional examinations, which would improve screening compliance with little cost (53).

Table 3 Comparison of CART model and FIT
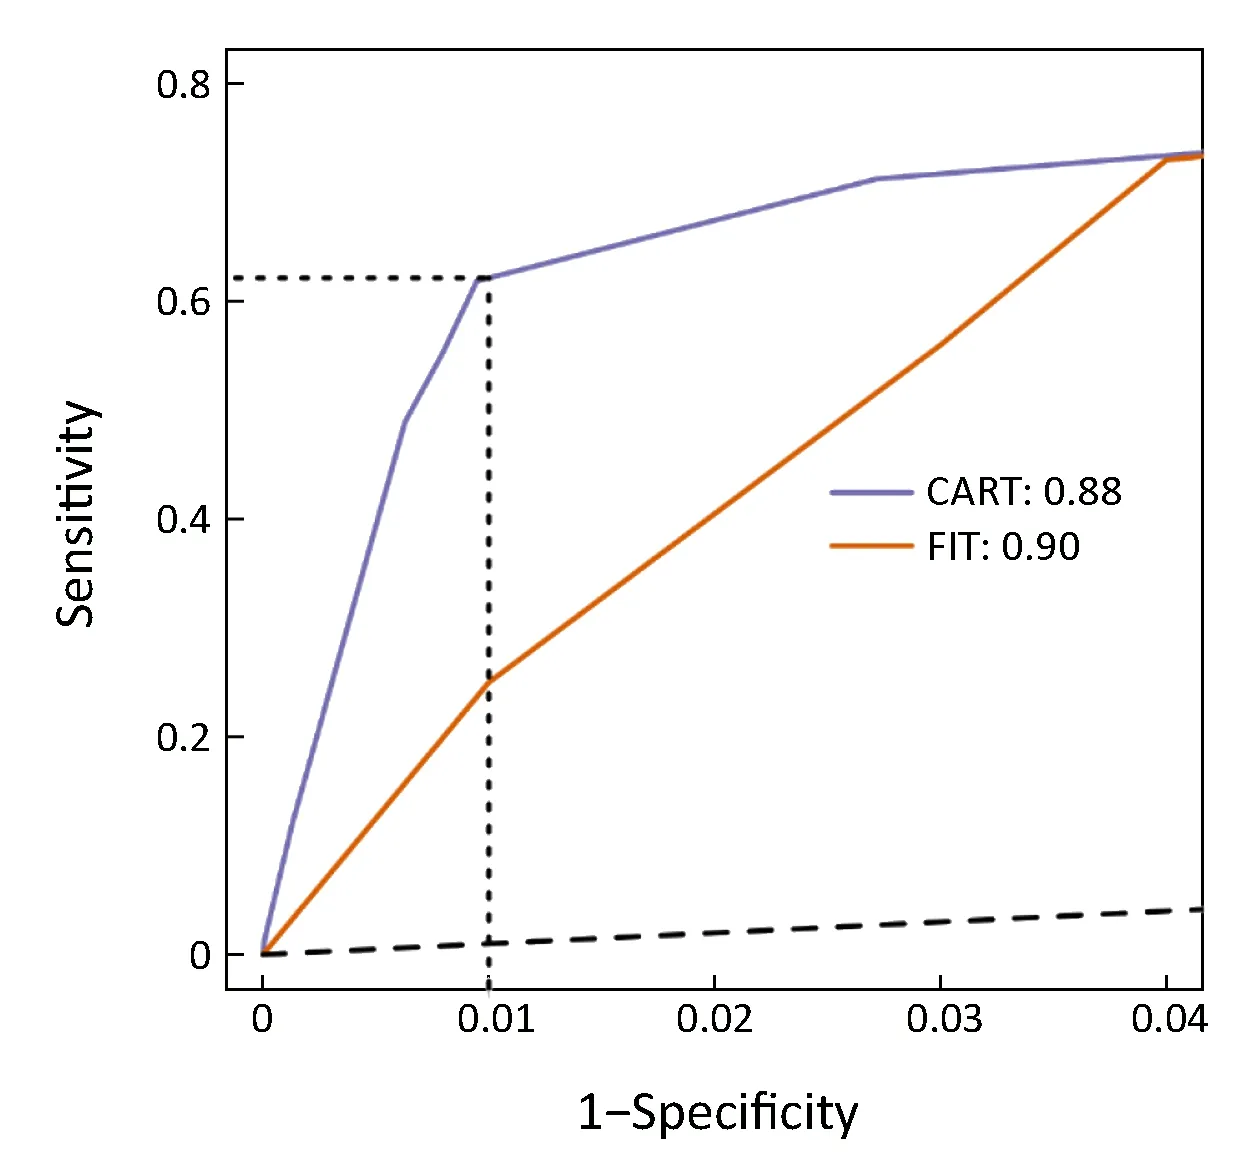
Figure 4 Comparison between classification and regression trees(CART) model and fecal immunochemical test (FIT). CART model from Peking University Cancer Hospital (PUCH) was shown on test set, while FIT curve was plotted by public studies.
Specifically, the CART model we constructed showed high AUC (0.88, 95% CI, 0.87-0.90) and sensitivity(62.2%, 95% CI, 58.1%-66.2%) at the 99.0% specificity,and performed equally well in subpopulations stratified by multiple CRC incidences, aging rates, genders, tumor stages and tumor locations. In other words, we achieved a 63-fold enrichment of CRC cases in the high-risk group identified by the CART model. Therefore, compared with previous models (27-32), the CART model has stronger discriminatory power and better generalizability.
In current CRC screening practices, stool-based tests such as gFOBT and FIT, or one-time screening with both FOBT and sigmoidoscopy, can identify subjects at risk for colorectal neoplasms from large populations (7,18).However, false positive results are the big challenge. Due to the very low prevalence of CRC, the CART model has a much higher positive predictive value over FIT (1.6% vs.0.3%) thus a higher enrichment for CRC than FIT screening (63- vs. 13-fold) (47), which greatly reduces false positive cases who need further examinations. Therefore,CART-based screening significantly reduces the cost of follow-up tests such as colonoscopy, which is crucial in regions with limited colonoscopy resources (19).
Colonoscopy is a common confirmative CRC screening strategy, but it is also the most invasive method with the highest cost and risk of complications (43). Therefore, we propose the two-step CRC screening procedure (13), in which only individuals predicted to be CRC positive by the CART model receive follow-up invasive examinations. The first step uses regular physical health examination data free of CRC-specific costs, and follow-up colonoscopy recommended by CRC specialists can be covered by healthcare insurance systems.
Besides, compared with other mathematical models for screening or enriching CRC cases (27-32), the CART model excels at handling missing values and imbalanced classification problems. These are particularly relevant in this CRC enrichment study since not all individuals received a full spectrum of biomarker tests in their physical health examination and the sample numbers of CRC cases and controls were not balanced. We tested the final CART model using data subsets with different sample-class ratios between the CRC and control groups and obtained similar performance. In addition, there may be unidentified CRC cases in controls. However, given the very low prevalence of CRC (25 per 100,000), the few CRC cases (estimated to be 33 CRC cases in the 133,898 controls) have little effect on overall distributions of lab test biomarkers and are therefore not likely to affect the overall performance of the CART model.
The final CART model trained from the PUCH data set consisted of only four biomarkers: Age, Alb, HCT and LYMPH%. Compared with previous studies (27-32), the number of variables in the CART model is smaller,reducing the likelihood of overfitting and enhancing the model's generalizability. Meaningfully, all four biomarkers showed statistically significant differences and large effect sizes indicating clinical significance between the CRC and control groups. Moreover, these biomarkers cover different aspects of human physiology such as blood counts and specific proteins, facilitating the interpretation of the CART model and being informative for CRC screening practices. These changes are consistent with increased proinflammatory cytokines and growth factors in response to high physiological stress and hypoxia in cancer tissues(54,55), which modulates the production of albumin (56).During an acute inflammatory response, the ratio between different leucocyte subsets is altered, and there is a neutrophilia often accompanied by a relative lymphocytopenia (57). To our knowledge, our study is the first to incorporate these changes in a multivariate CRC enrichment model.
There are several limitations in our study. First, our approach is dependent on data from routine physical health examinations and is not applicable to the populations that do not participate in such examinations. Such populations may be at higher risk for CRC due to less access to early screening and health facilities. Second, the CART model was trained using quantitative values in routine lab test biomarkers. However, influenced by specific instrument calibration, the values of lab test biomarkers may not be entirely comparable across medical institutions. In the future, we will implement prospective validation for this approach and study how to normalize data from different facilities.
Conclusions
As an alternative approach for the early detection of CRC,this study utilized regular health examination data to identify high-risk groups for CRC with no additional examination cost, and this approach is applicable to populations with diverse characteristics. Overall, this study provides a novel approach for CRC screening to trigger follow-up invasive examinations for definite diagnosis,which may improve the CRC screening efficiency especially in the developing world.
Acknowledgements
This study was supported by funding from Beijing Municipal Science & Technology Commission, Clinical Application and Development of Capital Characteristic(No. Z161100000516003) and National Natural Science Foundation of China (No. 31871266). We also thank Dr.Xianjin Xie (the University of Iowa) for critical advice, and the high performance computing platform of the Center for Life Sciences, Peking University.
Footnote
Conflicts of Interest: The authors have no conflicts of interest to declare.
杂志排行
Chinese Journal of Cancer Research的其它文章
- Chinese guidelines for diagnosis and treatment of melanoma 2018 (English version)
- An update on biomarkers of potential benefit with bevacizumab for breast cancer treatment: Do we make progress?
- Association of cancer prevention awareness with esophageal cancer screening participation rates: Results from a populationbased cancer screening program in rural China
- FAT1, a direct transcriptional target of E2F1, suppresses cell proliferation, migration and invasion in esophageal squamous cell carcinoma
- Clinical significance of MET gene amplification in metastatic or locally advanced gastric cancer treated with first-line fluoropyrimidine and platinum combination chemotherapy
- A 18FDG PET/CT-based volume parameter is a predictor of overall survival in patients with local advanced gastric cancer
