Shadow-highlight feature matching automatic small crater recognition using high-resolution digital orthophoto map from Chang'E Missions
2019-09-06WeiZuoChunlaiLiLingjieYuZhoubinZhangRongwuWangXingguoZengYuxuanLiuYayingXiong
Wei Zuo· Chunlai Li · Lingjie Yu · Zhoubin Zhang · Rongwu Wang ·Xingguo Zeng · Yuxuan Liu · Yaying Xiong
Abstract This paper introduces a new method of small lunar craters’ automatic identification, using digital orthophoto map (DOM) data. The core of the approach is the fact that the lunar exploration DOM data reveal contrasting highlight and shadow characteristics of small craters under sunlight irradiation. This research effort combines image processing and mathematical modeling.Overall it proposes a new planetary data processing approach, to segment and extract the highlight and shadow regions of small craters,using the image gray frequency (IGF) statistical method.IGF can also be applied to identify the coupling relationships between small craters’ shape and their relative features. This paper presents the highlight and shadow pair matching (HSPM) model which manages to perform highprecision automatic recognition of small lunar craters.Testing was performed using the DOM data of Chang’E-2(CE-2). The results have shown that the proposed method has a high level of successful detection rate. The proposed methodology that uses DOM data can complement the drawbacks of the digital elevation model(DEM)that has a relatively high false detection rate. A hybrid fusion model(FUM) that combines both DOM and DEM data, was carried out to simultaneously identify small, medium, and large-sized craters. It has been proven that the FUM generally shows stronger recognition ability compared to previous approaches and it can be adapted for high precision identification of craters on the whole lunar surface.The results meet the requirements for a reliable and accurate exploration of the Moon and the planets.
Keywords Moon·Crater recognition·Image processing·Space exploration
1 Introduction
Exploring space and recognizing the universe is the unchanging pursuit of mankind. China’s lunar exploration project adopts a three-step strategy of circling,landing,and returning.It has successfully achieved the tasks of orbiting the Moon, landing on the Moon, and patrolling the Moon by employing the Chang’E-1, Chang’E-2, and Chang’E-3 detectors. In May 2018, the Chang’E-4 relay star was successfully launched, whereas the Chang’E-4 detector will be launched at the end of 2018. Humans’ first soft landing on the dark side of the Moon and relative inspection can be achieved using a combination of a lander, a patrol, and an L2 point relay star. In 2019, the Chang’E-5 detector will be launched to realize the task of automatic sampling the surface of the Moon and returning to the Earth.The first Mars probe will be launched in 2020,and it will arrive in Mars in 2021, completing the three major tasks of circling, falling, and patrolling. Based on the experience and on the tasks performed by the Chang’E-4 and Chang’E-5, the follow-up lunar exploration mission is under rapid development. Three missions have been planned to take place by 2030, aiming to build the basic architecture of a lunar research station.
CCD stereotype cameras carried by Chang’E-1 and Chang’E-2 have obtained 100% data detection coverage for the whole Moon. It is clear from the acquired images that there are craters of different sizes and that they are densely distributed on the surface. A crater with its distinctive features is the most widely distributed land type on the Moon’s surface. Craters’ identification (CRI) has always been a hot research topic in the field of lunar and planetary science. Information such as the number (Neukum et al. 1975, 2001; Michael 2003; Shylaja 2005;Sawabe et al. 2006), the distribution (Sto¨ffler and Ryder 2001; Morota and Haruyana 2008; Hiesinger et al. 2010),and the morphology(Craddock and Howard 2000,2011)of the craters are of great significance for studying the history of impacts and the evolution of the Moon,using geological unit chronology.The automatic CRI using DOM is divided into two categories: The first is related to curve fitting(CUF),and the second to machine learning(ML).The CUF methods include template matching, based on (a) edge detection (Magee et al. 2003; Barata et al. 2004; Bandeira et al. 2007), (b) ellipse fitting (Cheng et al. 2003; Salamuniccar et al. 2011), (c) hough transform (Jahn 1994;Kim and Muller 2003), and their relative improved versions (Bruzzone et al. 2004; Flores-Me´ndez and Suarez-Cervantes 2009). ML methods mainly include genetic algorithms (Plesko et al. 2006; Bierhaus et al. 2001; Bue and Stepinski 2007), supervised learning (Wetzler et al.2005), support vector machines (Stepinski et al. 2009;Emami et al. 2017; Sto¨ffler and Ryder 2001; Urbach and Stepinski 2009), decision tree algorithms (Urbach and Stepinski 2009),and Neural networks(Vijayan et al.2013;Hao et al. 2018; Emami et al. 2015; Cohen et al. 2016).
The data used for crater recognition are divided into two categories, namely: digital orthophoto map and digital elevation model data. The DOM is advantageous over the DEM ones in terms of resolution. Theoretically, they can be used for the identification of a larger number of craters with smaller sizes.However,the data is greatly affected by factors such as (a) The solar height angle during imaging and(b)The complicated shape and structure of the craters.Noise in the image data might bring difficulties to automatic identification. The CRI algorithm based on optical images is computationally complex and highly specific.The DEM data can objectively and directly reflect the morphological characteristics of the crater,which include a large number of topographic information such as profile and depth. They can establish a multi-parametrical information extraction model that can lead to the recognition of a crater. However, since the resolution of the DEM data is much lower than that of the optical image ones, the DEM approach leads to a higher false detection rate, and moreover, it results in a high missed detection rate for the case of small ones. Given the advantages and disadvantages of DOM and DEM data and aiming in the identification of full-circle shaped craters, we have employed DEM to recognize large and medium-sized craters and DOM to recognize the small-sized ones., In this paper, we proposed a comprehensive solution for high-precision identification of the full-circle craters. This is achieved by combining the recognition results of the two methods.Since the DEM based CRI for contour reconstruction of the Moon surface has been elaborated in previous papers, we have focused on the use of high-resolution DOM data to automatically identify small craters.
Compared with large and medium-sized lunar craters,the smaller ones exhibit more obvious patterns and characteristics. They are relatively intact, uneven and less eroded, mostly in the form of a bowl-like structure. They have high depth displacement between the edge and the bottom, and they have a large depth-to-diameter ratio.Therefore, due to the different direction of the reflected light inside the crater, there exist obviously shaded and highlighted areas along the illumination direction of the images, forming shadow–brightness patterns as shown in Fig. 1. In this paper, we introduce a new automatic lunar crater recognition method based on the obvious features of small craters by using DOM data from Chang’E missions.
2 Data
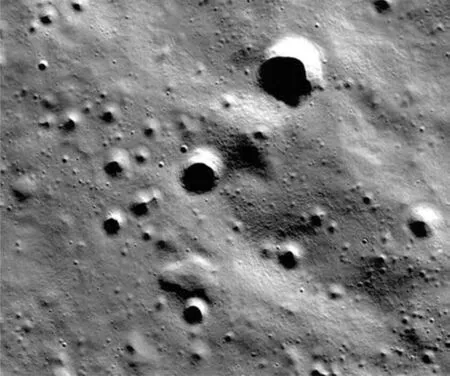
Fig. 1 High-resolution DOM image of small craters
The satellite Chang’E-1 was launched on October the 24th,2007. Its main task was to realize global and comprehensive circumlunar exploration. Chang’E-2 was launched on October 1st, 2010, and its main tasks were to investigate the global lunar, to search the Chang’E-3 landing site, as well as to perform detailed surveying and mapping of the lunar global topography. Chang’E-1 and Chang’E-2 have collected abundant lunar exploration data. The Charge Coupled Device(CCD)stereo camera carried by Chang’E-1 captured the three-line array stereoscopic image in a spatial resolution of 120 m. This data was used by the Ground Research and Application System (GRAS) of the Chinese Lunar Exploration Program (CLEP) which produced the global DOM and DEM of the Moon, with a spatial resolution of 120–500 m respectively,with a spatial precision equal to 192 m (1σ), and with an elevation precision equal to 120 m(1σ).The CCD stereo cameras taken by Chang’E-2 have captured the image of Chang’E-3 landing site at the perilune, with a height of 15 km. The resolution of the two-line array stereoscopic image was better than 1.5 m. The camera also captured the global lunar image from the circular orbit at a height of 100 km.The resolution of these images was 7 m. The global adjustment work was done by considering the parameters of Chang’E-2 satellite orbit and the position data,as well as the 5 lunar absolute control points.Additionally,the GRAS produced the global lunar DEM and DOM data in the spatial resolution of 7, 20, and 50 m. Compared to the available international lunar data, Chang’E-2 global lunar DEM and imagery data are advantageous in terms of spatial resolution,consistency,integrity,and mosaic precision.
According to this approach, we have used the global lunar DOM (120 m) and DEM (500 m) from Chang’E-1 three-line array cameras,and the global lunar DOM(50 m)and DEM (50 m) from Chang’E-2 two-line array cameras(see Table 1).All of this data has been released in the Data Release System of CLEP, and any registered users are allowed to access and download them from the website(http://moon.bao.ac.cn).The Chang’E-1 data were used for the development and debugging of algorithms,whereas the Chang’E-2 ones were mainly used in the experimental test described below.
Since the data volume is too big,the lunar global data is organized according to the longitude and latitude subdivision method, and they have been divided into three parts namely: (a) data between 70°S and 70°N, (b) North Pole data, and (c) South Pole ones. The data from 84° to 90°(both in North and South latitude) was assigned to an independent map division. The latitude interval was equal to 14°for the data between 84°S and 84° from the equator to the pole. On the other hand, the longitude interval was 45°, 30°, 24°, 20°, and 18° for the direction from high latitude to the equator. The data between 70°S and 70°N was divided into 170 map divisions, whereas the ones of the North and South Pole was divided into 9 map divisions respectively. Separate map divisions used different projection methods. Table 2 and Fig. 2 give the longitudelatitude extent and subdivision code for each map division.
3 Crater detection methodology
The flow for identifying smaller craters based on DOM data is shown in Fig. 3. First, we used the shadow and highlight field feature patterns of the smaller sized craters under sunlight irradiation in the DOM data, in order to extract all the possible highlight and shadow areas. This process includes pre-selection, marking and filtering the target area. After the extraction, we used morphological relationships to achieve feature matching between highlight and shadow areas. This process includes feature prematching, illumination direction recognition, and directional matching. Finally, after the calculation of the purity and unevenness of each pair of shaded and highlighted areas in a specified range, non-craters were removed. The CRI result was optimized to realize the identification of the smaller craters.
3.1 Extraction of shadow and highlight areas
3.1.1 Pre-selection of shadow and highlight areas
For digital images, the difference between highlighted and shaded areas is that there is a significant difference in the gray level. In the image data obtained by the CE-2’s twoline camera, the illumination conditions between the images were different due to different solar illumination angles and different image capture times. The difference in imaging brightness between separate areas of an image,was also large, due to the variations in height and angle.The commonly used binarization threshold segmentation method cannot accurately extract the highlight and shadow regions in images that are obtained from different regions and under different illumination conditions. Therefore, weused a ternary method based on gray frequency statistics to extract highlighted and shaded areas. First, the histogram of the gray distribution of the interval[0,255]was counted.When the gray scale frequency distribution value was<5%, the [0, Td] interval was set as the shaded area (Td was the initial threshold of the shaded area), and when the gray scale frequency distribution value was >90%, the interval [Tb, 255] was set as the highlighted area (Tb was the initial threshold of the highlighted area), as shown in Fig. 4. After that, the iterative threshold method was used to determine the interval[0,Td]and the interval[Tb,255],respectively. Then, Td and Tb were obtained. After the threshold segmentation, the image data was divided into shaded areas [0, Td], highlighted areas [Tb, 255], and background ones, as shown in Fig. 5.

Table 1 Experimental data list used in this approach

Table 2 The division specitication of data
3.1.2 Marking of highlight and shadow areas
After the extraction of highlighted and shaded areas, they were marked in order. In this research, each highlighted and shaded area was marked and numbered using the Recursive Image Connected Region Detection (RICRD)algorithm.In an image map,each target pixel has two flags:connected area mark and equivalence mark. The equivalence mark is a criterion that determines whether the target pixel and the other ones from surrounding areas belong to the same connected area. The target pixel to be the highlighted and the shaded areas were set and marked separately. Take the highlighted area as an example. The algorithmic steps for marking were as follows:
1. The image is scanned from top to bottom and from left to right. If the pixel in the upper left corner of the image is a highlighted area (HA), then the connected areas marked with pixels are numbered as 1.
2. Scan the other pixels in the first line. Each time a new highlighted area A is scanned,refer to pixel Alefton its left. If Aleftis also a HA, assign the connected area(COA)the number of Aleftto A as the flag of the COA;If Aleftis a non-HA(background point or shaded area),the connected area number is incremented by 1, and the number value is assigned to A as the COA’s mark number.
3. From the second line, continue to scan the remaining pixels in the image.
(a) For the first column of pixels in each row,if it is a new highlighted region,refer to the two pixels which are above it (Aup) and right to it (Aright),respectively. If neither Aupnor Arightis a HA,then the number of the COA is increased by 1.If only one of the pixels Aupand Arightis a highlighted area, then the COA number of the pixel in the HA is assigned to A as a flag of the connected area. If both Aupand Arightare highlighted areas and the connected area numbers are inconsistent,the connected area number of Aupis assigned to A as a flag of the connected area, and record the equivalent marks of the three pixels A, Aup, and Arightas the same number.
(b) For a pixel in the middle column, if it is a new HA, find the connected area number of the first HA from its surrounding pixels in the order leftupper-right,as the flag of the COA.The marking method is the same as in case a.

Fig. 2 The subdivision grid of 7 m DEM. a North Pole and South Pole, b map division from 70°N to 70°S

Fig. 3 Method flowchart of recognizing craters based on DOM data
(c) For pixels in the last column, if it is a new highlighted area, mark it in order of its left and upper pixel.The marking method is the same as in case a.
4. After the repeated scanning,all the highlighted areas in the image are marked with connected areas. There are pixels with different COA but the same equivalent marks, indicating that the pixels belong to the same connected area. Scan the image again, the marking number of the connected area is modulated by combining the equivalent mark of the pixel, so that the same COA has the same marking number, and the final mark of the COA is obtained (see Fig. 6).
5. Set the target pixel to shadow area and repeat steps 1–4.

Fig. 4 Highlighted and shaded initial threshold in the grayscale histogram

Fig. 5 Illustration of the threshold segmentation of DOM data (the shaded area is shown in blue;the highlighted area is shown in red,and the background is shown in white)
3.1.3 Filtering the target areas
The range for CRI is a small circular pit with a diameter in the range of [0.5, 10] km, so it is essential to remove the objects with oversized and undersized areas.Elimination of such objects can be achieved by calculating the area of each highlighted and shaded area. Take the Chang’E-1’s full Moon DOM data as an example, the resolution of the image is 500 m and the identification range is[0.5,10] km in diameter. Set the filtering threshold of the highlighted and shaded area to [2, 1200], that is, to filter out samples with an area below 2 pixels and above 1200 pixels, or samples with an area below 0.5 km2and above 300 km2.The extraction results of the HA and shaded areas after filtering are shown in Fig. 7.

Fig. 6 The final marking result of the highlighted area
3.2 Matching of shadow and highlight areas
3.2.1 Pre-matching of the image features
Feature matching is to match a shaded area with an HA in terms of features and to form a crater to be identified. The selection of eigenvalues is an important factor that affects the matching degree. In this paper, we adopt the following procedure. First, choose a shaded area (SHA). By calculating the feature matching factors between the candidate HA and the selected shaded region, such as the one matching and the center-of-gravity distance, select an HA with the highest match to pair it with the SHA and mark it,as shown by the green circle in Fig. 8.

Fig. 7 The result of filtering

Fig. 8 Pre-matching results of the highlighted and shaded areas using DOM (green circles represent the matched ones)
The process of selecting eigenvalues is as follows:
1. Select a shaded area; calculate its center of gravity(Cd), its area (Sd), the circumscribed rectangle length(Ld), and height (Hd).
2. Taking Cd as the center, the candidate highlighted region is determined in the vertical range within± 3Hd, and in the horizontal range within ± 3Ld;calculate the area of the candidate HA (Sb).
3. Based on the distribution data of Sb/Sd,set the range of the ratio of the candidate highlighted area to the shaded area (0.1 <Sb/Sd<3).
4. Select the optimal candidates that are within the range of the area ratio (Sb/Sd). The one with an area that is closest to the selected SHA(the one whose Sb/Sdvalue is closest to 1) is the best-matched HA. A one-to-one match between the two areas is realized. The matched highlighted and shaded areas are marked.
Using this method, all the HA and SHA that meet the matching conditions are searched in the whole image, and the matching results of each pair are shown in Fig. 9.
3.2.2 Identification of the illumination direction
The recognition of craters using a DOM image is based on the shaded area and highlighted area caused by the illumination on the lunar terrain. However, in the process of recognizing the full Moon image, the sun’s illumination intensity and direction are different for craters at different positions on the Moon. For a random image, the illumination direction is unknown. If the direction of the solar illumination is not determined, it will cause a wrong matching for shadow and highlighted areas. In order to improve the correctness of the matching, we matched the illumination direction in the image, based on the prematching of the image features.
First, we need to identify the direction of the sun in the image.The direction of the sunlight is categorized into four groups namely: upper left, upper right, lower right, and lower left. The distribution of the center of gravity of the HA and SHA changes according to the direction of illumination.As shown in Fig. 10,the center of gravity of the highlighted area is at the upper right of the shaded area,indicating that the direction of the sunlight is upper right.

Fig. 9 Feature pre-matching results of the highlighted and shaded areas (green circles represent the matched ones)
In an image, if the direction of the sunlight is upper right,the pre-matched identified crater will exhibit features that most highlighted areas are in the upper right of the shaded ones. Record the positions of the center of gravity of the HA and SHA of the crater, identified by prematching in an image, and accumulatively count the number of craters in the four illumination directions. The direction in which we find the highest total number of craters is the direction of the sun’s illumination. As shown in Fig. 11,the number of craters identified by pre-matching in this graph is counted for four directions. The statistical result shows that the number of craters in the upper right of the shaded area is the largest, therefore, it can be determined that the illumination direction in this image is upper right. In the next step of direction matching between the HA and SHA, the constraint condition that the highlighted area is in the upper right of the shaded one can be used for matching.

Fig. 10 An example of DOM data in which the sunlight direction is upper right

Fig. 11 Statistics of craters identified by pre-matching in different illumination directions using DOM
3.2.3 Matching of direction
After the determination of the illumination direction in the DOM data, the illumination direction restriction condition is set to match the highlighted area and the shaded one again. Direction matching uses the area and illumination direction as matching features. The matching process is similar to the pre-matching process. Steps 1, 3, and 4 are consistent with feature pre-matching and only step 2 is different. Taking the center of gravity (Cd) of the SHA as the center, search the candidate HA in terms of the illumination direction within the constraint condition, and calculate the area of the candidate HA (Sb). (For example,if the illumination direction is upper right,the HA is set to the upper right of the SHA).
The direction matching can eliminate the pseudo craters identified by the pre-matches, as shown in Fig. 12. The results of the direction matching for the entire image are shown in Fig. 13.
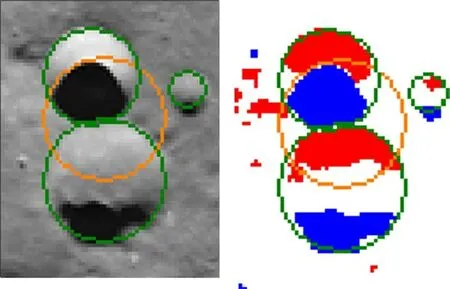
Fig. 12 Elimination results of the pre-matched pseudo craters by direction matching(the green circle marks the result of the direction matching, and the orange circle marks the craters identified by the feature prematches but not identified by the direction matching)

Fig. 13 The result of direction matching
3.3 Optimization of the recognition results
After the matching between the HA and the SHA is completed, the targets to be identified are formed by the corresponding highlighted and shaded areas (Fig. 14). Since other terrains on the surface of the Moon also produce SHA and HA in the craters to be identified due to the sun’s illumination,there are some non-craters which are not well matched. These non-craters have unclear boundaries between the highlighted and the shaded regions, and they are easy to become intertwined with other areas (Fig. 15).In fact,they are targets that we do not need to identify.It is necessary to screen these targets by calculating parameters,such as the unevenness of each pair of highlighted and shaded areas within a specific range.
The algorithmic steps are as follows:
1. Calculate the center of gravity of the highlighted area Cb;
2. Calculate the center of the circle O, O is the midpoint of Cband the shaded area;
3. Calculate the maximum long axis of the area formed by the HA and SHA, which is the diameter Dbd;
4. In the range where O is the center and Dbdis the diameter, the sum of the areas of all the highlighted and shaded fields (S) is calculated, and the area of the circle (S0) is calculated;
5. Calculate the area coverage ratio Kbd= (Sb+ Sd)/S,and the unevenness ratio kw= (S - (Sb+ Sd))/(Sb+ Sd).
When the area coverage ratio Kbd <0.2 and the unevenness kw >0.3,the target is regarded as a non-crater and is filtered out.

Fig. 14 The target craters to be identified

Fig. 15 Schematic diagram of non-craters
4 Results and discussion
To verify the detection ability of this method for small craters, we chose two blocks from CE-2 CCD image data with a 50 m resolution to test. Furthermore, we have performed a testing experiment combined with previous research on the DEM-based method (Zuo et al. 2016). We have carried out an experimental integration of the two methods to respectively identify small craters based on DOM data. Additionally, we have experimented with medium to large size crater identification,based on a DEM dataset of the same size.It is a fact that small craters with a diameter of several hundred meters are generally treated as secondary ones and they lack statistical significance in geochronology and other scientific research. Also, larger craters can be more efficiently identified by the DEMbased method. Considering these facts we finally set the craters’ detection diameter range to the closed interval [1,10] km for DOM data and to the closed interval [5,300] km for the DEM data respectively in the performed tests.
4.1 Test area #1
The area located inside crater Schro¨dinger, with its longitude between 123.4°E and 146.9°E and latitude between 73.4°S and 77.7°S, was chosen as the test area #1. Crater Schro¨dinger is a large crater of 312 km in diameter near the South pole,with a flat floor and a ring of central peaks.The area is surrounded by the central peaks ring and it was specifically chosen as our first test area for its typical morphology. The flat floor is densely covered with many small craters. The mountains form the central peaks ring,something that increases the complexity of the terrain, and a typical shadow–brightness pattern of craters is well presented under the sunlight.
In order to evaluate the detection ability of this method,we checked all the detection results of test area #1 manually,and we marked the correctly-recognized craters by red circles, the incorrectly-recognized ones by yellow circles,and the missed ones by blue circles(Fig. 11).We used a set of standard quantitative quality-assessment factors to evaluate the method’s detection ability: detection percentage D = TP/(TP + FN)*100%, the branching factor B = FP/TP, and the quality percentage Q = TP/(TP+FP + FN)*100%,where TP stands for the number of true positive detections, FP stands for the number of false positive detections, and FN stands for the number of false negative detections. The statistical result of test area#1 is shown in Table 3, and the marked result is shown in Fig. 16.
4.2 Test area #2
Test area #2 is a block from Chang’E-2 CCD image product with its subdivision number of E002,whose longitude ranges from about 149.2°W to 160.1°W and latitude ranges from about 34.1°N to 42.1°N. The area is located in the mid-latitude region of the north part of the Moon with high terrain fluctuation and heavily erosion,many craters in this area are overlapping, and their shape integrity is low,presenting a high degree of complexity in terms of morphology.
After the manual detection performance for the test area#2, the corresponding statistical result of test area #2 is shown in Table 4, and the marked result is shown in Fig. 17.
4.3 Test for fusion method combining both data types
The aforementioned test results indicate that the method described in this research paper shows a high level of successful detection rate in the case of small craters with a diameter range of[1,10] km.In order to further verify the validity of the method, we combined the DOM-based method with the DEM-based one (Zuo et al. 2016). The effort aimed to detect the small craters using the DOM data,and the medium plus large size craters considering the DEM ones. The data volume in both sets was the same.Afterward, we integrated the detection results of the two methods to evaluate the comprehensive detection ability.For this purpose, we selected CE-2 50-m resolution DOM and DEM data with the subdivision number of D003 (test area #3) as our test data.

Table 3 Statistical result in test area #1

Fig. 16 Detection results in test area #1
The DOM data was used to detect small craters with a diameter range of [1, 10] km, whereas the diameter range for the DEM data was specifically set to [5, 300] km in order to avoid the potential missing of craters with a diameter of about 10 km. The detection results of both cases were merged,and the overlapping results in the cases of a diameter in the range of[5,10] km, were numerically combined.This was done by using the distance calculation of the target groups in the two pattern spaces (this method is not discussed in this paper), and the final output for the test area #3 was finally obtained.
After the manual check for the detection result of test area #3, the statistical result of test area #3 is shown in Table 5, and the marked result is shown in Fig. 18.
4.4 Analysis of the method and testing results
In this research,a new data model for lunar crater detection is introduced.It is based on the obvious shadow–brightness pattern of small craters, which is usually developed under the sunlight. The main idea of this method is to segment and extract the highlighted and the shaded regions of a small crater. This was achieved by employing the Statistic of Image Gray Values Frequency (a ternary-valued method) which was followed by the determination of the inherent constraint relationships between the highlighted and shaded regions of the craters. In this way, a pairing model of the two regions was established. The constraints include: (a) the ratio of the highlighted to the shaded area,(b)the ratio of center-of-gravity distance to the total area of the HA and SHA regions, (c) the aspect ratio of the circumscribed rectangle to the highlighted and shaded regions as a whole, (d) the area ratio of individual regions to the total area, and (e) the consistency of the illumination directions of the HA and SHA. Compared with the commonly used edge detection based algorithm,the method has the following advantages:(1)the extracted highlighted and shaded regions can be treated as the targets to be identified,without performing a series of complicated fitting calculations; (2) the constraint relationships for the shadow–brightness pairing model is simple and effective and can evaluate the characteristics of the small crater, making full use of the characteristics of the DOM data and consequently increasing the detection rate.

Table 4 Statistical result in test area #2

Fig. 17 Detection result in test area #2

Table 5 Statistical result in test area #3
The detection rate D = TP/(TP + FN)*100 and the quality percentage Q = 100TP/(TP + FP + FN)*100 can well evaluate the overall efficiency of the method. The detection rate has been designed to assess the capability of positive detection, and the quality percentage emphasizes the reduction of false detection. Our detection rates in the two test areas were 88.2%and 81.2%respectively,and the corresponding quality percentages were 80.7% and 67.4%.
Test area#2 had a lower detection rate than the test area#1 due to the high complexity of the terrain. However, the test results for both areas indicate that our method based on image data to identify craters reaches or even exceeds the mainstream detection rates and significantly reduces false detection up to a low level. Thus it has been proven that it is an effective method for detecting small craters. For example, the detection rate (DER) was 64.77% (Barata et al. 2004), the DER was equal to 60% (Wetzler et al.2005), DER was close to 80% (Sawabe et al. 2006), and finally DER was as high as 70% (Urbach and Stepinski 2009).
Additionally, in a global crater detection practice, this approach could be an important supplement to the DEMbased methods, which have high error rates and missed detection rates for small craters. This is obviously due to the lower resolution of the DEM data.
We have designed a fusion identification scheme that uses:(a)DEM data to identify medium to large size craters and (b) DOM data to identify small craters. In test #3, the detection results of the two methods on the two datasets(of the same size) were merged in order to produce the final outcome.The test results indicate that the two methods act in a complimentary way and they improve the overall detection rate.
5 Conclusion
Based on the CE-1 and CE-2 image data, this study introduces an innovative model for the detection of small craters, using the obvious shadow–brightness patterns developed by sunlight. The method has a high rate of successful detection, and the false detection rate is significantly minimized. Overall, this study introduces a fusion identification scheme that uses DEM data to identify medium to large size craters and DOM data to identify small ones. The complementary application of the two methods offers a strong and fast crater detection ability.The shortcomings of the method motivate our research team for future work. In the near future, we will develop new appropriate approaches capable to deal with the overlapping of multiple craters, and with the serious degradation of craters’ shape. We will also try to improve the efficiency and performance of the algorithm withhigher resolution image data. At the same time, emphasis will be given to the construction of a portfolio of customized methods, designed for different characteristics of craters.Such combo detection methods can be employed to develop a more comprehensive global craters database.

Fig. 18 Detection result in test area #3
AcknowledgementsFunding was provided by National Major Projects-GRAS Construction of China Lunar Exploration Project and Nation Science Foundation Project (No. 41671458).
杂志排行
Acta Geochimica的其它文章
- Equilibrium thallium isotope fractionation and its constraint on Earth's late veneer
- Kyanite far from equilibrium dissolution rate at 0-22 °C and pH of 3.5-7.5
- Quantifying the carbon source of pedogenic calcite veins in weathered limestone: implications for the terrestrial carbon cycle
- First-principles investigation of the concentration effect on equilibrium fractionation of Ca isotopes in forsterite
- Geological cycling of potassium and the K isotopic response:insights from loess and shales
- Adsorption characteristics of copper ion on nanoporous silica