Optimal Method of Extraction Process of Flavonoids from Ginkgo biloba
2019-08-26QunCHEN1LangTANGShitangMA
Qun CHEN1*, Lang TANG, Shitang MA
1. School of Pharmacy, Bozhou Vocational and Technical College, Bozhou 236800, China; 2. Anhui Science and Technology University, Chuzhou 233100, China
Abstract [Objectives] To optimize the extraction of total flavone in folium Ginkgo biloba leaves. [Methods] Using the ultrasonic extraction method, the three levels of maximum impact were selected by each factor selection, and the optimal extraction technology was obtained by box-benhnken test design analysis. [Results] After analyzing the results, the optimal process was as follows: a time of 28.89 min and liquid/material ratio of 31.38∶1, the temperature was 40.74℃. In this way, NaNO2-Al (NO3)3-NaOH was used as color developing agent, and the theoretical extraction of flavone in ginkgo leaf can reach 11.74 mg/g. [Conclusions] This method can be used to extract total flavonoids from G. biloba leaves with simple operation, low cost and good repeatability.
Key words Ginkgo leaf, Ultrasound extraction, Total flavone, Single factor, Response method
1 Introduction
Ginkgobilobais a ginkgo plant that existed in ancient times, and has a strong ability to adapt to the environment. Its leaves, fruits, and seeds all have high medicinal value.G.bilobais widely present in Anhui, Sichuan, Hebei, Guangxi, Shandong and other places[1-2].
With the continuous development of the times, the pharmacological effects ofG.bilobahave been continuously discovered. It contains natural active flavonoids and other components, which have a variety of pharmacological effects such as diastolic blood vessels, improvement of blood lipids, anti-blood coagulation, anti-inflammatory, swelling, and anti-tumor[3],etc. Tea soaked in ginkgo leaves for a long time can activate blood stasis, pass through meridians, and reduce blood lipids. It plays a good role in the prevention and treatment of patients with cardiovascular and cerebrovascular system diseases, and has a good effect on people who lose weight[4-5]. The best extraction conditions for total flavonoids inG.bilobaleaves were obtained by orthogonal method as follows: power 160 W, liquid/material ratio 15∶1, temperature 35℃, ethanol concentration 65%, time 10 min, extraction times 2 times. Under these conditions, the extracted flavonoids accounted for 93.65 % of the total flavonoids inG.bilobaleaves. In the research of Du Ruoyuanetal.[6], the best conditions for ultrasonic extraction of total flavonoids inG.bilobaleaves by orthogonal method were as follows: ethanol concentration was 60 %, liquid/material ratio was 50∶1, extraction time was 30 min, and the extraction rate was 8.075 mg/g under this condition.
In this paper, the ultrasonic extraction method was chosen, and 60% of the ethanol solution was used as a solvent. TheG.bilobawas placed in an ultrasonic cleaner with a power of 250 W under the set temperature and time to extract the ultrasonic extraction solution. The content of total flavonoids was determined by using NaNO2-Al(NO3)3-NaOH as colorant. The effects of time, liquid/material ratio and temperature on extraction were studied by single factor and response surface method to obtain the optimal extraction process of total flavonoids fromG.bilobaleaves.
2 Materials and methods
2.1 Drugs and reagentsG.bilobaleaves (collected at Anhui Science and Technology University, 32°52′33.82″ N, 117°33′29.22″ E, identified as dry leaves ofG.biloba); rutin standard products (100080-2014 09, 100 mg/branch, Central Inspection Institute); anhydrous ethanol, sodium nitrite, aluminum nitrate, sodium hydroxide and other conventional reagents were all analytical pure, and were purchased at Tianjin Yongda Chemical Testing Co., Ltd.
2.2 Main instrumentsFA2014B electronic balance (Shanghai Fine Science Instrument Co., Ltd.); XSP-400 high-efficiency energy-saving Chinese herbal medicine grinder (Jishou Zhongcheng Pharmaceutical Machinery Factory); UV 5500PC UV-visible spectrophotometer (Shanghai Yuan Analyzer Co., Ltd.); vacuum drying box (Shanghai Experimental Instrument Plant); KQ-500DE type CNC ultrasonic cleaner (Kunshan Ultrasonic Instrument Co., Ltd.); circular water multipurpose vacuum pump (Zhengzhouying).
2.3 Experimental process
2.3.1Preparation of rutoside standard solution. After baking the rutoside standard product to constant weight, the precision was called 0.002 g in a 10 mL bottle, and 60% ethanol was fixed, shaken, and the standard liquid with a concentration of 0.2 mg/mL was obtained.
2.3.2Preparation of standard curves. Take six 10 mL bottles, numbered 1, 2, 3, 4, 5, 6. Then the reagent was added to 1-6 according to the following steps. Firstly, add 0, 0.4, 0.8, 1.2, 1.6, 2.0 mL in Section2.3.1; secondly, add 60% CH3CH2OH solution 2.0, 1.6, 1.2, 0.8, 0.4, 0 mL; thirdly, add 5% NaNO2solution 0.5 mL, shake evenly, place 6 min, add 10% Al(NO3)3solution 0.5 mL, shake evenly, place 6 min, add 4% NaOH solution 4 mL; finally, add 60% CH3CH2OH solution to set capacity and shake evenly. Take 1 as a blank, 6 as a reference, set the wavelength scan range to 400-700 nm, select the maximum absorption wavelength, and then measure the absorption of other concentrations of standard liquids at the maximum wavelength to draw the standard curve with absorbency-concentration[7-8].
2.3.3Preparation of sample fluids.G.bilobaleaves in the school were collected, washed, dried, and placed in a constant temperature drying box at 60℃ to a constant weight, powdered in the shredder, and over the No. 5 screen, and thenG.bilobafine powder was obtained. The powder 1.0 g was precisely determined in a 50 mL conical bottle and 60% ethanol was added. At a certain temperature, a certain amount of time was extracted by using 250 W power ultrasound to extract the liquid. Remove 1.0 mL extract in a 10 mL bottle, add the colorant in Section2.3.2, and add 60% of the ethanol to set capacity, shake evenly, and reserve.
No wonder the shoemaker becomes wealthy with so many pairs of shoes to sell so quickly! No doubt the elves can easily make 512 pairs of shoes just as easily as 2 since they are magical beings
2.3.4Determination of samples. The above sample solution was determined at the maximum absorption wavelength, and the concentration was obtained according to the standard curve, and the extraction rate of the total flavonoids was calculated. The formula was as follows:

2.4 Single factor test
2.4.1Effect of time on extraction. Precision weighing 1 gG.bilobapowder in 50 mL ×5 conical bottles, following the liquid/material ratio of 30∶1 (mL/g) plus 60% CH3CH2OH solution in each bottle. At 40℃, ultrasound 10, 20, 30, 40, and 50 min were measured in Section2.3.2to calculate the extraction rate. Using time as the horizontal axis and extraction rate as the vertical axis, a line diagram was established to analyze the impact of time.
2.4.2Effect of liquid/material ratio on extraction. Precision weighing 1 gG.bilobapowder in 50 mL ×5 conical bottles, press the liquid/material ratio 10∶1, 20∶1, 30∶1, 40∶1, 50∶1 (mL/g) to add 60% CH3CH2OH solution to the conical bottle, and ultrasonic 30 min at 40℃, respectively. Measurement of light absorption in Section2.3.2, calculation of extraction rate, analysis of results.
2.4.3Effects of temperature on extraction. Precision weighing 1 gG.bilobapowder in 50 mL ×5 conical bottles, according to the liquid/material ratio of 30∶1 (mL/g) plus 60% CH3CH2OH solution in each bottle. At 20, 30, 40, 50, and 60℃, 30 min was extracted by ultrasound, and the absorbency was measured by the method in Section2.3.2to calculate the extraction rate. The effect of temperature was analyzed[9].
3 Results and analyses
3.1 Selection of the maximum absorption wavelengthSpectral scans were available in Section2.3.2(Fig.1). From Fig.1, the rutoside standard had only one absorption peak at 502 nm in the 400-700 nm range, so the maximum absorption wavelength was 502 nm.
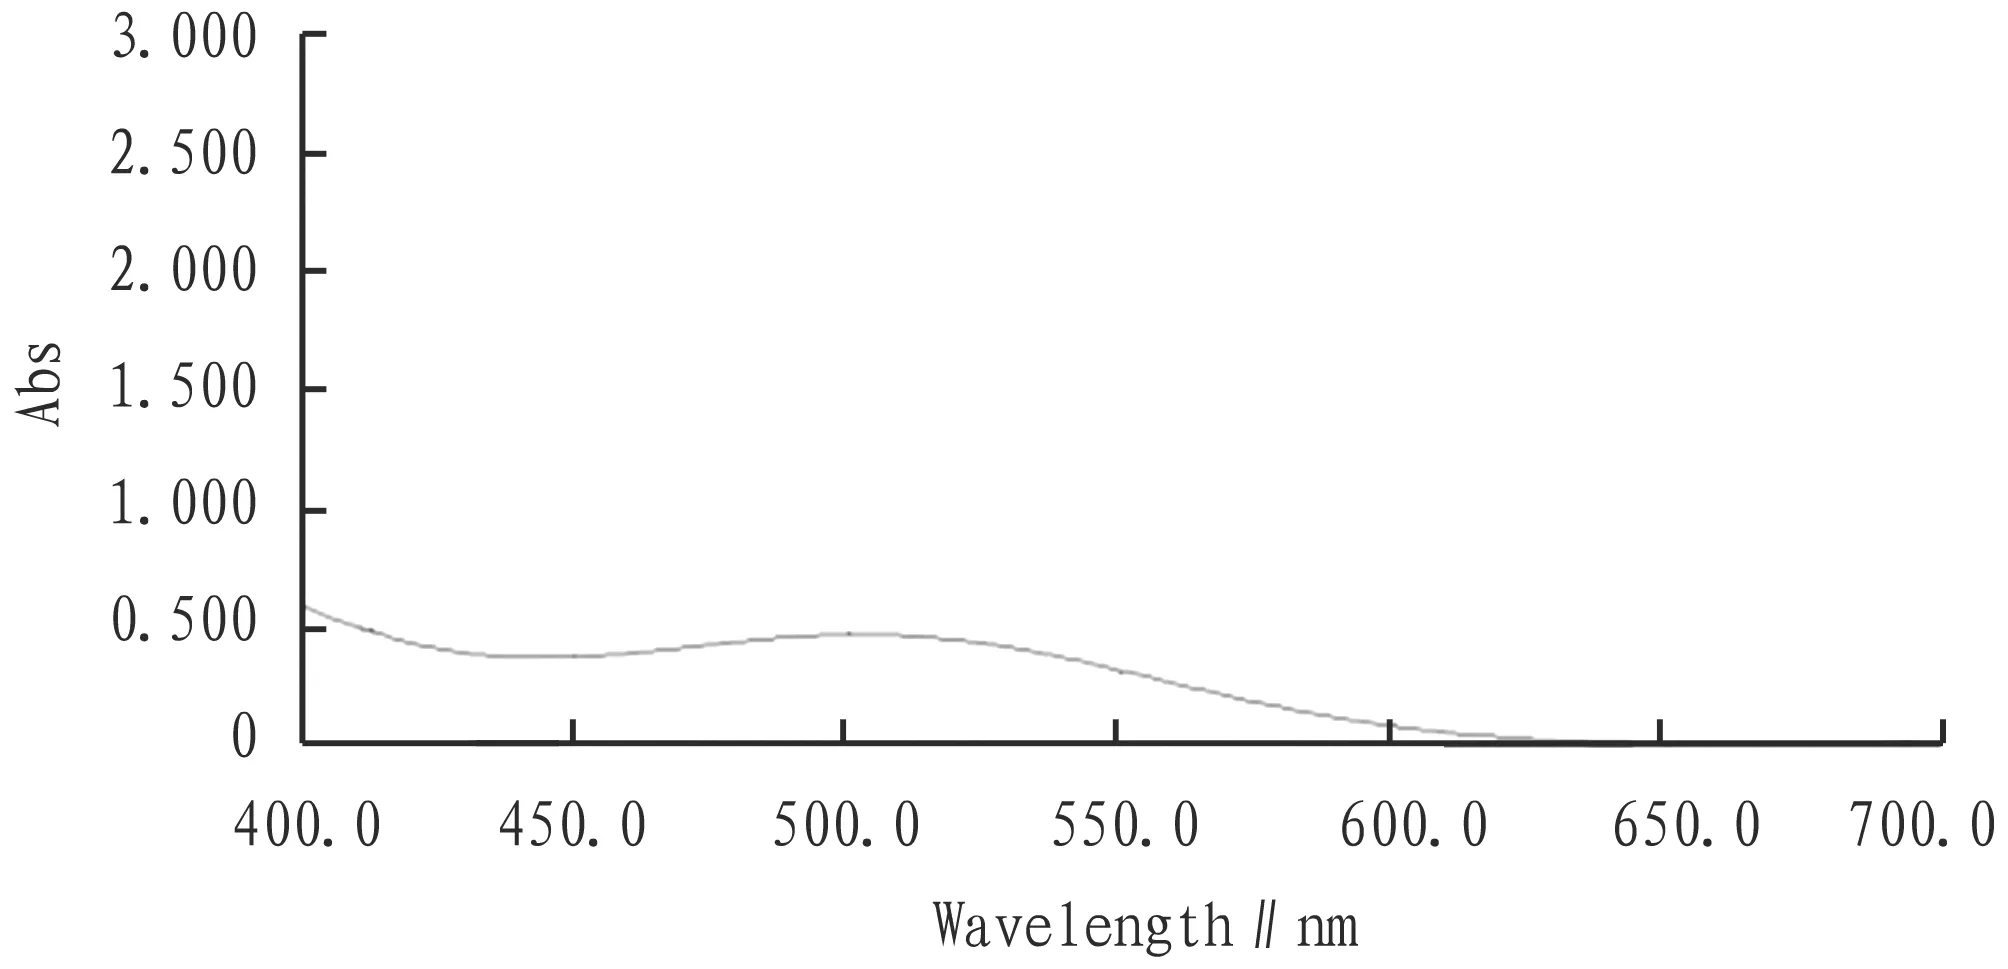
Fig.1 Standard solution spectrogram
3.2 Mapping of standard curvesThe absorption wavelength was set to 502 nm, and the absorbency of 2, 3, 4, 5, and 5 were measured respectively. The absorbency was used as the horizontal axis, and the concentration was the vertical axis to obtain the standard graph (Fig.2). From Fig.2, the regression equation wasC=0.067 4A-0.000 9,R2=0.995 4. So in the 0-0.613 9 Abs range, this equation can be used to measure the relationship between absorption and concentration.
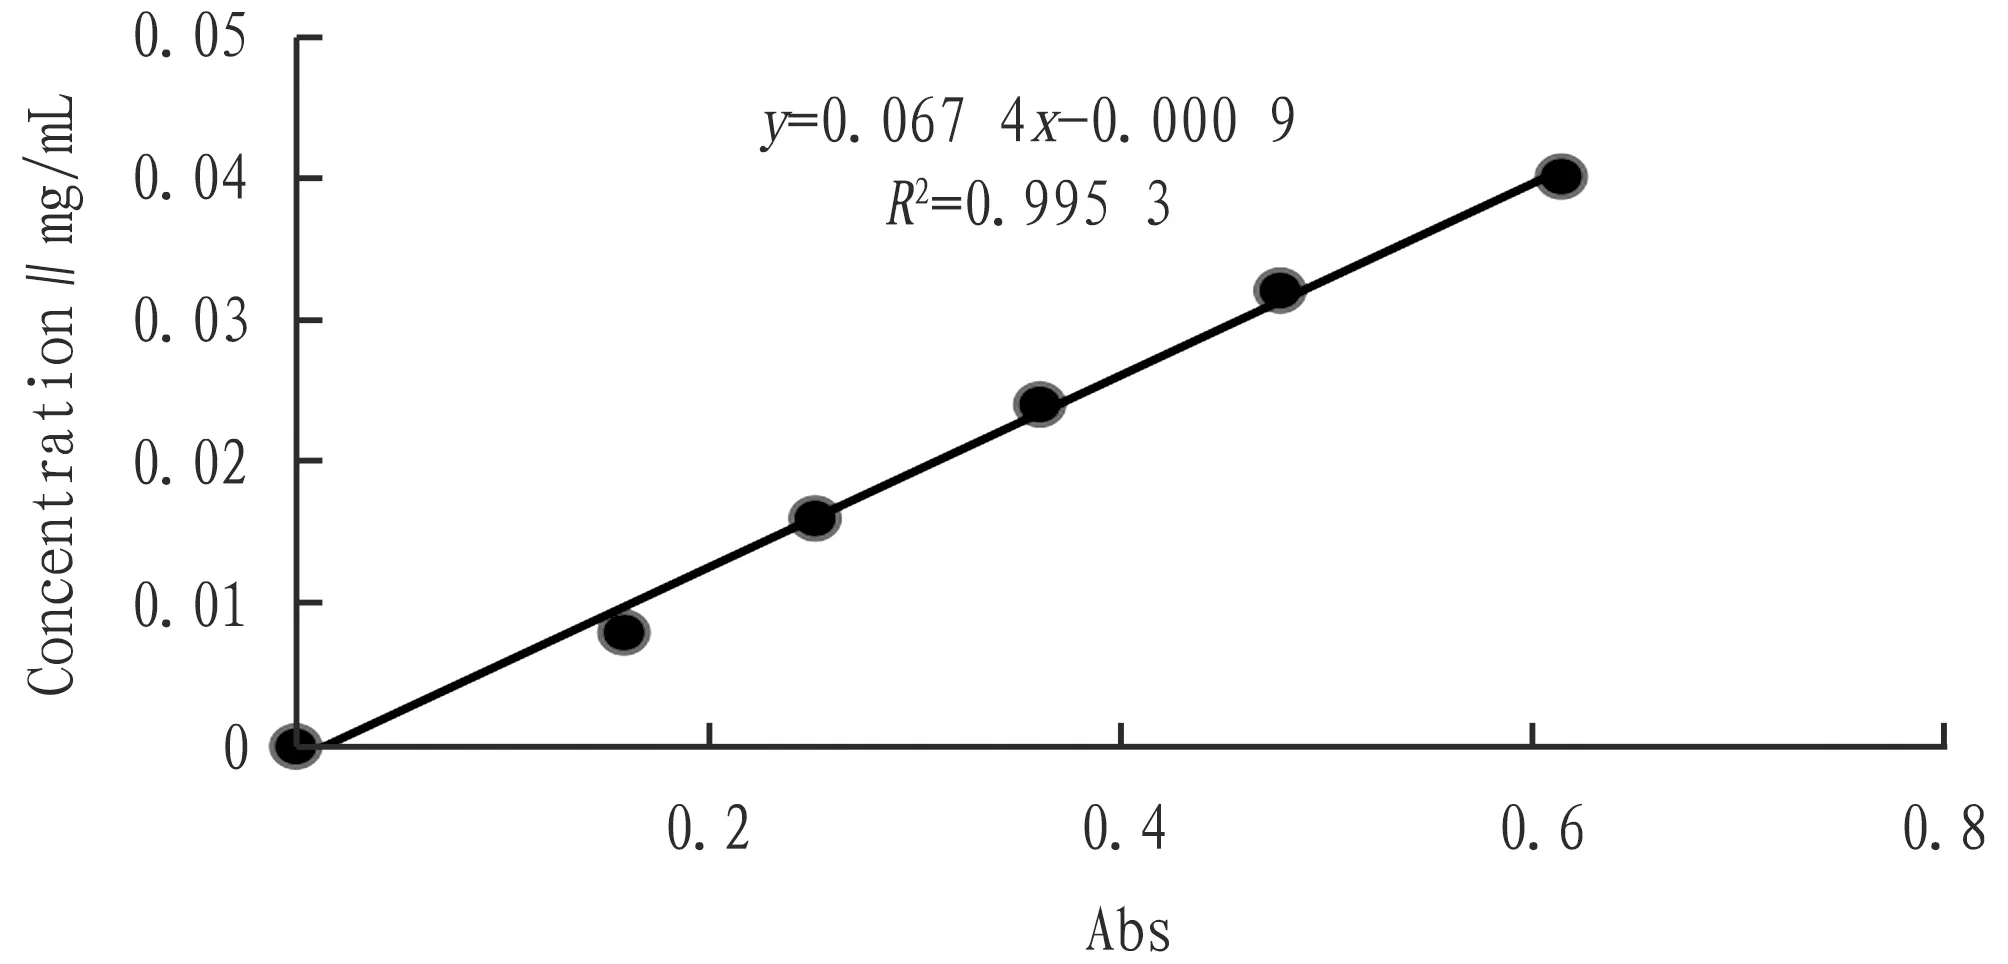
Fig.2 Standard curve
3.3 Effects of single factors
3.3.1Effects of time. Fig.3 showed that total flavonoid extraction increased with time and decreased with 30 min. The reason may be that too long a time has caused other substances to be extracted to affect the measurement of total flavonoids.
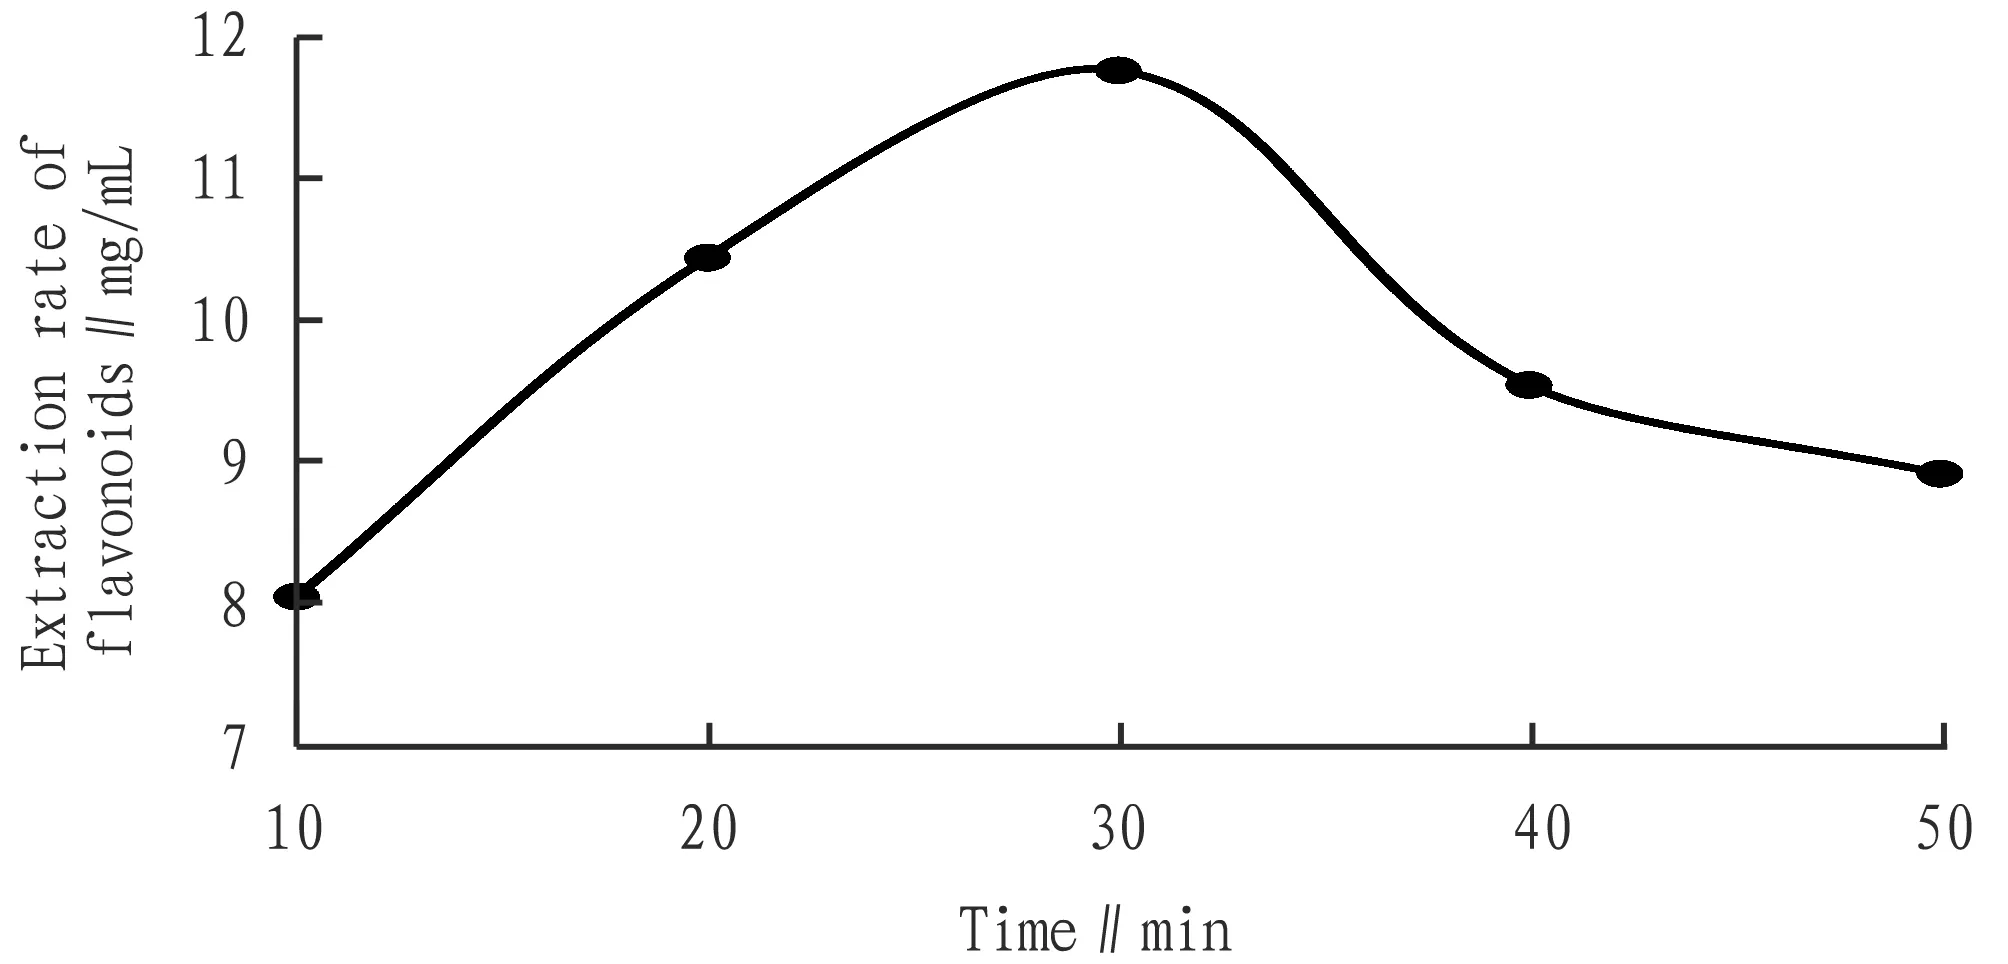
Fig.3 Influence of time
3.3.2Effects of liquid/material ratio. Fig.4 showed that total flavonoid extraction increased gradually when the liquid/material ratio was below 30∶1 (mL/g), and increased and decreased when higher than 30∶1 (mL/g). The reason may be that the solvent was too low to completely extract flavonoids, and when the solvent was too high, it would affect the ultrasound and cause the extraction rate to decrease.
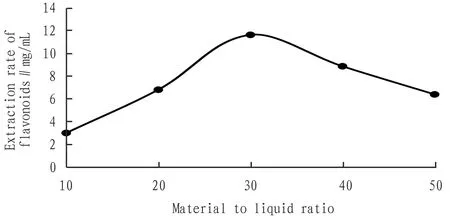
Fig.4 Effects of material to liquid/material ratio
3.3.3Effects of temperature. Fig.5 showed that the total flavonoid extraction volume increased with temperature before 40℃, and when it exceeded 40℃, total flavonoid extraction volume increased and decreased with it. The reason may be that an excessively high temperature would destroy the active ingredients of the extract, so the extraction temperature was selected as 40℃.
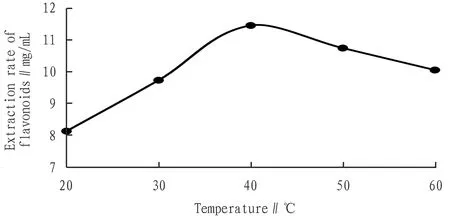
Fig.5 Effects of temperature
3.4 Design and results analysis of response surface method
3.4.1Design of the response surface method. From the results of the single factor test, three levels of the three factors of time (A), liquid/material ratio (B), and temperature (C) can be selected to have the greatest impact on the total flavonoid extraction, in response to the surface method design test[10-12](Table 1).
3.4.2Response analysis of programmes and results. Table 2 showed primitive experimental values obtained by three levels with the largest impact on extraction of total flavonoids.
Table 1 Response surface factors and levels

Level Extraction time∥ minFluid ratio∥mL/gTemperature∥℃-12020∶13003030∶14014040∶150
3.4.3Model fitting. The obtained data was analyzed with design-exchange 8.0.6 software, and the response values of the total flavonoids extracted (Y) inG.bilobaleaves were used for the quadratic regression fitting of each factor (A, B, C). The fitting equation was as follows:
Y=-50.659 25+0.723 02A+1.798 65B+1.165 33C-7.500E-004AB+2.375E-003AC+1.900 00E-003BC-0.013 77A2-0.029 552B2-0.015 878 4C2
Table 2 Response surface analysis scheme and test results
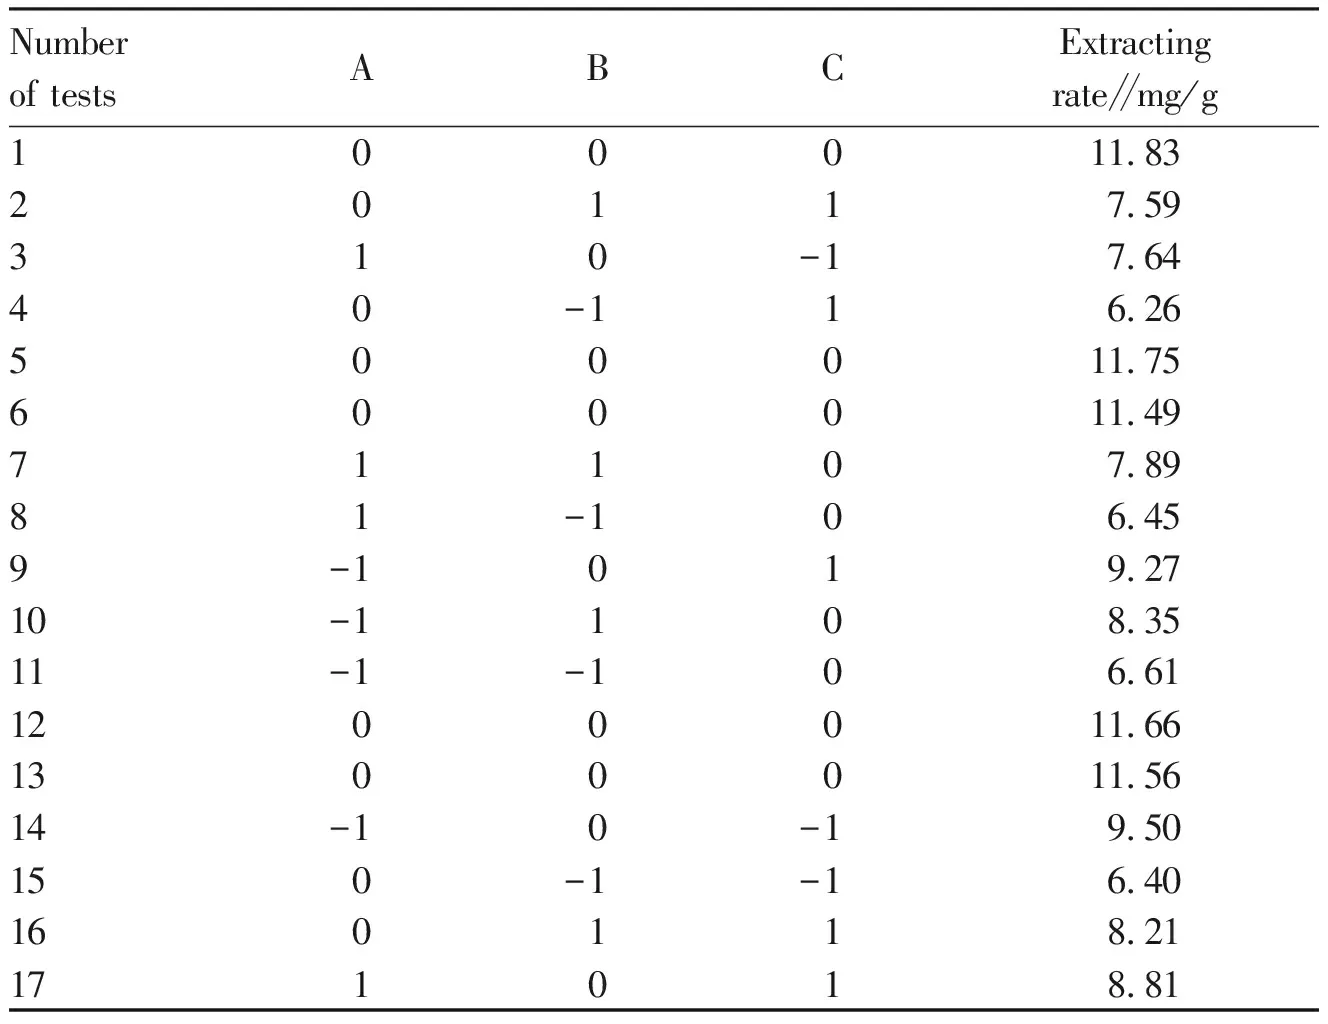
Numberof testsABCExtractingrate∥mg/g100011.8320117.59310-17.6440-116.26500011.75600011.4971107.8981-106.459-1019.2710-1108.3511-1-106.611200011.661300011.5614-10-19.50150-1-16.40160118.21171018.81
From Table 3, it was known that the liquid/material ratio had a very significant effect, and the time and temperature had a significant effect. In the model,F=189.94,P<0.001, extremely significant, inaccuracy testP=0.071 4,P>0.05, not significant, indicating that the equation and the actual situation fitted well, and can use this model to analyze and predict the best extraction process of total flavonoids[13-15].
Table 3 Regression model analysis

Sources of varianceSum of squaresDegrees of freedomAll squareF valueP(F>Fα)Significance Model67.46097.500189.94<0.000 1∗∗∗A-time0.78010.78014.470.006 7∗B-fluid ratio4.99014.99093.22<0.000 1∗∗∗C-temperature 0.44010.4408.160.024 4∗AB0.02310.0230.420.537 6AC0.23010.2304.210.079 2BC0.14010.1402.700.144 6

Sources of varianceSum of squaresDegrees of freedomAll squareF valueP(F>Fα)Significance A27.99017.990149.23<0.000 1∗∗∗B236.770136.770686.60<0.000 1∗∗∗C210.610110.610198.19<0.000 1∗∗∗Residual0.37070.054Lack of fit0.30030.1005.250.071 4Not significantPure error0.07640.019Cor total67.83016
Note:***was extremely significant (P<0.001);*was significant (P<0.05).
3.4.4Optimization of optimal process conditions. Via response surface methodology, the best extraction process of total flavonoids fromG.bilobaleaves by ultrasound was as below: time 29 min, liquid/material ratio 32∶1, temperature 40℃(Fig.6-8).
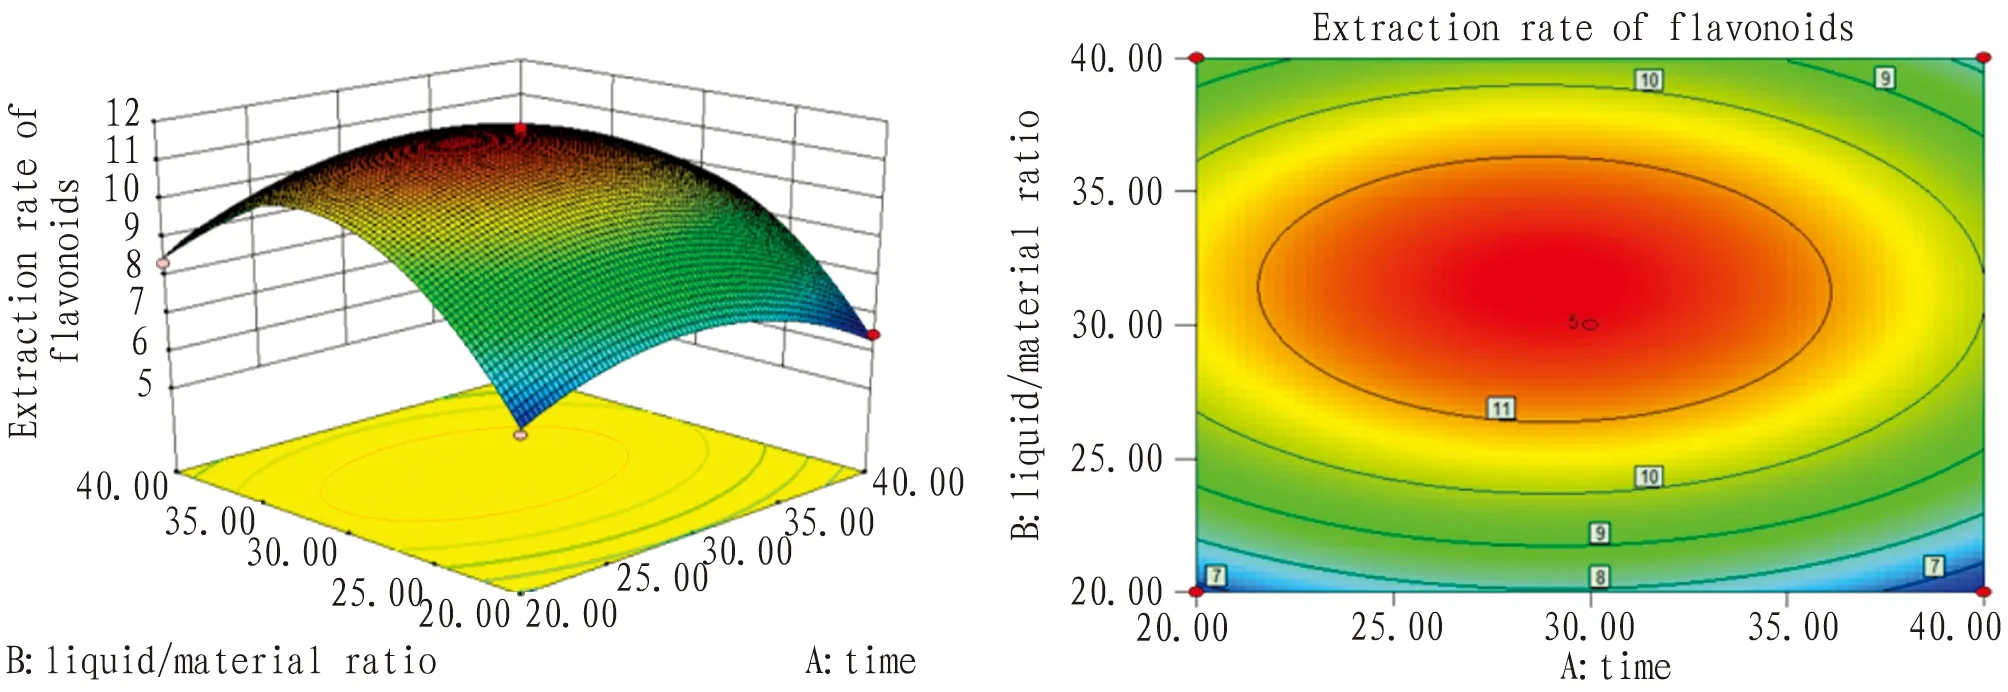
Fig.6 Response plane graph and contour plot of time and liquid/material ratio interaction
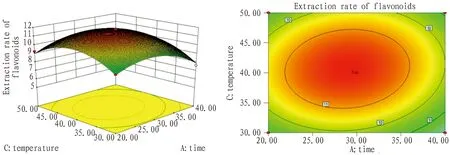
Fig.7 Response surface and contour map of time and temperature interaction
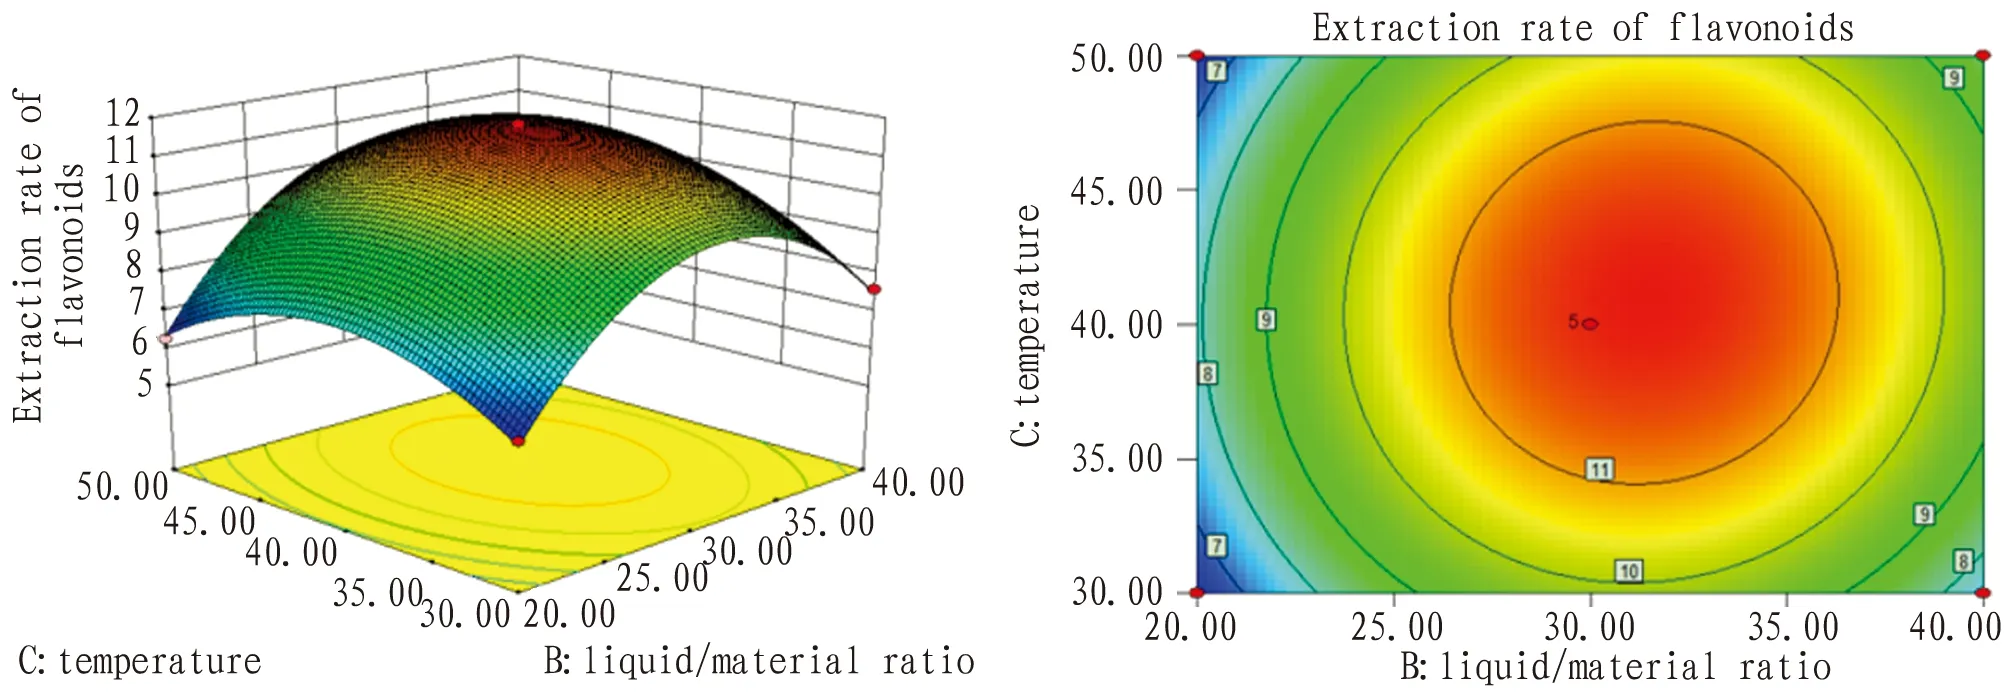
Fig.8 Response surface and contour map of liquid/material ratio and temperature interaction
3.4.5Validation of the best extraction process. After the response surface method analysis, the optimal conditions were obtained, that is, the extraction time was 28.89 min, the liquid/material ratio was 31.38∶1, and the extraction temperature was 40.74℃. Combining with the actual situation, the parameters for the extraction of flavonoids were optimized, that is, the time was 29 min, the liquid/material ratio was 32∶1, and the temperature was 40℃. With the optimized conditions, three parallel tests were conducted. The average value obtained by the test was compared with the predicted value of the fitting equation. It can be seen from Table 4 that the average actual measured value was 11.68 mg/g, which was 0.06 mg/g lower than the predicted value.
Table 4 Verifying of the predicted values and actual values

Note: Deviation(%)=(Actual value-Predictive value)/Theoretical value×100.
4 Discussions
The extraction and separation of flavonoids fromG.bilobais one of the topics worthy of attention. At present, there are many methods for extracting and separating flavonoids fromG.biloba, but most of them focus on the application of traditional separation technology, and need to be further improved in terms of extraction cost, extraction rate and so on. In addition, the technology of combination of ultrasonic extraction and aqueous two-phase extraction[14]and the technology of combination of ultrasonic extraction and microwave extraction[15]have also been applied to extract and separate flavonoids fromG.biloba, and the effect is good. In order to makeG.bilobaand other traditional Chinese medicines better benefit the society, it is obvious that the coupling and integration technology in the new separation technology should have better application prospects from the perspective of separation.
5 Conclusions
Using the response surface method to optimize the ultrasonic extraction process of total flavonoids inG.bilobaleaves, the best results were as follows: the time was 28.89 min, the liquid/material ratio was 31.38∶1, and the temperature was 40.74℃. The predicted extraction under this condition was 11.74 mg/g. Taking into account the actual situation, the optimization conditions were as follows: 29 min, the liquid/material ratio was 32∶1, and the temperature was 40℃. After optimization, the actual extraction amount was 11.68 mg/g. The difference between the predicted value and the actual value was -0.50%, and the deviation was small, which proved that the model was reasonable. This method was easy to extract total flavonoids fromG.bilobaleaves,with low cost and good repeatability.
杂志排行
Asian Agricultural Research的其它文章
- Impact of Ningbo Port Logistics on Regional Economic Development of Zhejiang Province
- Current Situation of College Students’ Entrepreneurship and Employment in the Countryside in the Context of Rural Revitalization
- Effects of Agricultural Insurance on Poverty Alleviation under Uncertain Price of Agricultural Products
- Poverty Alleviation through Employment Promotion in Extreme Poverty-stricken Areas in Western China: A Case Study of Targeted Poverty Alleviation through Employment Promotion in Awang Town, Dongchuan District
- Evaluation of the Degree of Opening to the Outside World in Guizhou Province
- The Poverty Alleviation Model for Poor Nationalities in the Mountainous Areas of Western China: A Case Study of “Promotion for the Entire Lisu Nationality” in Naimu Danxia Village Group
