基于叶绿素叶面分布特征的黄瓜氮镁元素亏缺快速诊断
2019-08-23石吉勇李文亭胡雪桃黄晓玮李志华郭志明邹小波
石吉勇,李文亭,胡雪桃,黄晓玮,李志华,郭志明,邹小波
基于叶绿素叶面分布特征的黄瓜氮镁元素亏缺快速诊断
石吉勇,李文亭,胡雪桃,黄晓玮,李志华,郭志明,邹小波※
(江苏大学食品与生物工程学院,镇江 212013)
为了快速、无损诊断作物氮(N)、镁(Mg)营养亏缺,该研究提出一种以叶绿素叶面分布特征诊断黄瓜N、Mg元素亏缺的方法。在设施栽培模式下精确控制N、Mg营养元素的供给,培养黄瓜缺N、缺Mg及对照植株(营养元素正常植株),然后采集对应的高光谱图像并结合化学计量学方法快速、无损检测叶绿素分布。与对照组叶片叶绿素分布相比,缺N叶片的叶绿素含量在整个叶面区域偏低,缺Mg叶片叶绿素在叶脉之间区域含量偏低。鉴于此,提取叶绿素叶面分布特征(叶片所有像素点对应的叶绿素含量均值及标准差)对N、Mg营养元素亏缺进行诊断,对预测集N、Mg元素亏缺正确诊断率达90%。研究结果表明叶绿素叶面分布特征可作为一种黄瓜N、Mg元素亏缺诊断依据。
叶绿素;光谱分析;模型;分布特征;黄瓜叶片;氮元素;镁元素;高光谱成像
0 引 言
设施栽培作物以早熟、高产、增效快等优点而广受欢迎,其中黄瓜在中国的设施栽培作物中占比大,已成为中国一些地方的农业经济支柱之一[1-3]。设施栽培黄瓜生长周期短、产出量大、需肥量多,容易出现N、Mg营养元素亏缺,影响其产量和经济效益[4-7]。元素分析方法如凯氏定氮法、原子吸收法等能够准确分析黄瓜植株不同部位的N、Mg营养元素含量,是诊断作物N、Mg元素亏缺的标准方法[8-11]。然而元素分析测试过程涉到复杂的样品前处理以及化学试剂消耗,不利于设施栽培黄瓜N、Mg营养元素亏缺的高效诊断。
与正常植株相比,N、Mg营养元素亏缺往往导致黄瓜叶片叶绿素含量下降[12-13]。利用无损检测设备如SPAD叶绿素测色仪[14-15]、可见光光谱仪[16-18]、近红外光谱仪[16,19]等快速获取作物叶片叶绿素含量,可实现植株N、Mg营养元素亏缺的快速诊断。相关论文表明叶绿素下降仅出现在N、Mg元素亏缺叶片部分区域(其他区域的叶绿素含量与正常叶片相同),而可见光谱、近红外光谱、SPAD叶绿素仪数值等方法仅能感知叶片采样点处的叶绿素含量,导致采样位置选取对诊断结果造成影响[14-15,19]。因此,本文通过定量描绘叶绿素含量在整片叶片中的分布情况,从表征叶绿素含量分布差异的角度提出N、Mg元素亏缺诊断依据,有望克服现有元素亏缺诊断方法的不足,实现N、Mg元素亏缺的高效、快速诊断。
高光谱图像技术可获取待测样本的二维图像信息,又可获取二维图像中每个像素点对应的光谱信息[20-23]。利用像素点光谱信息对待测组分含量的敏感性,可逐一解析每个像素点对应的待测组分含量,进而实现待测组分含量分布图的快速、无损检测[24-26]。课题组前期利用黄瓜叶片高光谱信息与叶绿素含量之间的对应关系,实现了叶绿素含量在黄瓜叶片上的二维分布检测[27-29]。在以上前期研究的基础上,本文拟采用高光谱图像技术分析叶绿素含量在缺N、缺Mg及正常黄瓜叶片上的分布差异,提取叶绿素含量分布特征作为N、Mg元素亏缺诊断依据,并建立设施栽培黄瓜N、Mg元素亏缺诊断新方法。
1 材料与方法
1.1 缺素样本培育及验证
在温室大棚内以无土栽培的方式通过精确控制黄瓜植株的营养供给培育缺N植株、缺Mg植株以及对照植株。具体过程如下:将水果黄瓜种子(碧玉3号,上海富农种业有限公司)发芽后得到的幼苗置于装有珍珠岩(使用前消毒,镇江培蕾有机肥有限公司)的花盆或枕袋中,待黄瓜植株长出3片叶子时,将所有黄瓜植株分为缺N组、缺Mg组和对照组继续培养。其中对照组植株使用按山崎配方配置包含植株所有所需营养元素的营养液;缺N组植株使用在对照组营养液的基础上完全扣去N元素的缺N植株营养液;缺M组植株使用在对照组营养液的基础上完全扣去Mg元素的缺Mg植株营养液。为了保证试验结果的可靠性,分3批次培育缺N植株60株、缺Mg组植株60株以及对照组植株60株。利用凯氏定氮法[8]、原子吸收光谱法[10]检测缺N组样本、缺Mg组样本以及对照组样本的N、Mg元素含量,从而验证所培育样本的缺素状态。
1.2 高光谱图像采集
高光谱成像系统由线扫描高光谱仪(V10E,Spectral Imaging Ltd.,芬兰)、线光源(DC-950A,Dolan-Jenner Ltd.,美国)、电控平移台(TSA200-A,北京卓立汉光有限公司,中国),光箱和计算机组成。为了防止基线漂移,数据采集前将高光谱图像采集系统预热30 min。数据采集时,将叶片样本平铺在电控平移台上,并关闭光箱以防止外界光线的干扰。设定样本高光谱图像采集参数为:曝光时间为45 ms、光谱分辨率为2.8 nm、图像分辨率为600´1 280像素、采样间隔为0.67 nm、电控位移平台速度为1.25 mm/s以及电控位移平台行程为100 mm[30]。高光谱图像数据采集完成后,得到一个大小为600´1 280(像素)´1 024(波段)的三维数据块。
1.3 叶绿素含量检测
采用高效液相色谱仪(LC-20A,岛津,日本)检测叶片样本对应的叶绿素含量[31]。准确称取30~40 mg叶片组织,于4 mL 体积分数为80%丙酮水溶液(含0.01%(质量分数)二丁基羟基甲苯)进行色素提取,以4 000 r/min的速度离心10 min后收集提取液,以70%甲醇水溶液(含0.05%(体积分数)三乙胺)和30%乙酸乙酯溶液(含0.05%(体积分数)三乙胺)为流动相,将提取液经0.45m微膜过滤器过滤送入C18反相色谱柱(Spherisorb ODS-2,规格:250 mm×4.6 mm),利用紫外可见检测器(北京科益恒达科技有限公司,Prominence SPD-20A)于440 nm 波段下获取叶绿素对应的检测信号。在相同的条件下,建立叶绿素a标准品(#C5753,Sigma公司,美国)、叶绿素b标准品(# C5758,Sigma公司,美国)与检测信号的对应关系,按公式(1)换算出提取液对应的叶绿素含量。
= 0.035´10-3X+0.08´10-3X+1.449 (1)
式中为叶绿素质量浓度,g/mL,X为叶绿素a色谱峰面积,mV,X为叶绿素b色谱峰面积,mV。
1.4 叶绿素叶面分布特征提取及N/Mg缺素诊断
叶绿素叶面分布特征快速诊断设施栽培黄瓜N、Mg元素亏缺的流程如图1所示。首先,构建叶绿素含量校正模型。采集校正集样本(表1所示)对应的高光谱图像信息,提取感兴趣区域的光谱;同时采用高效液相色谱分析校正集样本对应的叶绿素含量参考值。利用校正集样本的光谱信息及对应的叶绿素含量参考值,建立叶绿素含量校正模型。其次,验证叶绿素含量校正模型。采集独立于校正集的黄瓜叶片构建测试集,提取测试集样本高光谱图像的感兴趣区域光谱,将其代入已建立的叶绿素含量校正模型以计算出测试集样本的叶绿素含量预测值,通过比较叶绿素含量预测值与参考值之间的差异来验证叶绿素含量校正模型的效果。最后,叶绿素叶面分布特征的提取及诊断。提取缺素叶片、对照组叶片高光谱图像中每个像素点对应的光谱信息,代入验证后的叶绿素含量校正模型计算出每个像素点对应的叶绿素含量,进而得到缺素叶片及对照组叶片的叶绿素含量分布图。通过定量表征缺N叶片、缺Mg叶片及对照组叶片的叶绿素含量分布差异,实现缺N叶片、缺Mg叶片及对照组叶片的快速诊断。

图1 叶绿素叶面分布特征快速诊断设施栽培黄瓜氮、镁元素亏缺流程图
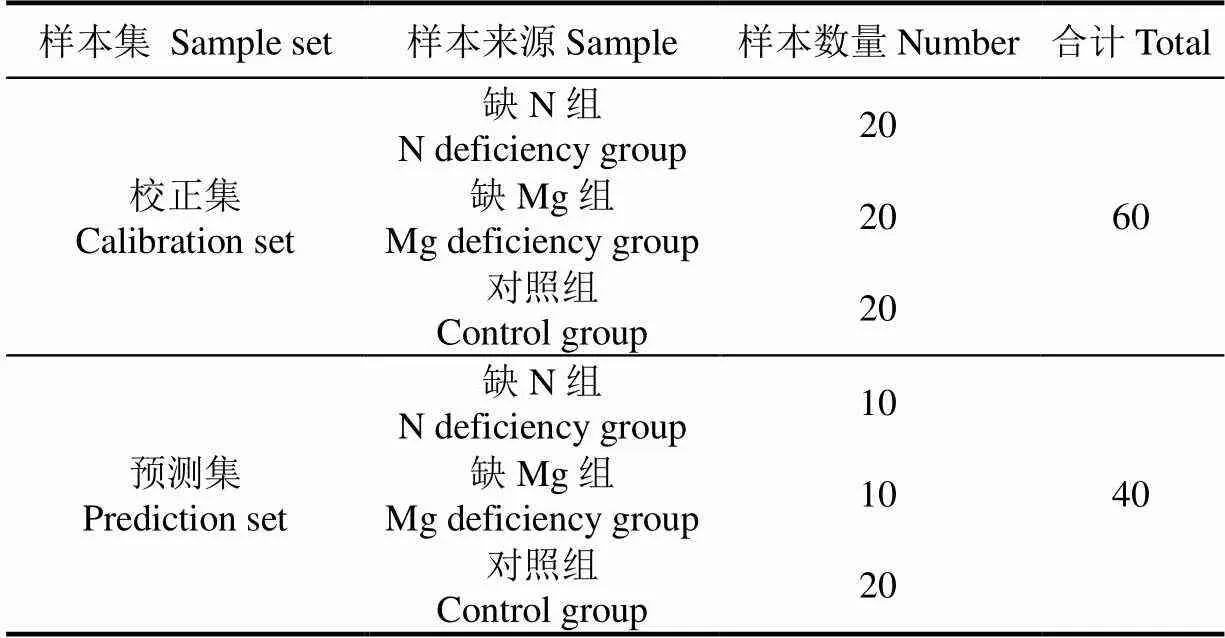
表1 校正集及预测样本
2 结果与分析
2.1 黄瓜叶片N/Mg元素检测结果
在黄瓜植株生长20 d后,分别采集缺N植株、缺Mg植株、对照组植株的10片老叶[31](第1~3节点)、10片中叶(第4~5节点)、10片新叶(第6~8节点)进行N元素以及Mg元素含量检测。缺N组、缺Mg组及对照组的N元素分析结果如图2 a所示,缺N植株老叶、中叶、新叶对应的N元素质量分数均值为7.15、13.83、17.97 mg/g,缺Mg组及对照组植株老叶、中叶、新叶对应的N元素质量分数均值范围为10.55~11.58、16.07~17.23、19.59~19.98 mg/g。缺N组、缺Mg组及对照组的Mg元素分析结果如图2 b所示,缺Mg植株老叶、中叶、新叶对应的Mg元素质量分数均值为0.85、1.11、1.41 mg/g,缺N组及对照组植株老叶、中叶、新叶对应的Mg元素含量均值范围为0.98~1.01、1.15~1.25、1.43~1.46 mg/g。
N、Mg元素检测结果表明:1)相同节点处缺N组、缺Mg组植株叶片的元素含量低于对照组植株的叶片的元素含量且差异显著(<0.05),表明本研究利用缺N营养液及缺Mg营养液成功培养了缺N植株及缺Mg植株;2)对比缺素植株与对照组植株N、Mg营养元素含量在老叶、中叶、新叶之间的差异,缺素植株老叶与对照组植株老叶之间的含量差异最大(<0.01),表明植株前3个节点的老叶可作为N、Mg元素亏缺诊断研究的代表性样本。

图2 不同组叶片对应的N、Mg元素含量
2.2 N/Mg缺素叶片叶绿素含量检测结果
在黄瓜植株生长30 d后,分别采集3棵缺N植株、3棵缺Mg植株、3棵对照组植株上所有节点的黄瓜叶片,并利用高效液相色谱法检测每个节点叶片对应的叶绿素含量,结果如表2所示。缺N植株老叶、中叶、新叶对应的叶绿素质量分数范围为5.59~6.59、8.51~9.65、11.85~13.90 mg/g,缺Mg植株老叶、中叶、新叶对应的叶绿素质量分数范围为6.45~7.37、8.93~9.95、12.65~13.93 mg/g,对照组植株老叶、中叶、新叶对应的叶绿素质量分数范围为6.85~7.53、8.93~10.49、12.41~13.95 mg/g。
叶绿素检测结果表明:1)与对照组植株各节点的叶绿素含量相比,缺N植株第1节点到第2节点叶片叶绿素含量偏低且差异显著(<0.05),而第5节点到第8节点叶片叶绿素含量无明显差异(>0.05),表明N元素亏缺主要胁迫黄瓜植株的老叶;2)缺Mg植株及对照组植株第1节点到第3节点叶片的叶绿素含量均值不同,但叶绿素均值对应的标准差导致各组叶绿素含量范围彼此重叠,表明利用检测区域的叶绿素含量均值无法有效诊断缺Mg叶片,有必要寻求新的特征参数以实现缺N、缺Mg叶片的同步诊断。
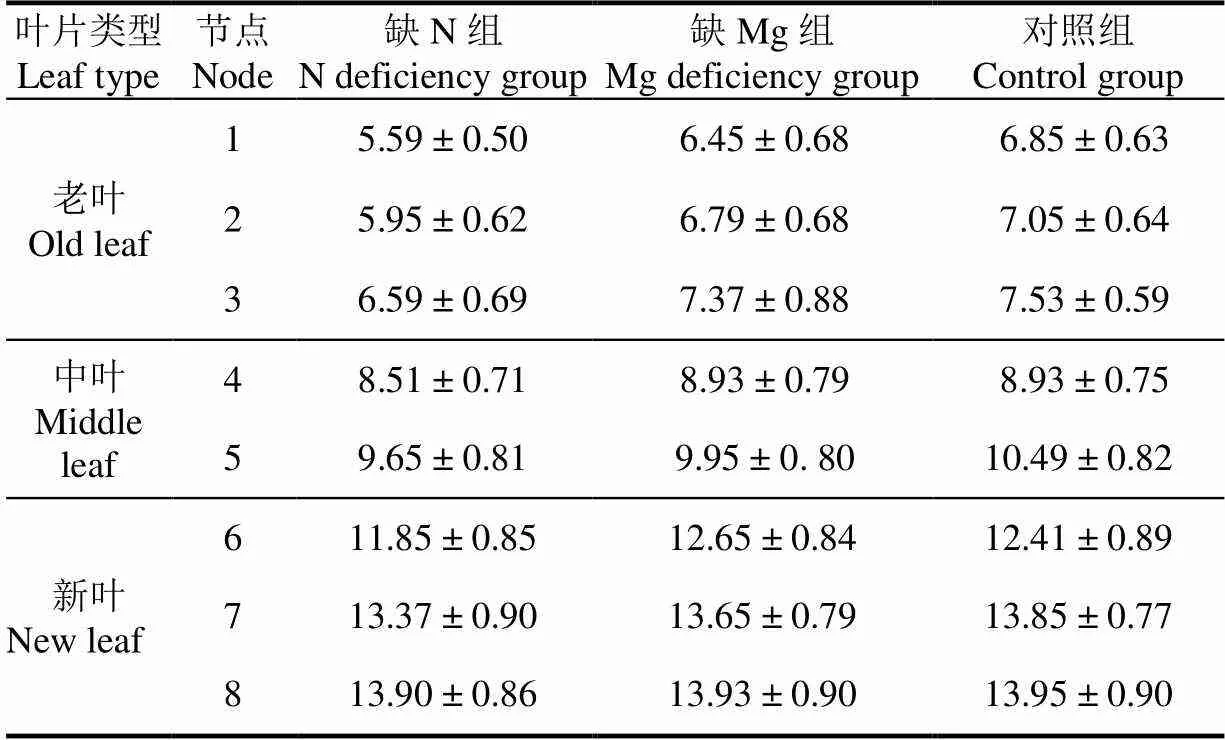
表2 缺N组、缺Mg组及对照组植株不同节点处叶片叶绿素含量检测结果
2.3 黄瓜叶片叶绿素叶面分布检测
2.3.1 叶绿素含量校正模型的构建及验证
首先,提取60片校正集黄瓜叶片感兴趣区域(相对整个黄瓜叶片)的高光谱信息以及利用HPLC检测该感兴趣区域对应的叶绿素含量参考值,利用区间偏最小二乘(interval partial least squares, iPLS)、联合区间偏最小二乘(synergy interval partial least squares, siPLS)、后向区间偏最小二乘(backward interval partial least squares, biPLS)建立了叶绿素含量校正模型(如表3所示),其次,针对40片测试集黄瓜叶片,将其对应的高光谱信息代入iPLS、biPLS、siPLS校正集模型来测试集的叶绿素含量,同时利用高效液相色谱法(high performance liquid chromatography, HPLC)测定测试集样品的叶绿素含量参考值,通过测试集相关系数、测试集均方根误差衡量叶绿素含量计算值与参考值之间的差异。结果表明,siPLS模型效果最优,对应的校正集相关系数为0.917 4、校正集均方根误差为1.93 mg/g,对应的预测相对标准偏差为4.58、测试集相关系数为0.900 7、测试集均方根误差为1.92 mg/g。
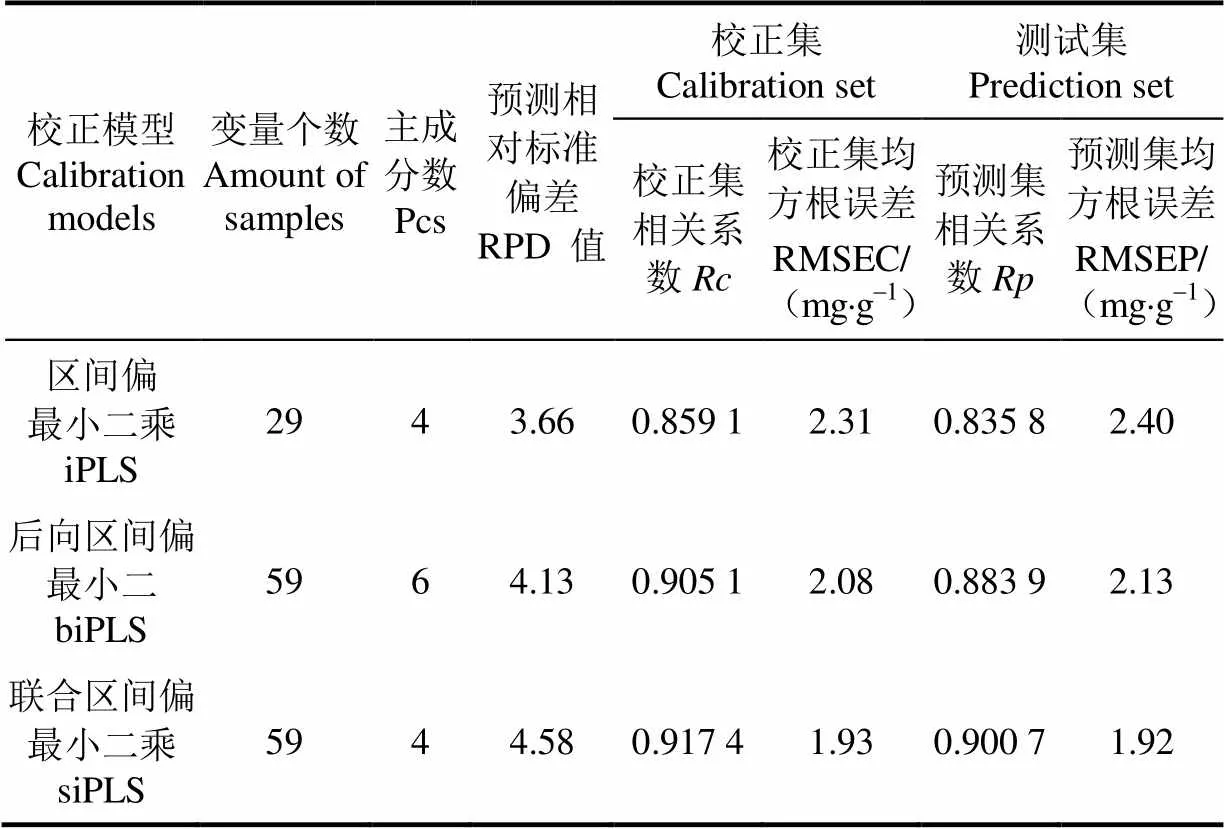
表3 叶绿素含量校正模型及其验证结果
注:z绿素检测结果表明:(RPD: 预测相对标准偏差;: 校正集相关系数; RMSEC: 校正集均方根误差, mg×g-1;: 预测集相关系数; RMSEP: 预测集均方根误差, mg×g-1。
Note:RPD: residual predictive deviation;: the calibration coefficients; RMSEC: root mean standard error of calibration, mg×g-1;: the prediction coefficient; RMSEP: root mean square error of prediction, mg×g-1.
2.3.2 缺素及对照组叶片叶绿素分布图检测
采集缺N叶片、缺Mg叶片及对照组叶片(老叶)对应的高光谱图像,提取高光谱图像中每个像素点对应的光谱信息,代入验证后的siPLS叶绿素含量校正模型计算出每个像素点对应的叶绿素含量,进而得到缺素叶片及对照组叶片的叶绿素含量分布图,如图3所示。对照组叶片的叶绿素含量分布如图3 a所示,该分布图表明对照组叶片微小区域之间叶绿素含量存在差异,但叶绿素含量在对照组叶片的整个叶面分布较均匀,其质量分数范围主要集中在10~20 mg/g。缺N叶片的叶绿素含量分布如图3 b所示,与对照组叶片叶绿素含量分布图相比较,叶绿素含量分布较均匀,但缺N叶片的叶绿素含量整体偏低,其质量分数范围主要集中在5~15 mg/g,表明叶绿素含量的叶面均值可作为诊断N元素亏缺的依据。缺Mg叶片的叶绿素含量分布如图3 c所示,与对照组叶片叶绿素含量分布图相比较,缺Mg叶片叶绿素含量整体与对照组叶片接近,其质量分数范围主要集中在10~20 mg/g,但缺Mg叶片叶脉之间叶绿素含量的分布均匀性较差,表明叶脉间叶绿素含量在各像素点处的均匀性可作为诊断Mg元素亏缺的依据。鉴于以上分析结果,可以以像素点为最小单元精确统计叶绿素叶面分布图中所有像素点对应的均值、标准差作为诊断N、Mg元素亏缺的特征参数。
2.3.3 叶绿素分布特征提取及N、Mg缺素诊断
分别采集对照组植株老叶25片、缺N植株老叶25片以及缺K植株老叶25片,按照3∶2的比例分为校正集和测试集,检测单片叶片对应的叶绿素含量分布图,并从中提取叶片叶绿素叶面分布特征对N、Mg元素亏缺进行诊断。根据上文节中N、Mg元素亏缺叶片叶绿素分布图与对照组叶片叶绿素分布图的比较结果,N元素亏缺叶片主要表现为各像素点叶绿素含量差异不大但整体均值偏低,而Mg元素亏缺叶片主要表现为所有像素点的叶绿素均值差异不大但像素点之间叶绿素含量波动较大。因此,提取缺N、Mg及对照组叶片叶绿素分布图各像素点对应的均值与标准差作为缺素诊断依据,结果如图4所示。
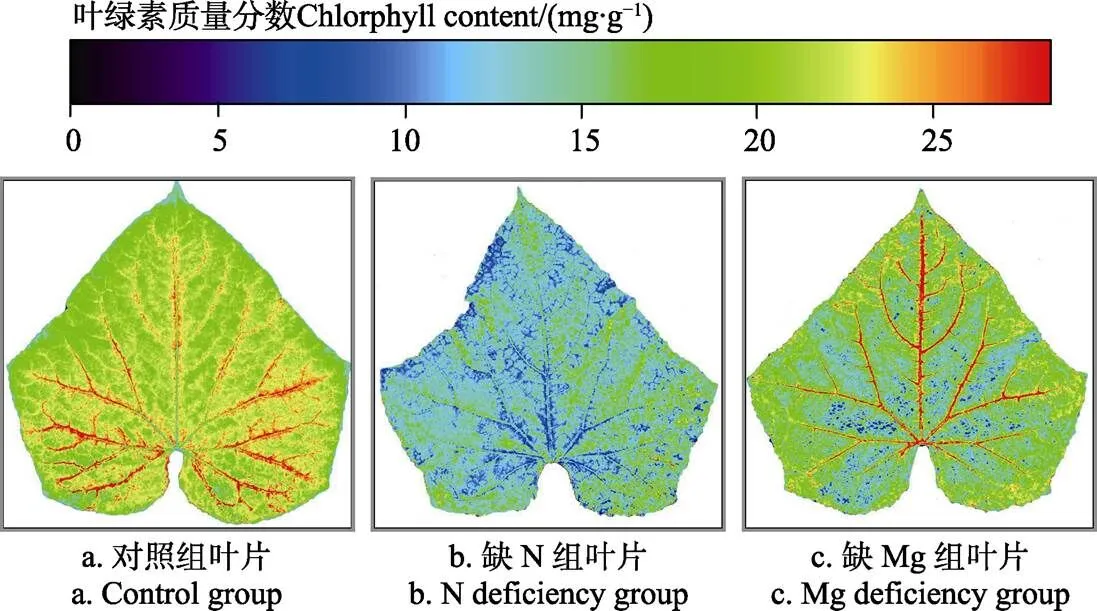
图3 不同组叶片对应的绿素分布图
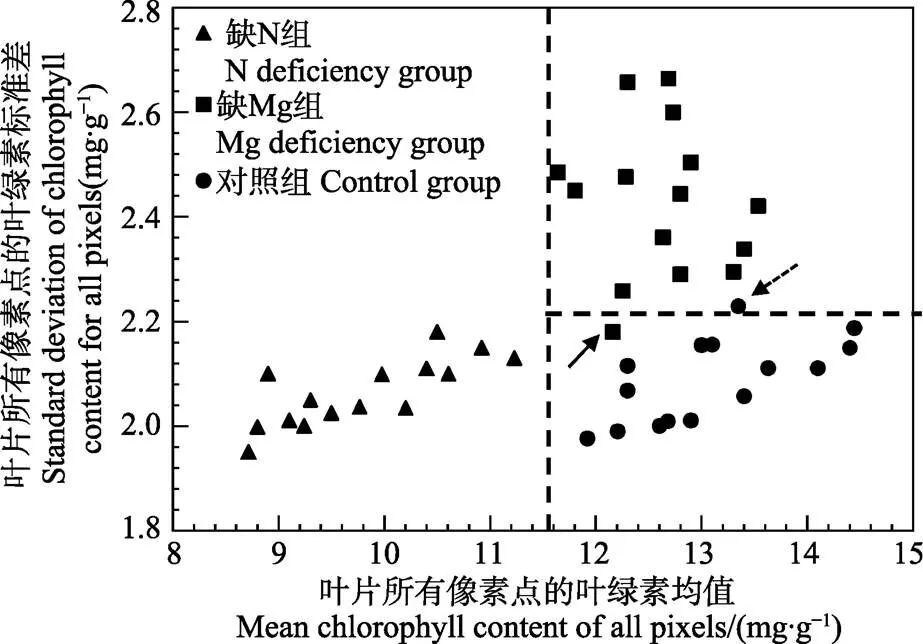
注:箭头所指为被错误诊断的样本。
图4横坐标为样本叶绿素叶面分布图所有像素点对应的叶绿素均值,纵坐标为样本叶绿素叶面分布图所有像素点对应的叶绿素标准差。从图4可以看出,借助均值和标准差这2个叶绿素分布特征,缺N组分叶片、缺Mg组叶片及对照组叶片呈现出了明显的聚类趋势。缺N组主要表现为叶片所有像素点的叶绿素均值比对照组叶片偏低,对应的样本主要聚类于图4左下方。缺Mg组主要表现为标准差比对照组叶片偏高,对应的样本主要聚类于图4右上方。对照组具有高的叶绿素均值和较低的叶绿素标准差,对应的样本主要聚类于图4的右下方。为了对缺N及缺Mg样本进行诊断,设定11.50 mg/g作为诊断N元素亏缺的阈值(如图4中竖虚线所示),其对应的校正集诊断率为100%。利用该阈值对预测集的N元素亏缺样本进行诊断,对应的诊断率为90%。设定2.20 mg/g作为诊断Mg元素亏缺的阈值(如图4横虚线所示),其对应的校正集诊断率为93.33%,其中1个缺Mg样本被错误的诊断为对照组样本(如图4黑色实线箭头所示)。利用该阈值对预测集的Mg元素亏缺样本进行诊断,对应的诊断率为90%。
3 结 论
利用高光谱信号对黄瓜叶绿素含量的敏感性建立了叶绿素含量校正模型(预测集相关系数为0.900 7, 测试集均方根误差为 1.92 mg/g),结合高光谱图像包含每个像素点光谱信息的特性实现了叶绿素含量叶面分布图的快速、无损检测。通过比较对照组、缺N组、缺Mg组叶片的叶绿素含量分布图,从中提取叶片叶绿素分布图所有像素点的均值和标准差作为诊断作物N、Mg元素亏缺的特征,利用叶绿素叶面均值11.50 mg/g和叶绿素叶面标准差2.20 mg/g作为诊断阈值建立了基于叶绿素叶面分布特征的N、Mg元素亏缺诊断模型,对N、Mg元素亏缺的校正集诊断率分别为100%、93.33%,对N、Mg元素亏缺的测试集诊断率分别为90%、90%。研究结果表明,叶绿素叶面分布特征可作为一种新的黄瓜N、Mg元素亏缺诊断依据。
[1] 王田利. 我国黄瓜生产的发展变化历程[J]. 西北园艺(蔬菜),2015(6):4-6.
[2] 卞晓春,刘水东,吴春芳. 2种鲜食蚕豆设施栽培模式及其效益[J]. 浙江农业科学,2018,59(12):2289-2291. Bian Xiaochun, Liu Shuidong, Wu Chunfang. Analysis of two cultivation modes for fresh-eating broad bean in greenhouse and their benefit[J]. Journal of Zhejiang Agricultural Sciences, 2018, 59(12): 2289-2291. (in Chinese with English Abstract)
[3] 汪永虎,雷玉明. 设施栽培黄瓜生理性病害诊断及管理[J].中国园艺文摘,2016,32(2):182-183.
[4] 万述伟,张守才,赵明,等. 设施栽培黄瓜的氮磷钾肥料效应研究[J]. 中国土壤与肥料,2012(5):44-49. Wan Shuwei, Zhang Shoucai, Zhao Ming, et al. Effects of nitrogen, phosphorus and potassium on cucumber facilities cultivation[J]. Soil and Fertilizer Sciences in China, 2012(5): 44-49. (in Chinese with English Abstract)
[5] 赵敏华,王爱花,赵薇,等. 设施栽培黄瓜临界氮浓度和氮营养指数模拟[J]. 中国土壤与肥料,2018(6):141-147. Zhao Minhua, Wang Aihua, Zhao Wei, et al. Simulation of critical nitrogen concentration and nitrogen nutrition index in greenhouse cucumber[J]. Soil and Fertilizer Sciences in China, 2018(6): 141-147. (in Chinese with English Abstract)
[6] 刘静,董利尧,许小江,等. 黄瓜周年设施栽培技术[J].长江蔬菜,2018(13):42-44.
[7] 李银坤,武雪萍,郭文忠,等. 不同氮水平下黄瓜-番茄日光温室栽培土壤N2O排放特征[J]. 农业工程学报,2014,30 (23):260-267. Li Yinkun, Wu Xueping, Guo Wenzhong, et al. Characteristics of greenhouse soil N2O emissions in cucumber-tomato rotation system under different nitrogen conditions [J]. Transactions of the Chinese Society of Agricultural Engineering (Transactions of the CSAE), 2014, 30 (23): 260-267 (in Chinese with English Abstract)
[8] 孙宗训. 凯氏定氮法和奈氏比色法测定植株全氮方法的比较[J]. 现代农业科技,2011(24):41-44.
[9] 李文韬,周燕,胡佳,等. 凯氏定氮法测定某未知含氮化合物氮含量[J]. 中国卫生标准管理,2016,7(24):110-112. Li Wentao, Zhou Yan, Hu Jia, et al. Determination of the total nitrogen content in some unknown compound by the kjeldahl method[J]. China Health Standard Management, 2016,7(24): 110-112. (in Chinese with English Abstract)
[10] 邵玉芳,邵世勤. 微波消解-火焰原子吸收光谱法测定柳叶蒿中4种微量元素[J]. 食品安全导刊,2017(33):89.
[11] 叶国健. 微波消解-原子吸收法测定花生中钙、镁、铜和锌的含量[J]. 中国油脂,2018,43(3):141-143. Ye Guojian. Determination of contents of Ca, Mg, Cu and Zn in peanut by microwave digestion-atomic absorption spectrometry[J]. China Oils and Fats, 2018, 43(3): 141-143. (in Chinese with English Abstract)
[12] Marouani A, Behi O, Salah H B, et al. Establishment of chlorophyll meter measurements to manage crop nitrogen status in potato crop[J]. Communications in Soil Science and Plant Analysis, 2015, 46(4): 476-489.
[13] Farhat N, Elkhouni A, Zorrig W, et al. Effects of magnesium deficiency on photosynthesis and carbohydrate partitioning[J]. Acta Physiologiae Plantarum, 2016, 38(6): 145.
[14] Bullock D G, Anderson D S. Evaluation of the Minolta SPAD-502 chlorophyll meter for nitrogen management in corn[J]. Journal of Plant Nutrition, 1998, 21(4): 741-755.
[15] 孟晋. 基于消费级近红外相机的水稻叶片叶绿素(SPAD)分布问题研究[D]. 武汉:华中农业大学,2017. Meng Jin. Research On Chlorophyll Distribution Of The Rice Based On Consumer-Grade Near-Infrared Camera[D]. Wuhan:Huazhong Agricultural University, 2017. (in Chinese with English Abstract)
[16] Neto A, Lopes D C, Pinto F, et al. Vis/NIR spectroscopy and chemometrics for non-destructive estimation of water and chlorophyll status in sunflower leaves[J]. Biosystems Engineering, 2017, 155: 124-133.
[17] Schouten R E, Farneti B, Tijskens L, et al. Quantifying lycopene synthesis and chlorophyll breakdown in tomato fruit using remittance VIS spectroscopy[J]. Postharvest Biology and Technology, 2014, 96: 53-63.
[18] 程萌,张俊逸,李民赞,等. 用于微小型光谱仪的冬小麦抽穗期叶绿素含量诊断模型[J]. 农业工程学报,2017,33(增刊1):157-163. Cheng Meng, Zhang Junyi, Li Minzan, et al. Chlorophyll content diagnosis model of winter wheat at heading stage applied in miniature spectrometer[J]. Transactions of the Chinese Society of Agricultural Engineering (Transactions of the CSAE), 2017, 33 (Supp.1): 157-163. (in Chinese with English Abstract)
[19] 石吉勇,邹小波,赵杰文,等. 近红外光谱技术快速无损诊断黄瓜植株氮、镁元素亏缺[J]. 农业工程学报,2011,27(8):283-287. Shi Jiyong, Zou Xiaobo, Zhao Jiewen, et al. Rapid and non-destructive diagnostics of nitrogen and magnesium deficiencies in cucumber plants by near-infrared spectroscopy [J]. Transactions of the Chinese Society of Agricultural Engineering (Transactions of the CSAE), 2011, 27(8): 283-287. (in Chinese with English Abstract)
[20] 吴伟斌,李佳雨,张震邦,等. 基于高光谱图像的茶树LAI与氮含量反演[J]. 农业工程学报,2018,34(3):195-201. Wu Weibin, Li Jiayu, Zhang Zhenbang, et al. Estimation model of LAI and nitrogen content in tea tree based on hyperspectral image[J]. Transactions of the Chinese Society of Agricultural Engineering (Transactions of the CSAE), 2018, 34(3): 195-201. (in Chinese with English Abstract)
[21] 孙红,郑涛,刘宁,等. 高光谱图像检测马铃薯植株叶绿素含量垂直分布[J]. 农业工程学报,2018,34(1):149-156. Sun Hong, Zheng Tao, Liu Ning, et al. Vertical distribution of chlorophyll in potato plants based onhyperspectral imaging[J]. Transactions of the Chinese Society of Agricultural Engineering (Transactions of the CSAE), 2018, 34(1): 149-156. (in Chinese with English Abstract)
[22] Shi J Y, Chen W, Zou X B, et al. Detection of triterpene acids distribution in loquat (Eriobotrya japonica) leaf using hyperspectral imaging[J]. Spectrochimica Acta Part A-Molecular and Biomolecular Spectroscopy, 2018, 188(5): 436-442.
[23] Shi J Y, Hu X T, Zou X B, et al. A rapid and nondestructive method to determine the distribution map of protein, carbohydrate and sialic acid on Edible bird's nest by hyper-spectral imaging and chemometrics[J]. Food Chemistry, 2017, 229(15): 235-241.
[24] Wu X, Song X L, Qiu Z J, et al. Mapping of TBARS distribution in frozen-thawed pork using NIR hyperspectral imaging[J]. Meat Science, 2016, 113: 92-96.
[25] Lohumi S, Lee S, Lee H, et al. Application of hyperspectral imaging for characterization of intramuscular fat distribution in beef[J]. Infrared Physics & Technology, 2016, 74: 1-10.
[26] Zhu F L, Zhang H L, Shao Y N, et al. Mapping of fat and moisture distribution in atlantic salmon using near-infrared hyperspectral imaging[J]. Food and Bioprocess Technology, 2014, 7(4): 1208-1214.
[27] Zou X B, Shi J Y, Hao L M, et al. In vivo noninvasive detection of chlorophyll distribution in cucumber (Cucumis sativus) leaves by indices based on hyperspectral imaging[J]. Analytica Chimica Acta, 2011, 706(1): 105-112.
[28] 石吉勇,邹小波,赵杰文,等. 基于GA-ICA和高光谱图像技术的黄瓜叶叶绿素检测[J]. 江苏大学学报(自然科学版),2011,32(2):134-139. Shi Jiyong, Zou Xiaobo, Zhao Jiewen, et al. Measurement of chlorophyll content in cucumber leaves based on GA-ICA and hyper-spectral imaging technique[J]. Journal of Jiangsu University (Natural Science Edition), 2011, 32(2): 134-139. (in Chinese with English Abstract)
[29] 邹小波,张小磊,石吉勇,等. 基于高光谱图像的黄瓜叶
片叶绿素含量分布检测[J]. 农业工程学报,2014,30(13):169-175. Zou Xiaobo, Zhang Xiaolei, Shi Jiyong, et al. Detection of chlorophyll content distribution in cucumber leaves based on hyperspectral imaging [J]. Transactions of the Chinese Society of Agricultural Engineering (Transactions of the CSAE), 2014, 30(13): 169-175. (in Chinese with English Abstract)
[30] 石吉勇,张芳,胡雪桃,等. 基于高光谱技术的乳杆菌快速鉴别[J]. 中国食品学报,2018,18(8):208-213. Shi Jiyong, Zhang Fang, Hu Xuetao, et al. Rapid identification of five kinds of lactic acid bacteria based on hyperspectral technology[J]. Journal of Chinese Institute of Food Science and Technology, 2018,18(8): 208-213. (in Chinese with English Abstract)
[31] Shi J Y, Zoui X B, Zhao J W, et al. Nondestructive diagnostics of nitrogen deficiency by cucumber leaf chlorophyll distribution map based on near infrared hyperspectral imaging[J]. Scientia Horticulturae, 2012, 138: 190-197.
Diagnosis of nitrogen and magnesium deficiencies based on chlorophyll distribution features of cucumber leaf
Shi Jiyong, Li Wenting, Hu Xuetao, Huang Xiaowei, Li Zhihua, Guo Zhiming, Zou Xiaobo※
(212013,)
Nitrogen (N) and magnesium (Mg) elements play important role in the growth of cucumber plants, N and Mg deficiencies in cucumber plants drastically affects the quality and most importantly yield of agricultural products. In the published papers, chlorophyll content was used as an indicator for diagnosing N deficiency and Mg deficiency. However, leaf with low chlorophyll content appears both in N deficient and Mg deficient plans, which makes it is difficult to simultaneously detect N and Mg deficiencies using chlorophyll content. In this study, new indicators based on chlorophyll distribution features of the whole cucumber leaves were proposed for diagnostics of N and Mg deficiencies. N deficient, Mg deficient and control cucumber plants were cultured in a greenhouse with special nutrient supply. The content of N and Mg nutrient elements in N deficient, Mg deficient and control leaves were determined to test the nutrient status of cucumber plants in N deficient, Mg deficient and Control groups. 100 fresh cucumber leaves were collected and used as samples for detecting a chlorophyll distribution map. Firstly, hyperspectral images of cucumber leaves in the calibration set were collected and chlorophyll content of the cucumber leaves was determined using high performance liquid chromatography technology. Chlorophyll content calibration models were built using the hyperspectral images and chlorophyll content. Secondly, the hyperspectral images and chlorophyll content of cucumber samples in testing set were used to test the chlorophyll content calibration models, and the chlorophyll content calibration model with the best performance was selected as the optimal calibration model. The chlorophyll content distribution maps of N deficient, Mg deficient and control cucumber leaves were measured using the optimal chlorophyll content calibration model. After hyperspectral image collecting, hyperspectral image data of N deficient, Mg deficient and control leaves were obtained. Then, the spectral data of every pixel in the hyperspectral images was extracted and substituted in the optimal chlorophyll content calibration model to calculate the chlorophyll content at each pixel. The chlorophyll content of all pixels were displayed in two dimension spastically, then the chlorophyll content distribution maps of N deficient, Mg deficient and control leaves were obtained. The chlorophyll content distribution maps of 25 N deficient cucumber leaves, 25 Mg deficient cucumber leaves and 25 control cucumber leaves were determined. Compared with the distribution map of chlorophyll content in the control leaves, N deficiency led to the decrease of chlorophyll content in the whole leaf, and Mg deficiency led to the decrease of chlorophyll content in the area between the main veins. According to these results, two chlorophyll distribution features, the average and standard deviation of chlorophyll content at every pixels in a chlorophyll distribution map, were extracted for diagnosing N deficiency and Mg deficiency. Result showed that an average of chlorophyll content (11.5 mg/g) could be used as a threshold value to diagnose N deficiency, and the diagnostic rates for the calibration set and prediction set were 100% and 90%, respectively. A standard deviation of chlorophyll content (2.20 mg/g) could be used as a threshold value to diagnose Mg deficiency, and the diagnostic rates for the calibration set and prediction set were 93.3% and 90%, respectively. The result indicated that the extracted features could reflect the characteristic of N and Mg deficient cucumber leaves and could be employed to diagnose N and Mg deficiency nondestructively.
chlorophyll; spectrum analysis; models; distribution; cucumber leaf; nitrogen; magnesium; hyperspectral imaging
10.11975/j.issn.1002-6819.2019.13.019
O657.3
A
1002-6819(2019)-13-0170-06
2019-01-18
2019-05-26
国家自然科学基金(31772073, 60901079);江苏省重点研发计划(BE2016306);江苏省六大人才高峰(GDZB-016);江苏省自然科学基金(BK20130505);中国博士后科学基金(2016M600379);江苏省高校自然科学研究面上项目(16KJB550002)和江苏省博士后科研资助(1601080B)联合资助。
石吉勇,副教授,研究方向为食品无损检测。Email:shi_jiyong@ujs.edu.cn
邹小波,教授,研究方向为食品无损检测。Email:zou_xiaobo@ujs.edu.cn
石吉勇,李文亭,胡雪桃,黄晓玮,李志华,郭志明,邹小波.基于叶绿素叶面分布特征的黄瓜氮镁元素亏缺快速诊断[J]. 农业工程学报,2019,35(13):170-176. doi:10.11975/j.issn.1002-6819.2019.13.019 http://www.tcsae.org
Shi Jiyong, Li Wenting, Hu Xuetao, Huang Xiaowei, Li Zhihua, Guo Zhiming, Zou Xiaobo.Diagnosis of nitrogen and magnesium deficiencies based on chlorophyll distribution features of cucumber leaf[J]. Transactions of the Chinese Society of Agricultural Engineering (Transactions of the CSAE), 2019, 35(13): 170-176. (in Chinese with English abstract) doi:10.11975/j.issn.1002-6819.2019.13.019 http://www.tcsae.org