Economic Analysis of Low Salinity Polymer Flooding Potential in the Niger Delta Oil Fields
2019-08-04IhekoronyeIzuwaObahEkwueme
K. K. Ihekoronye; N. C. Izuwa; B. O. Obah; S. T. Ekwueme
[a] Petroleum engineering, Federal University of Technology Owerri, Nigeria.
Abstract With the current growing demand for oil, oil price and the concerns about future oil supplies increases the pressure in securing oil resources. Enhanced oil recovery processes are applied to recover oil not produced by natural and secondary energy drive of the reservoir. In this study,Simulation has been carried out on a hypothetical model using (ECLIPSE 100) as the simulator.Three cases natural depletion, waterflooding, and injection of low saline polymer were considered.5-spot pattern of four vertical producers wells and one vertical injector well was used as a hypothetical well model. Economics analysis were carried out in this three scenario to determine their net present value, profit per dollar invested, payout and Discounted flow-rate of return. The results shows that low salinity polymer flooding has the highest recovery of 62% and profit with NPV @ 10 ($412.9MM), payout 0.9 years, profit per dollar invested $25.9 and dcf-ror 82%. However, waterflooding gave recovery of 42%. NPV @10 ($ 317.3MM), payout 1.2 years,profit per dollar invested $20.8, dcf-ror 78%. Natural depletion gave recovery of 16.5 %, profit with NPV @10 (230.0MM), payout 1.0 years, profit per dollar invested $9.3, dcf-ror 78%.Decision rule was applied using NPV, DCF-ROR, NCR and payout which states that project with higher NPV, DCF-ROR, NCR and less Payout are more economically viable. The result of the three cases considered shows that low salinity polymer injection is more profitable followed by waterflooding and natural depletion.
Key words: Low Salinity Polymer; Economics; Net Present Value; Profit and Discounted Rate of Return
1. INTRODUCTION
Low salinity waterflooding is an enhanced oil recovery method that uses water with a low concentration of dissolved salts as a flooding medium (Morrow et al, 2011). Polymer flooding, which is a technique for enhanced oil recovery (EOR), is the process of injecting a viscous polymer solution into the reservoir. Polymer flooding is now considered to be a technically and commercially proven EOR method. Low salinity waterflooding is an incremental oil recovery technique used to improve oil production by reducing the amount of residual oil saturation within the reservoir by subjecting it to waterfloods containing low concentration of salts or simple having low salinity (Morrow et al, 2011). Polymer flooding is applied to reservoirs as a tertiary method when water-flooding has reached its recovery efficiency limit (Green and Wilhite, 1998). Low salinity increases polymer solution viscosity that can improve sweep efficiency of polymer flooding (Natthaporn, 2012). Robertson(2007) reported that oil recovery increases as the salinity of injection brine decreases. Morrow and Buckley (2011)noted that Low salinity waterflooding (LSW), is an emerging and promising EOR process and includes the dilution or change in the ion composition of injection brine. McGuire (2005) noted that when low salinity brine with a salinity of 1500ppm was injected, oil recovery increases from 56% to 73%. He proposed that as low salinity water is injected into the core, hydroxyl ions are generated through reactions with the clay minerals present in the reservoir. Lighthelm et al (2009) proposed that wettability modification toward water-wet is the main mechanism for Low Salinity Waterflooding.
2. METHODOLOGY
Steps adopted in this study are as follows;
i. Reservoir data (PVT, SCAL, Pressure).
ii. Building a hypothetical model representing Niger Delta reservoir model
iii. Reservoir simulation was ran for natural depletion, waterflooding and low salinity polymer
iv. Reservoir software (Eclipse100) provides a mean to generate field oil efficiency, oil production total, field pressure and field water cut.
v. Excel package used for Economic analysis.
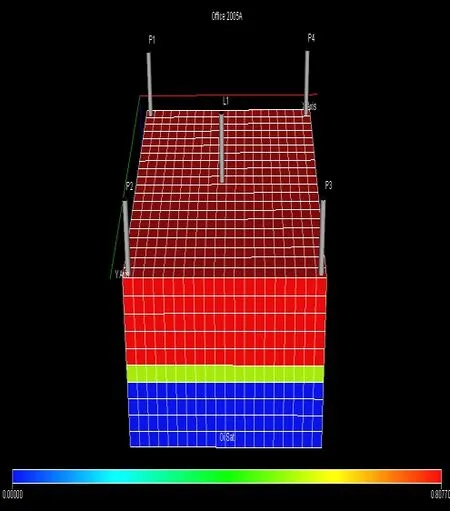
Figure 1: Reservoir well connections
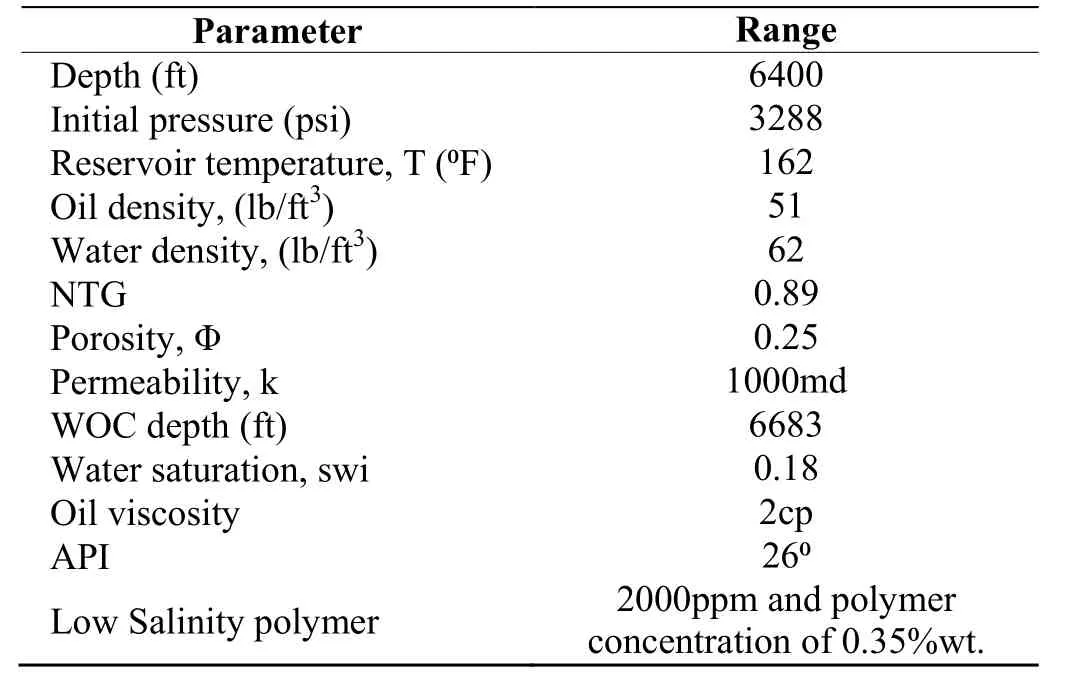
Table 1 Reservoir rock and fluid properties for X-field in the niger delta
2.1 Reservoir Model Description
A hypothetical model was designed having a centre blocked linear model. The reservoir model has grid block size of 20×20×10. The grid cell is 250×250×50 (feet) representing X, Y and Z. The reservoirs have 574 acre making up of 4000 grids as shown below. The simplistic reservoir model used in the simulation was built using the rock and fluid data obtained from X-Field in the Niger Delta as given in Table 1. The well is connected to four vertical oil producers (P1, P2, P3, and P4) and 1 injector. It has a 5 spot pattern for maximum reservoir contact and reservoir sweep.
2.2 PVT Model
The PVT model was defined in the reservoir simulation. When the BRINE keyword is activated in the RUNSPEC,PVTWSALT keyword is used to supply the water PVT data for simulation. However, the keyword PVTDO is used to supply the dead oil PVT data. Polyacrylamide was used as a polymer for this research work.
2.3 Initialization
On initializing the reservoir model in Eclipse black oil model, it was discovered that 220 ,000,000 rb of oil was obtained for this reservoir. However, other property of the reservoir and parameters considered in this research work and reservoir constraints are outlined in detailed in a work by Izuwa et al (2019).
3. ECONOMIC ANALYSIS
3.1 Economic Model
To evaluate the viability and feasibility of low salinity polymer flooding potential in the Niger delta, an economic model was designed to simulate the operation of this projection for a given period of time. Profit indicators that were utilized in evaluating the profitability of this design include the following:
i.NPV: NPV is the measure of profitability of any project. The net present value (NPV) or net present worth(NPW) of a time series of cash flows, both incoming and outgoing.
ii. Payout period (PO): The payout for a project refers to the time at which the initial investment on the project is just recovered. It could also be the time at which cumulative NCR becomes zero.
iii. Profit per dollar invested: it is the ratio of cumulative net cash recovery to CAPEX
iv. DCF-ROR: Discounted Cash flow-Rate of return: It is the discount rate that returns the NPV of a project to zero.
3.2 Decision Rule
To embark on any capital intensive projects in the oil and gas industry, it is usually good to proceed with such projects if the profitability calculations are in line with the following decision rules (Obah, 1999).
i. NPV (accept the highest and NPV greater than zero)
ii. Payout period (the shorter the better)
iii. Profit per dollar invested (the highest the better)
iv. DCF-ROR (accept if >10%).
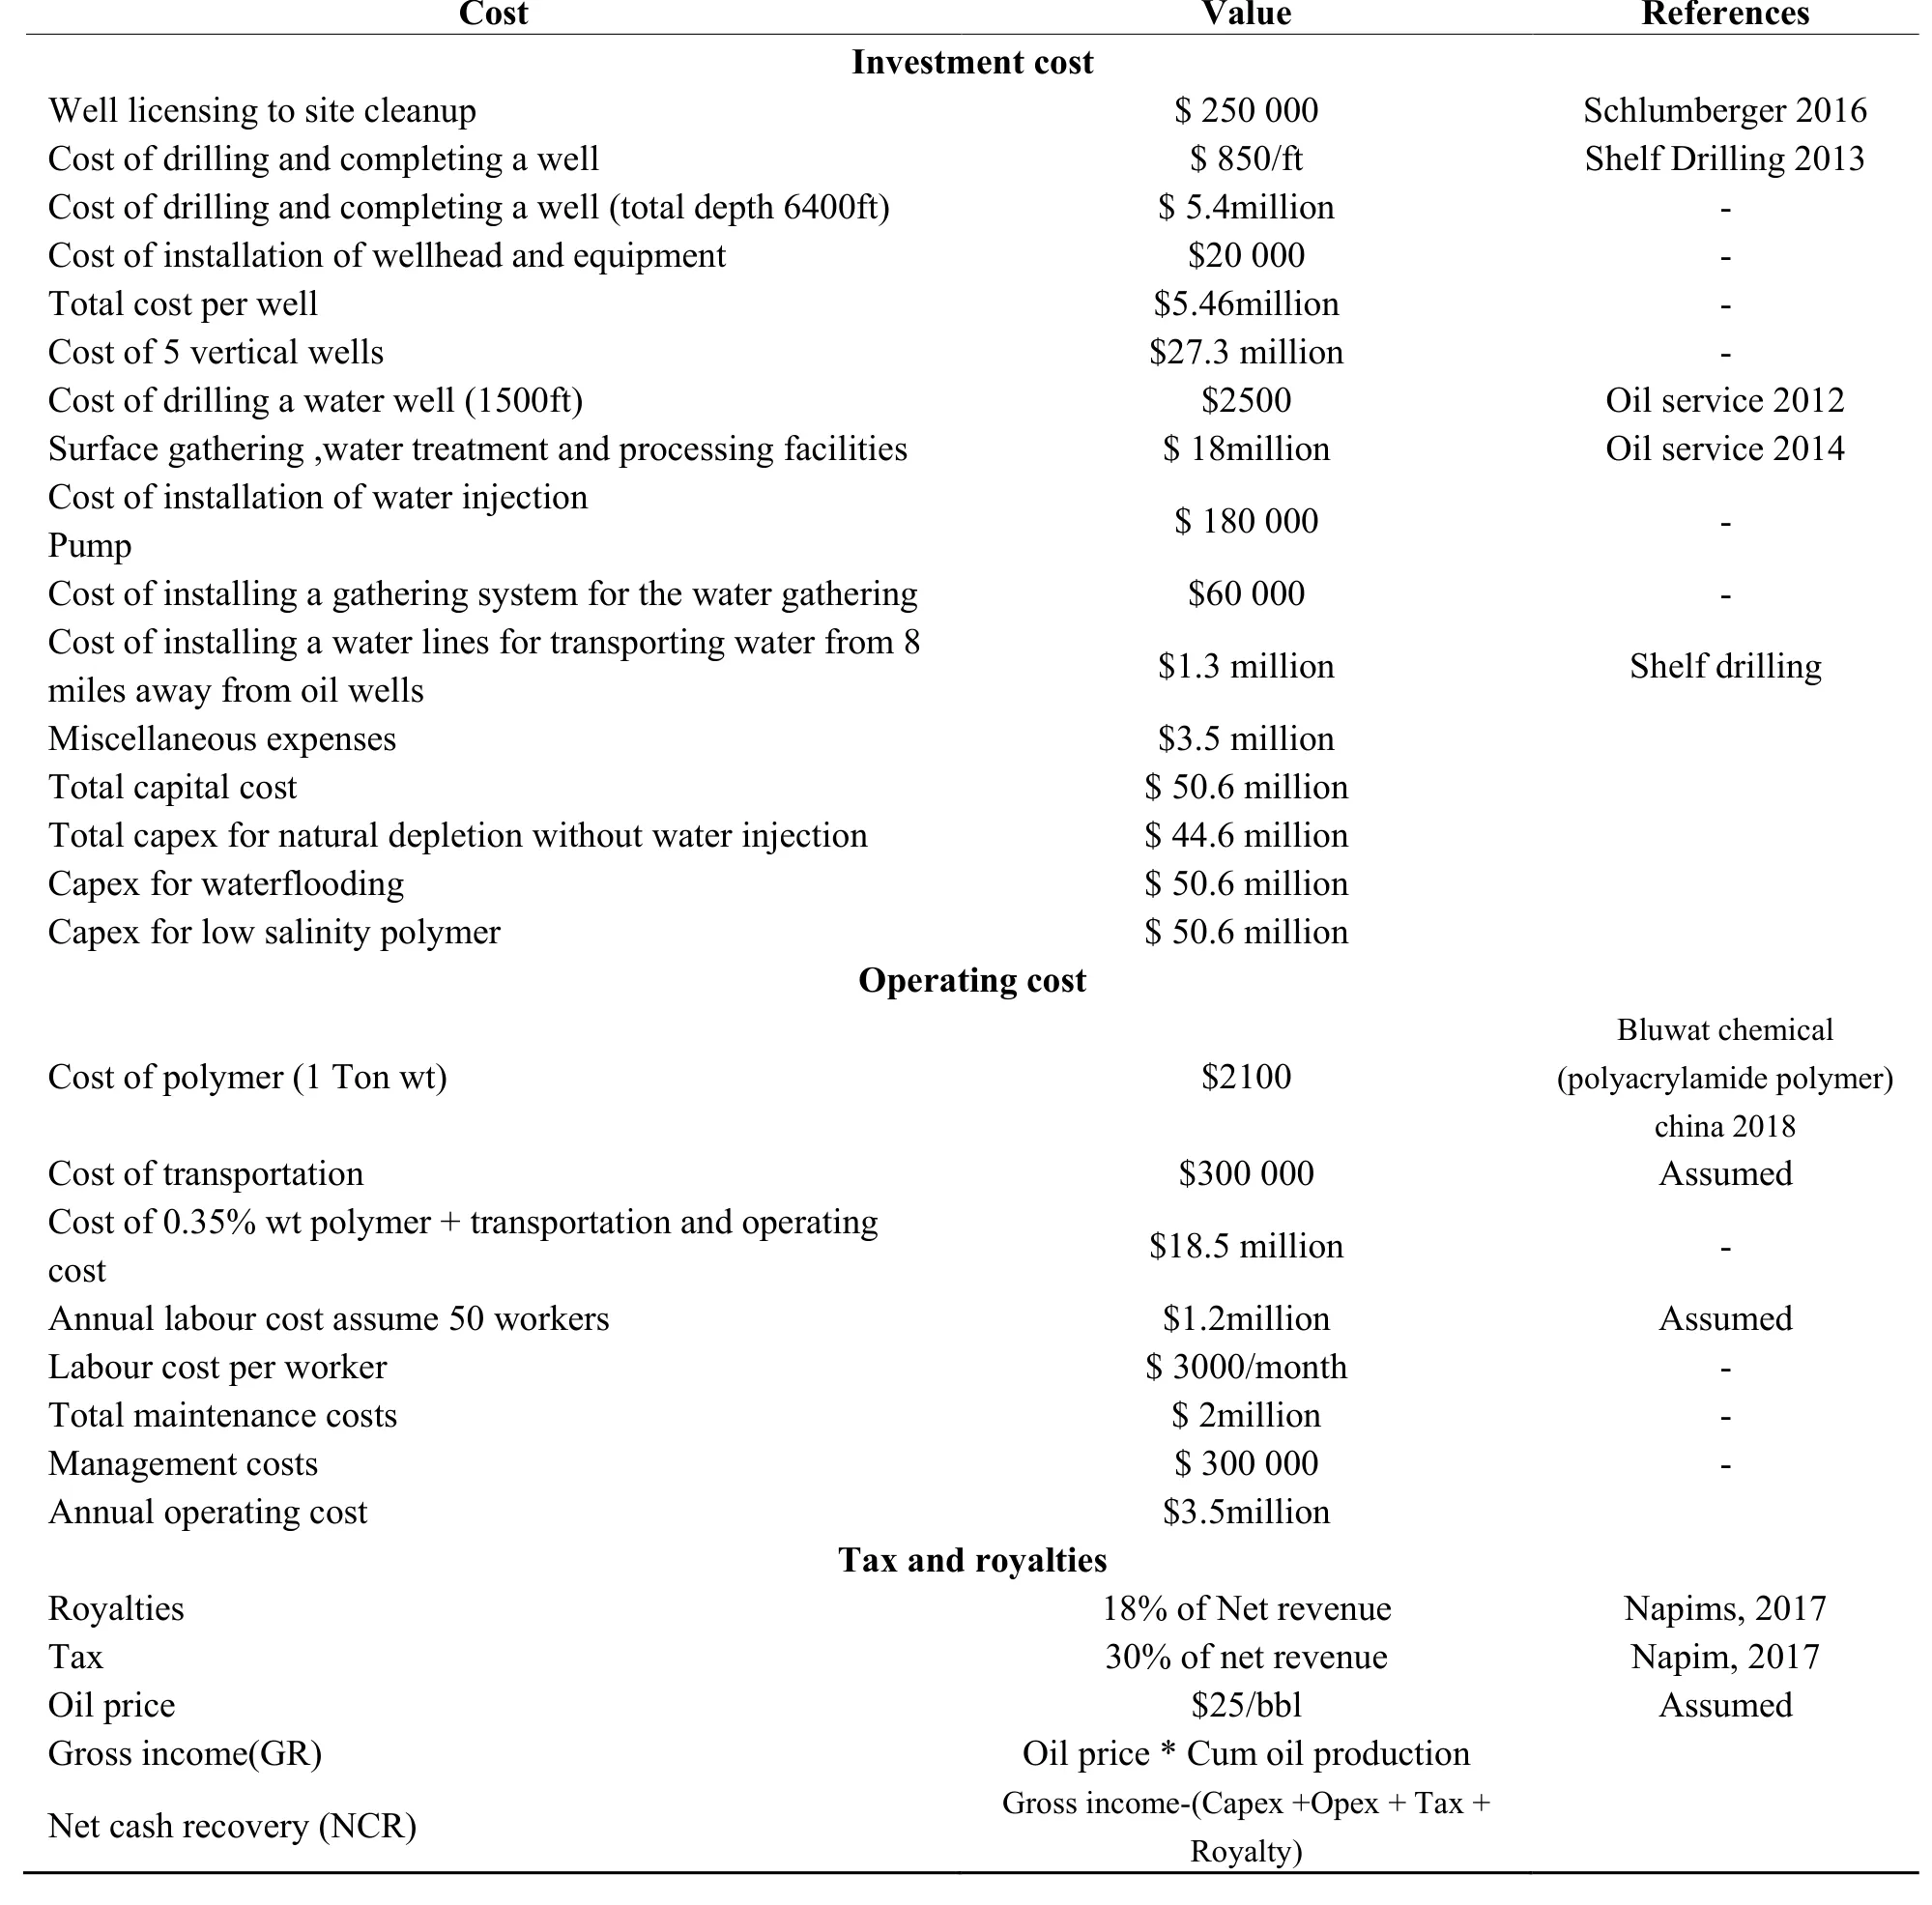
Table 2 Cost of Items, taxes and royalties used for the economic analysis
4. RESULTS PRESENTATION
The results of natural depletion, waterflooding and low salinity polymer flood simulation are presented below to determine their oil recovery factor, oil production rate, field water cut and field pressure.
4.1 Production Forecast for Natural Depletion
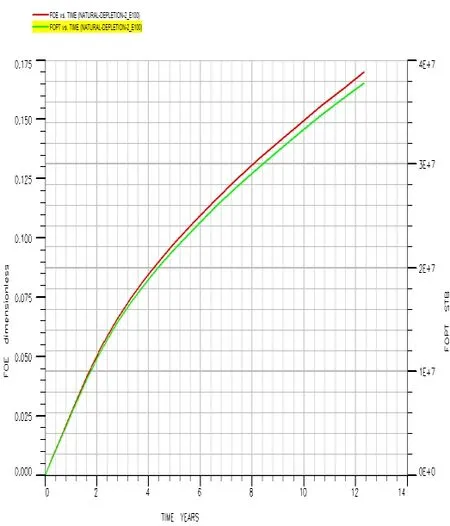
Figure 2: Plot of recovery factor and cumulative oil production against Time for natural depletion
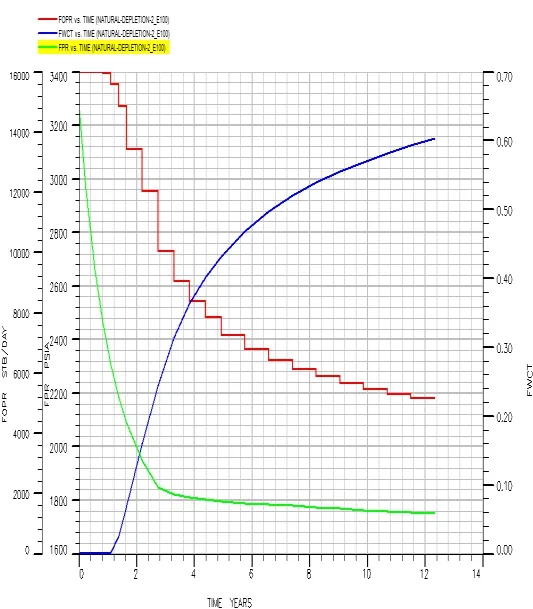
Figure 3: Plot of field water cut, pressure and production rate against Time for natural depletion
4.2 Production Forecast for Waterflooding
Waterflooding was used as the base case. This flooding technique was evaluated to determine the recovery factor(FOE), field water cut (FWCT), field pressure (FPR), oil production rate (FOPR) and cumulative production total(FOPT).
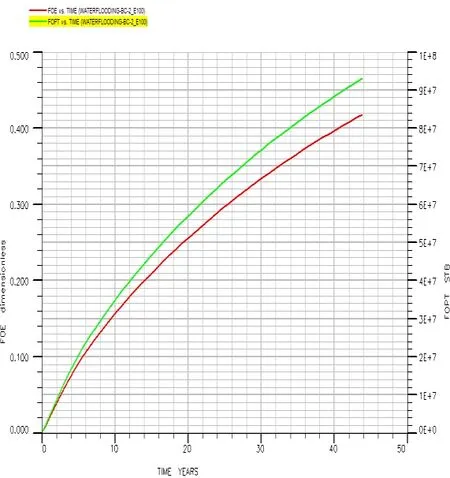
Figure 4: Plot of recovery factor and cumulative oil production total against Time for waterflooding
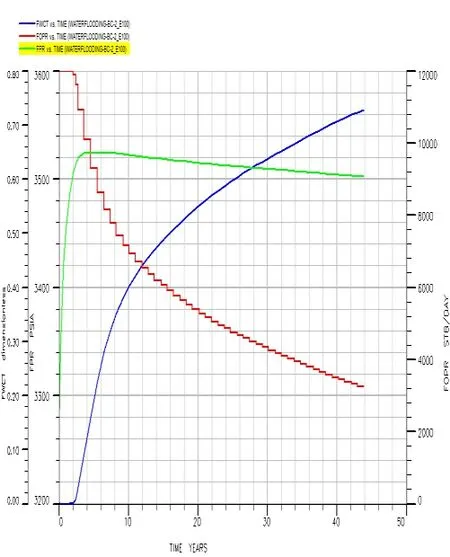
Figure 5: Plot of field water cut, pressure and production rate against Time for waterflooding
4.3 Production Forecast for Low Salinity 2000ppm With Polymer Concentration(0.35%wt)
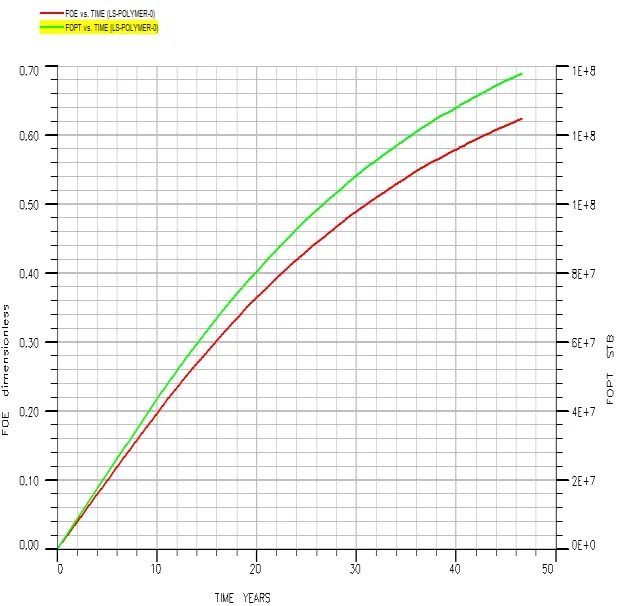
Figure 6: Plot of recovery factor and cumulative production total against time for POL 0.35% wt 2000ppm salinity
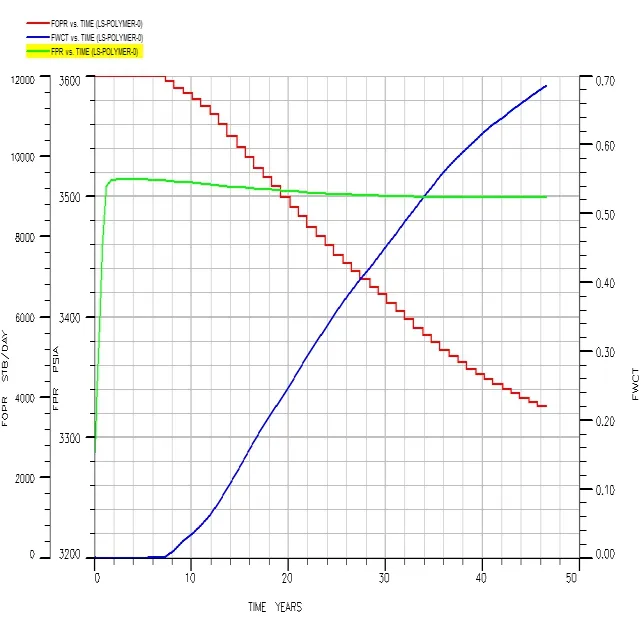
Figure 7: Plot of field water cut, pressure andproduction rate against time for POL 0.35% wt 2000ppm salinity
4.3.1 Summary Results for Cases of Natural Depletion, Waterflooding and Low Salinity Polymer Flooding for X-Field

Table 3 Recovery results for natural depletion, waterflooding and low salinity polymer concentration
4.4 Economic Analysis
4.4.1 Economic Analysis for Natural Depletion
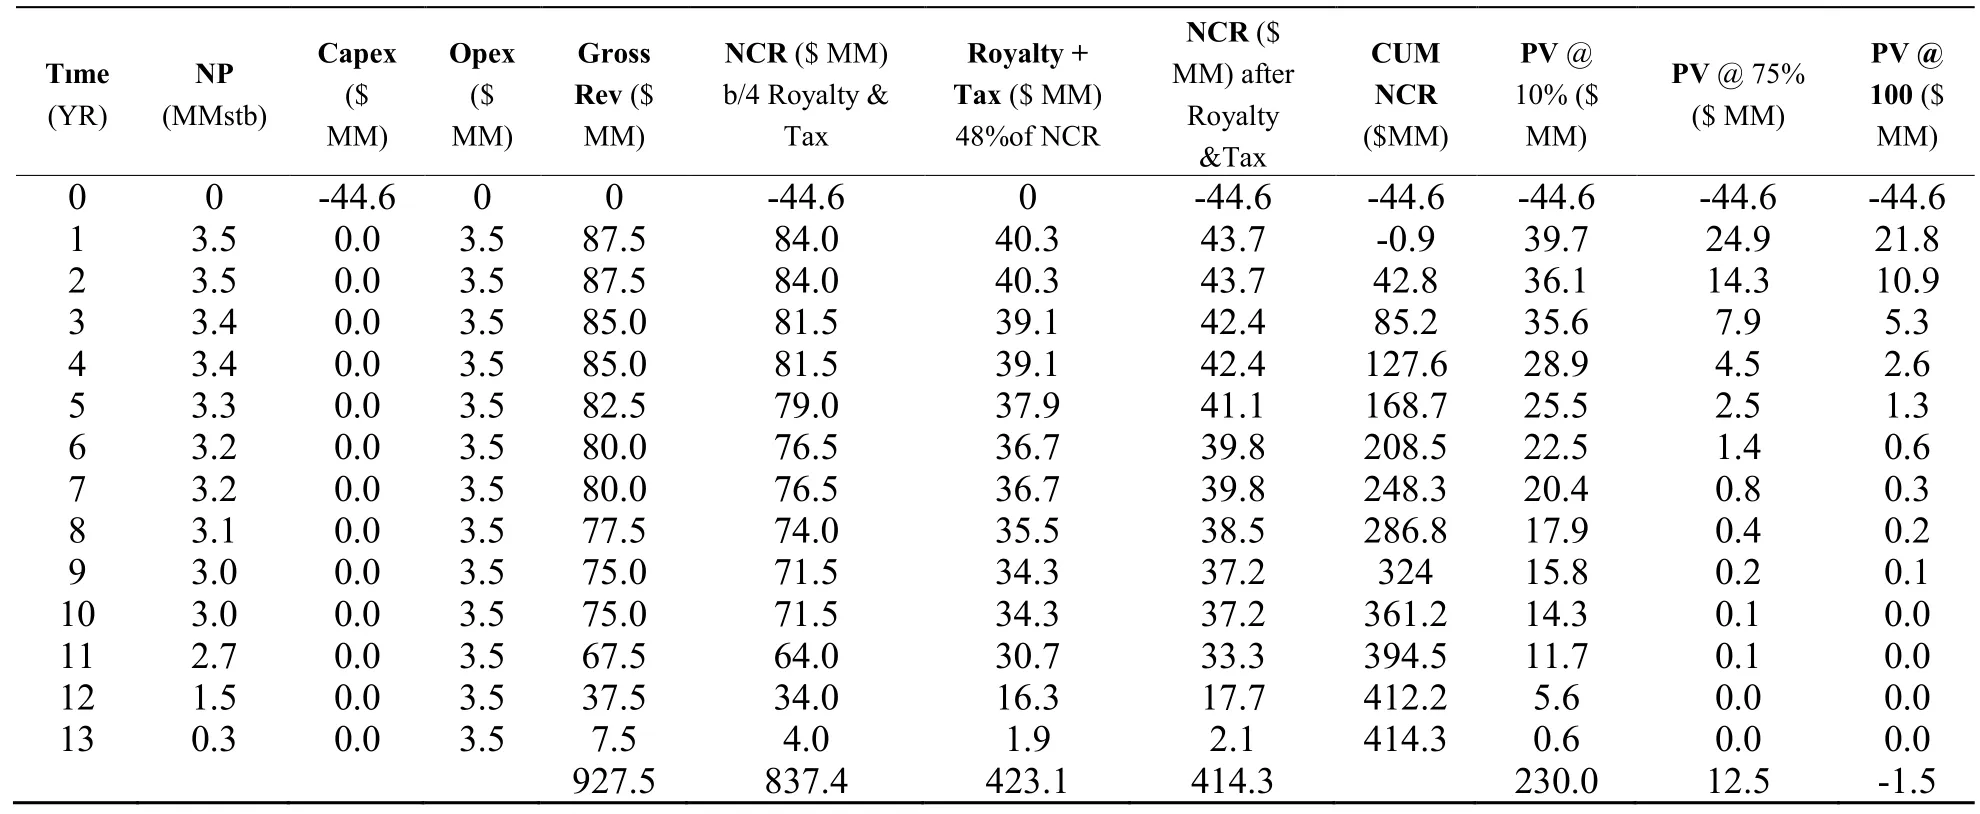
Table 4 Summary of the cash flows for natural depletion
NET PRESENT VALUE:From Table 4, the Net present value, NPV at the expected rate of return and at the discounted rate of 10% which is the sum of all the present values in the column = $230.0 million
When the hour for departure drew near the old mother went to her bedroom, and taking a small knife she cut her fingers till they bled;11 then she held a white rag12 under them, and letting three drops of blood13 fall into it, she gave it to her daughter, and said: Dear child, take great care of this rag: it may be of use to you on the journey. 14
Pay-out (PO)= 0.9/43.7+1= 1.0 years
Profit per Dollar invested:The total net cash recovery for the natural depletion is $414.3 Million and the Capital invested $44.6 Million
P/$ = $ 414.3MM / $44.6 MM = $9.3
DCF-ROR: DCF-ROR is gotten from the graph of Figure 8 for natural depletion, the point where the NPV is equal to zero

Figure 8: DCFROR for natural depletion

Table 5 Result of economic analysis for natural depletion
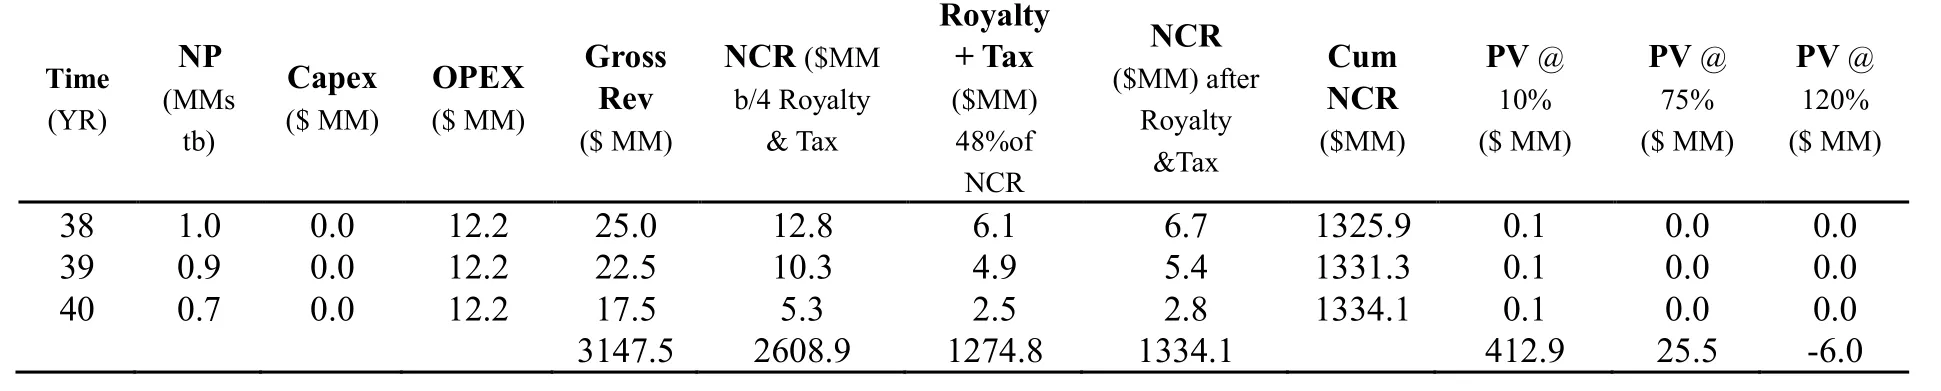
4.4.2 Economic Analysis for Waterflooding
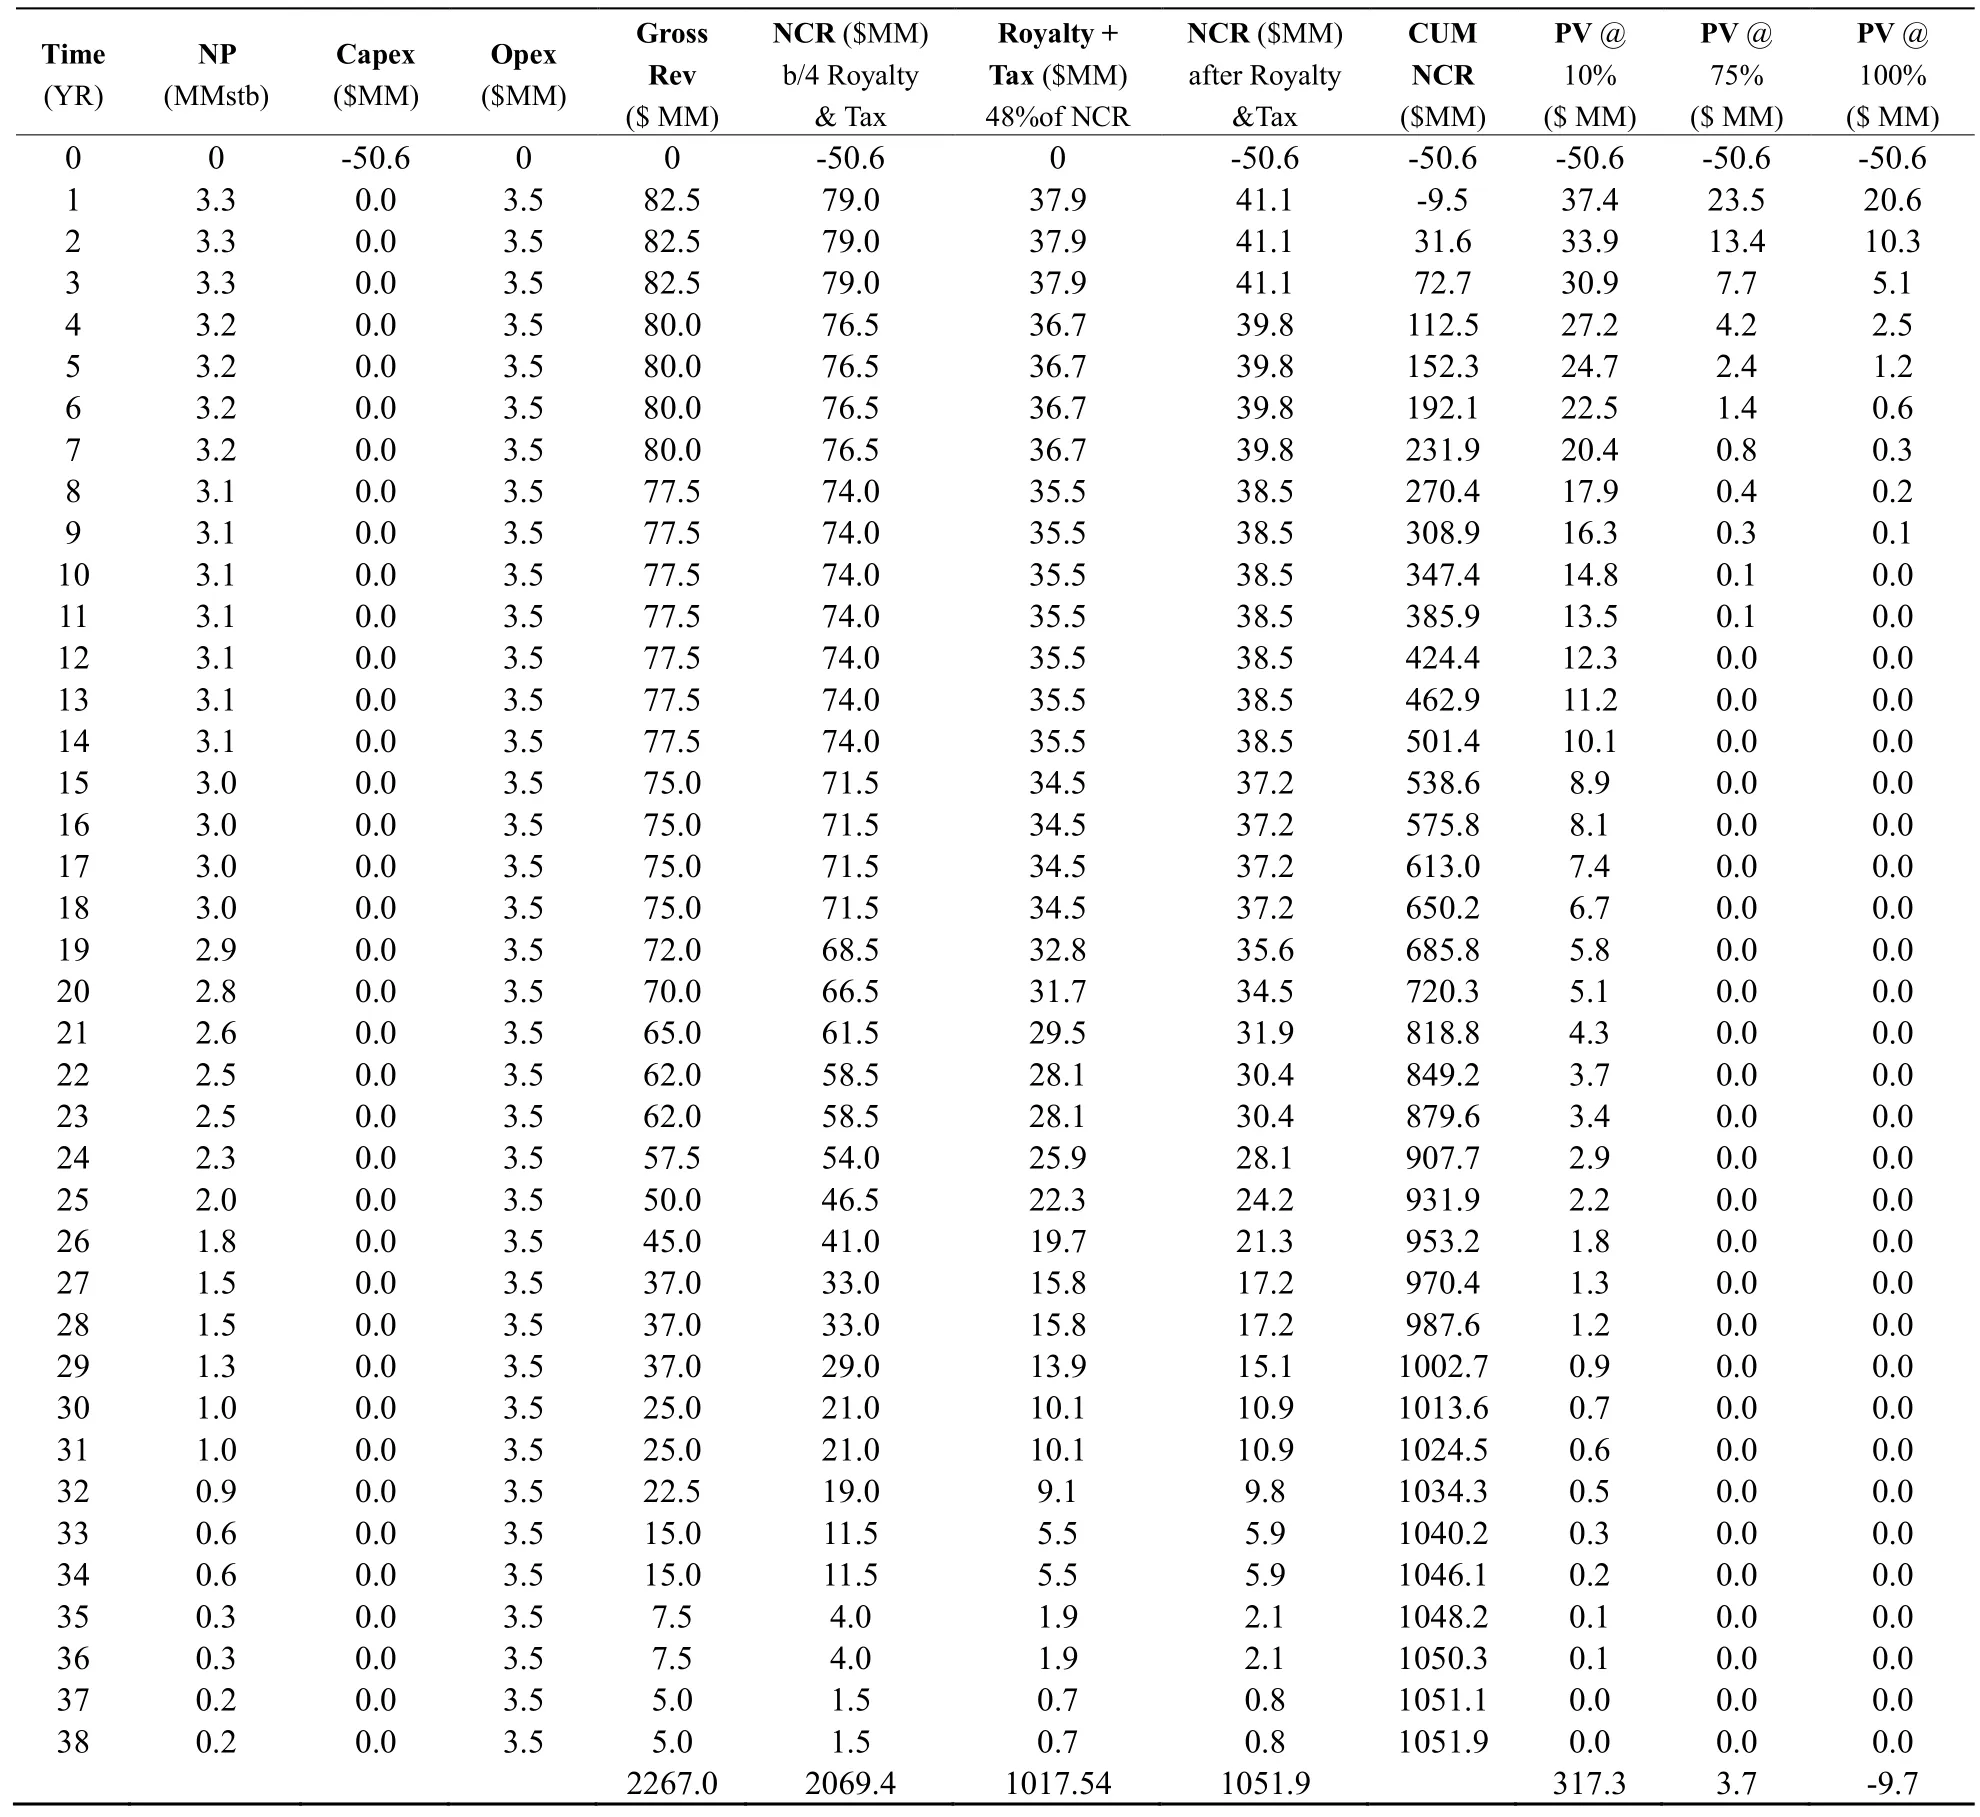
Table 6 Summary of the cash flows for waterflooding
NET PRESENT VALUE:From Table 6, the Net present value, NPV at the expected rate of return and at the discounted rate of 10% which is the sum of all the present values in the column = $317.3 million
Pay-out, (PO)= 9.5/41.1+1 =1.2 years
Profit per Dollar invested: The total net cash recovery for waterflooding is $1051.9 Million and the Capital invested $50.6 Million
P/$ = $1051.9 MM / $50.6 MM = $20.8
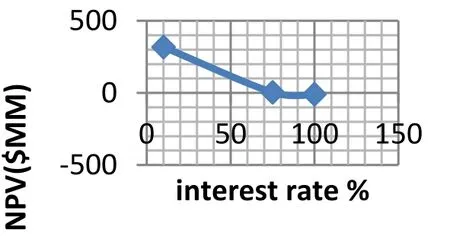
Figure 9: DCFROR for waterflooding.
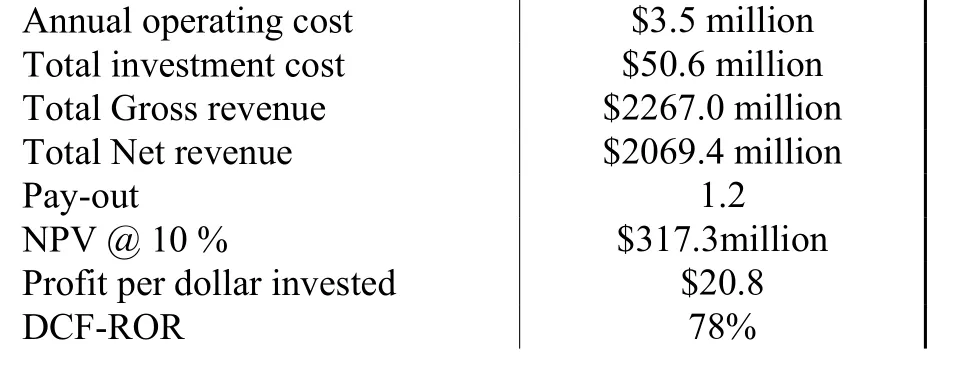
Table 7 Result of economic analysis for waterflooding
4.4.3 Economic Analysis for Low Salinity (2000ppm) With Polymer (0.35% wt)
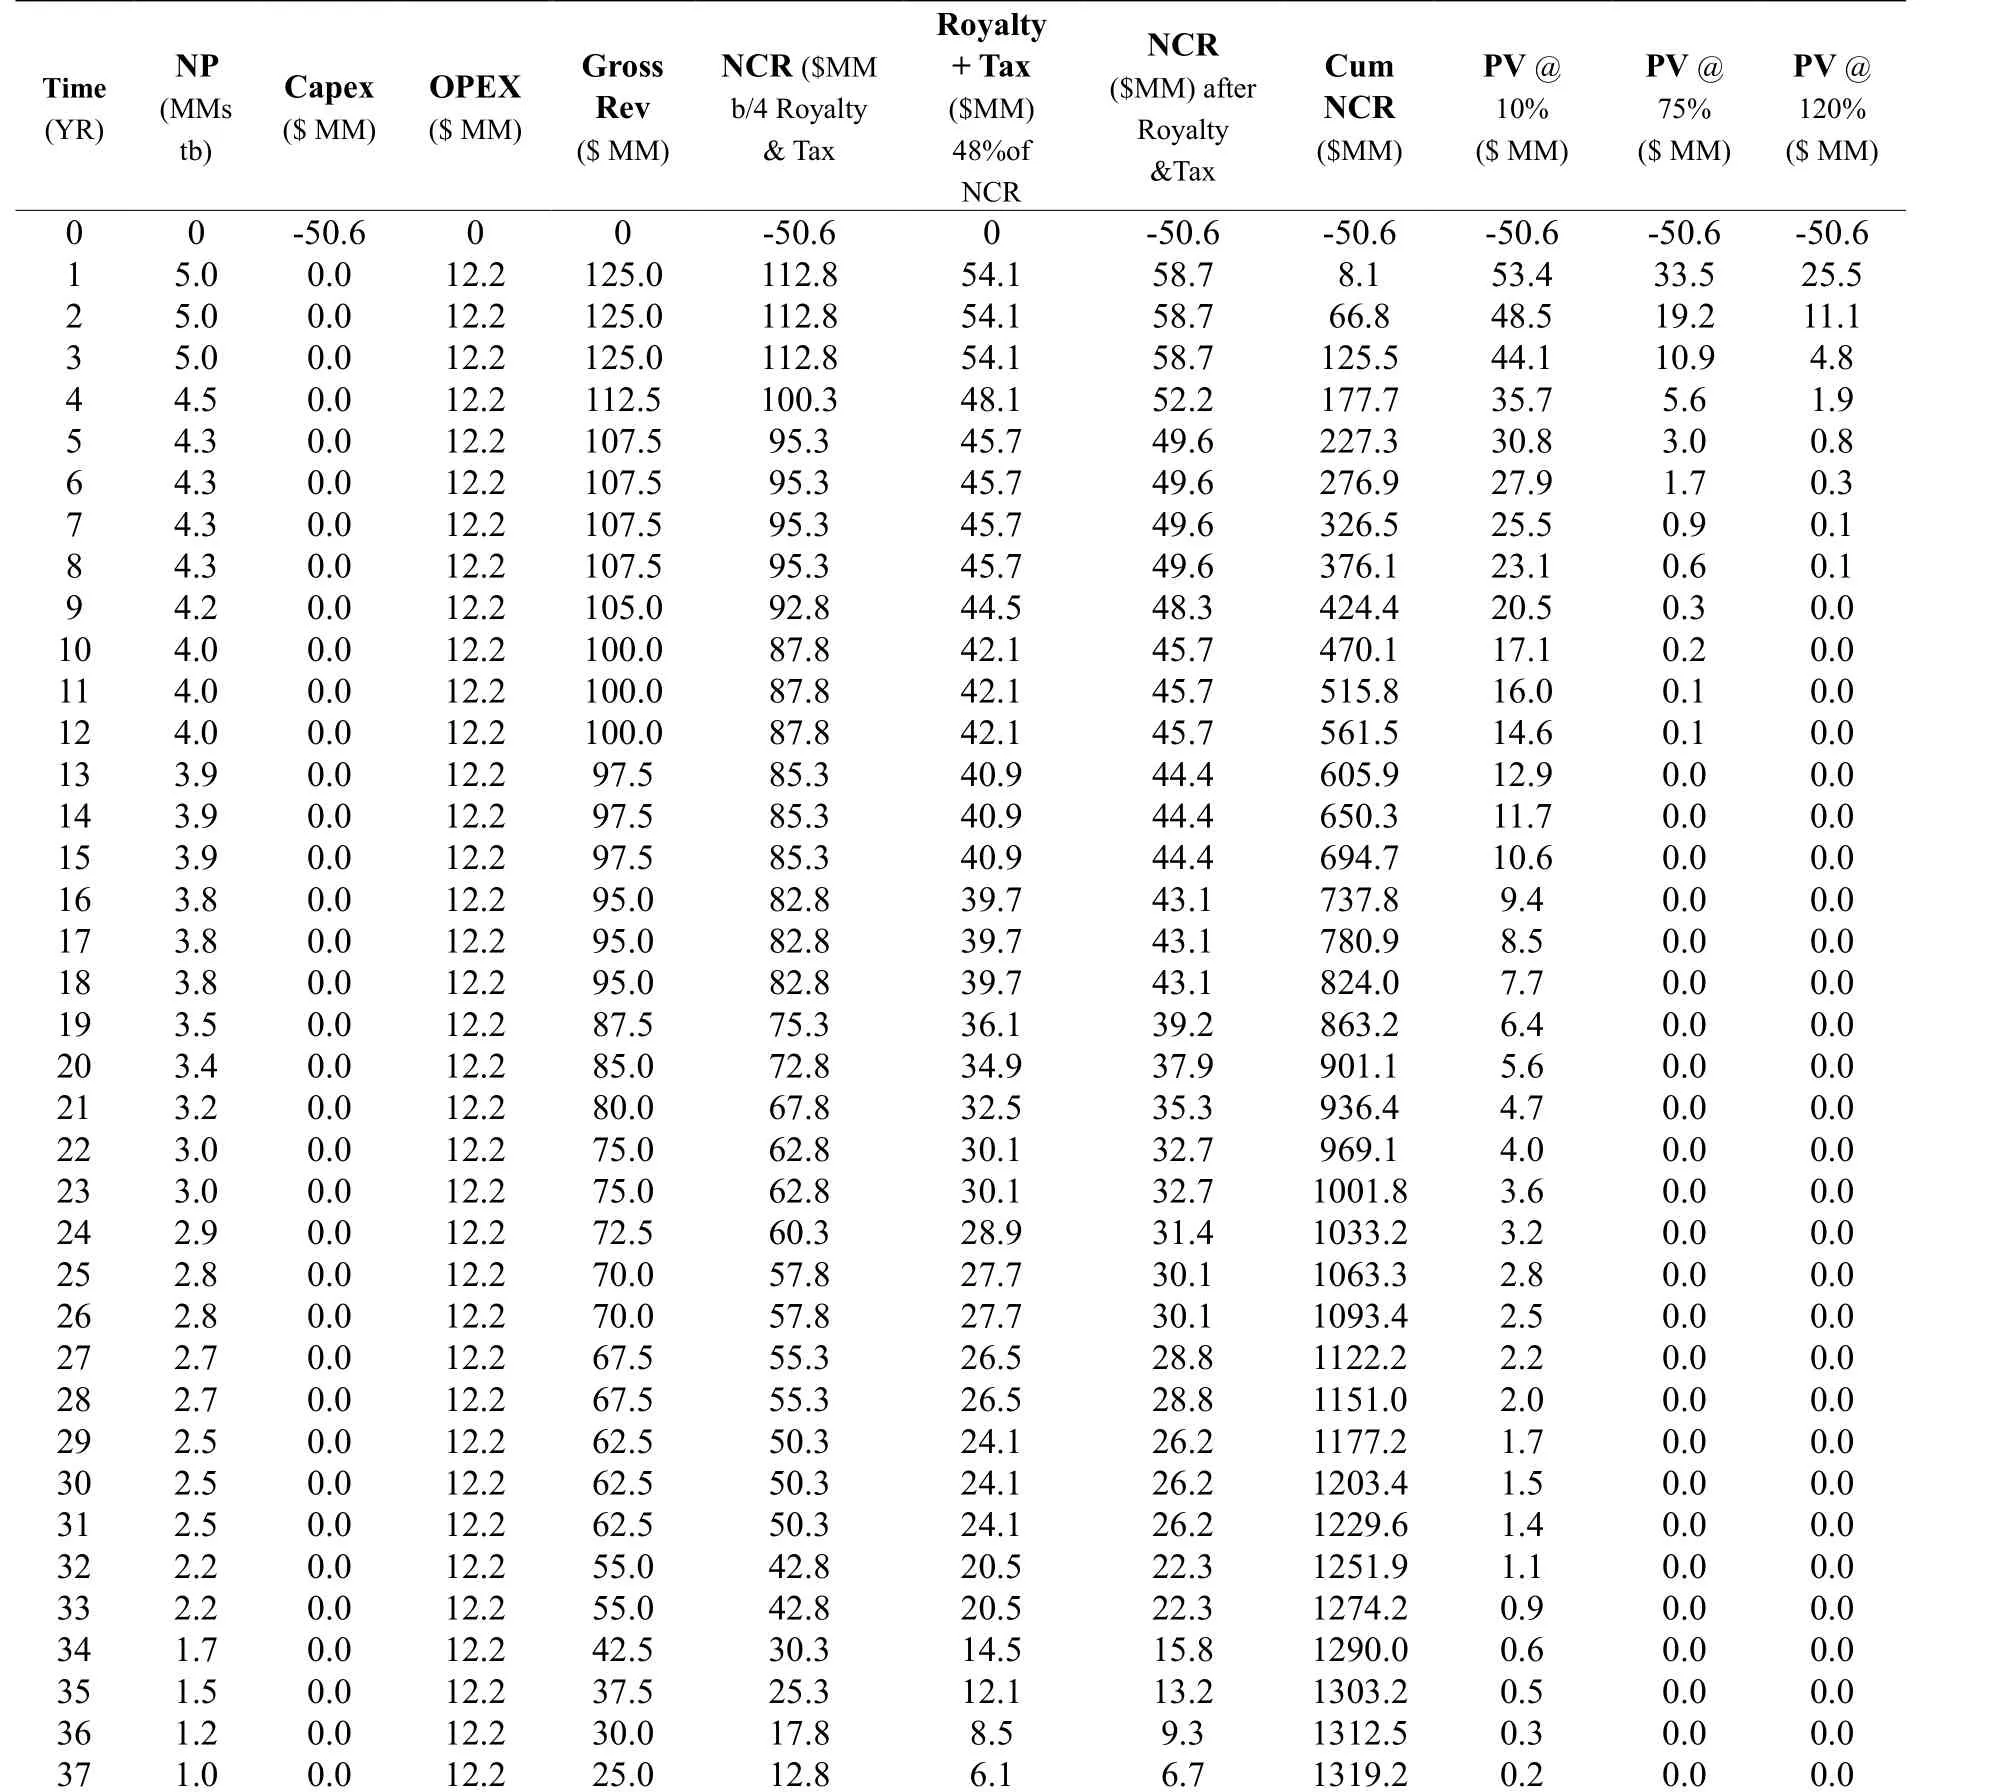
Table 8 Summary of the cash flows for low salinity (2000ppm) with polymer (0.35%wt)
Continued
NET PRESENT VALUE:From Table 9, the Net present value, NPV at the expected rate of return and at the discounted rate of 10% which is the sum of all the present values in the column = $412.9 million
Pay-out (PO)= 50.6/58.7+0= 0.9 year
Profit per Dollar invested:The total net cash recovery for the low salinity polymer flooding is $1311.8 Million and the Capital invested $50.6 Million
P/$ = $1311.8 MM / $50.6 MM = $25.9
DCF-ROR:DCF-ROR is gotten from the graph of Figure 10 for low salinity polymer flooding, the point where the NPV is equal to zero
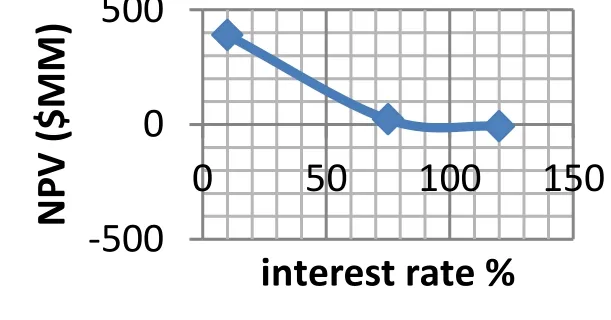
Figure 10: DCFROR for low salinity polymer
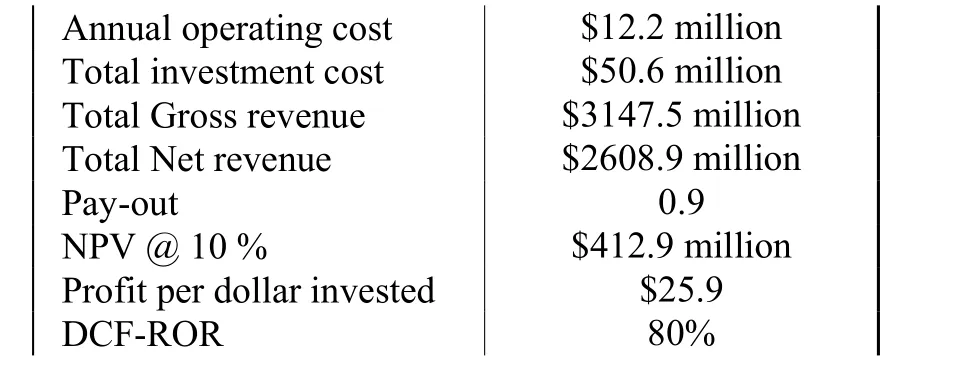
Table 10Result of economic analysis for LS (2000ppm) with polymer (0.35%wt)
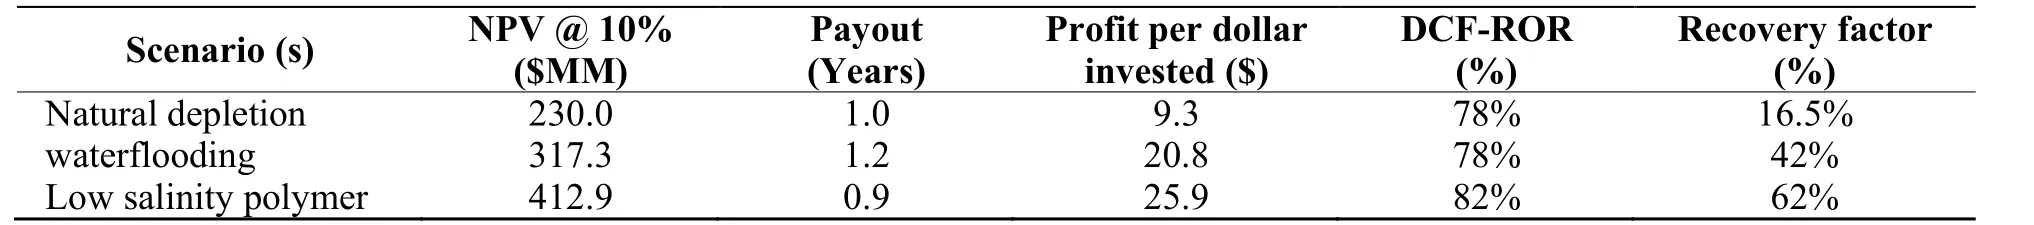
Table 11Summary of the economic analysis for X-oil field
4.5 Discussion of Result
Table 2 shows the cost of items, taxes and royalties used in the analysis, it was observed from the result presentation that injection of low salinity polymer flooding increases recovery as a result of polymer injection which reduces water mobility to enhance reservoir sweep compared to waterflooding and natural depletion cases.In Table 11, it can be observed that the recovery factor for low salinity polymer was 62%, waterflooding 42% and natural depletion 16.5%. From the economic analysis conducted, it can be observed that low salinity (2000ppm)polymer injection (0.35%wt) has the highest profit at NPV @ 10 $412.9 MM. Profit per dollar invested $25.9,payout 0.9 years which is very short time to recover the cost of investment and DCFROR 82% as the earning power is quite good for the project since the oil price is projected at $25. However, in the case of waterflooding,profit at NPV @ 10 $317.3MM. Profit per dollar invested $20.8, payout 1.2 years and DCFROR 78% while natural depletion profit at NPV @ 10 $230.0 MM. Profit per dollar invested $9.3, payout 1.0 years and DCFROR 78%. It can be observed that the payout in waterflooding is higher compared to natural depletion and DCFROR is the same. This is as a result of the cost incurred in the capital expenses and operation expenses. Table 11 summarizes the economic analysis for the different cases considered in this evaluation. Based on the decision rule that Net present value is better when it is highest, Payout period (the shorter is better), Profit per dollar invested(the highest the better), DCF-ROR (accept if >10%). It can be said that the project is more economically viable.Application of low salinity polymer flooding in the Niger Delta oil fields will be realistic to recover by-passed oil not recovered by primary and secondary mechanisms to meet up high demand for energy.
CONCLUSION
From the detailed economic analysis conducted on this research work, the following conclusions are made:
i. injection of low salinity polymer flooding gave higher profit, NPV @ 10 $412.9 MM.
ii From the payout period, natural depletion (1.0 year) appears to be economically viable compared to waterflooding (1.2 years). This is as a result of the cost incurred in capital expenditure, cost of water maintenance and cost of drilling an injector wells).
RECOMMENDATION
More detailed profitability analysis should be carried out incorporating the risk and uncertainty associated with each of the investment choices so that the management can choose wisely when faced with the uncertainties of petroleum exploration.
CONTRIBUTION TO KNOWLEDGE
It will be useful to the oil and gas industries to make proper decision(s) before undertaking on enhance oil recovery project.
杂志排行

Advances in Petroleum Exploration and Development的其它文章
- Description of Shale Pore Fracture Structure Based on Multi-Fractal Theory
- Comparative Analysis of Abnormal Pore Pressure Prediction Models for Niger Delta Oil and Gas Fields Development
- Development of a New Model for Leak Detection in Pipelines
- Optimizing Production in Brown Fields Using Re-Entry Horizontal Wells
- Using Shallow Platform Drilling Technology to Tap the Reserves of the Below Constructed Area of Fuyu Oilfield:Taking Chengping Block 12 as an Example
- Prediction Study of Niger-Delta Brown Fields Using Simulation Horizontal Wells Technology