Alterations of Cerebral Functional Connectivity in Patients with Frontal Lobe Epilepsy:A Graph Theory Study
2019-08-01CAOXinzhiQIANZhiyuXUQiangZHANGZhiqiang
CAO Xinzhi,QIAN Zhiyu,XU Qiang,ZHANG Zhiqiang,
SHEN Junshu4,LU Guangming3*
1.College of Automation Engineering,Nanjing University of Aeronautics and Astronautics,Nanjing 211106,P.R.China;
2.Department of Information,Jiangsu Province Academy of Traditional Chinese Medicine,Jiangsu Province Hospital on Integration of Chinese and Western Medicine,Nanjing 210028,P.R.China;
3.Department of Medical Imaging,Jinling Hospital,Medical School of Nanjing University,Nanjing 210002,P.R.China;
4.Department of Equipment,Jiangsu Province Academy of Traditional Chinese Medicine,Jiangsu Province Hospital on Integration of Chinese and Western Medicine,Nanjing 210028,P.R.China
Abstract: The aim of the present study is to investigate the brain functional network changes of patients with frontal lobe epilepsy(FLE)by resting-state functional magnetic resonance imaging(rsfMRI)and graph theoretical analysis.rsfMRI is performed in 46 adult patients with FLE and 46 age-matched healthy controls(HCs). A functional network is built from these subjects,and the topological properties of such network are analyzed quantitatively using graph theoretical methods. According to the results,both FLE patients and HCs exhibit prominent small-world features.Compared with HCs,FLE shows a decrease in local efficiency(Eloc),clustering coefficient,nodal efficiency as well as nodal degree. Furthermore,FLE(seven)has fewer hubs than HCs(ten). The functional abnormalities in the network organization suggest functional disturbances in patients with FLE. This study helps to gain new insights into the functional disorder in patients with FLE. The networks built here can also be a set of potential biomarkers for the diagnosis,monitoring and the treatment of FLE.
Key words: functional MRI;graph theory;frontal lobe epilepsy;small world
Abbreviations:
ANG.L = left angular gyrus;
HES.R = right Heschl’s gyrus;
HIP.L = left hippocampus;
IFGoperc. R = right inferior frontal gyrus:opercular part;
INS.L(R)= left(right)insula;
ORBsupmed. L(R)= left(right)superior frontal gyrus,left(right)medial orbital;
PCG.L(R)= left(right)posterior cingulate gyrus;
PUT.L = left putamen;
REC.L = left rectus;
ROL.R = right rolandic operculum;
SFGmed.L(R)= left(right)medial superior frontal gyrus;
SMG.R = right supramarginal gyrus;
SPG.L = left superior parietal gyrus;
STG.L = left superior temporal gyrus;
TPOmid.L(R)= the middle temporal gyrus on the left(right)temporal pole.
0 Introduction
Frontal lobe epilepsy(FLE)is considered the second most common type of epilepsy,taking up 20%—30% of focal seizures[1]. Previous studies proved that the intrinsic brain functional network can be built by resting-state functional magnetic resonance imaging(rsfMRI),which is typically measured by the correlation among time series of spontaneous activity of anatomically distinct brain regions[2-3]. Such a functional network can be further characterized by graph theoretical analysis and provide new insights in brain disorders[4-5]. In graph theoretical analysis,the brain can be quantitatively characterized by various measures,e.g. nodes,edges,global efficiency(Eglob),local efficiency(Eloc),nodal degree, clustering coefficient and path length[4-5]. Previous studies built functional networks and defined the characteristics of these networks,e.g. small-world phenomena,using rsfMRI and graph theoretical analysis[6]. In a small-world network,most nodes are not directly interconnected but can be conveniently reached from one another via several steps. Besides,the small-world network shows greater local connectivity than a“random”network,as well as a smaller characteristic path length linking individual nodes than a“regular”network[6-7].
Previous studies have reported abnormal functional connectivity in children with FLE[8-9]and altered small-world networks in adult epilepsy patient groups[10]. Here,the functional network in the cortical and subcortical areas of FLE patients is built,and its topological properties are further analyzed quantitatively using graph theoretical analysis. Thus far,these features have not been addressed explicitly in previous studies on FLE functional network.Based on the existing studies,this study hypothesizes that the small-world topology of complex brain function network of the patients with FLE is destroyed or turns abnormal,and patients with FLE have lower information transfer efficiency of brain function than normal people.
1 Materials and Methods
1.1 Subjects
All procedures used here are approved by the Medical Ethics Committee of our hospital,and informed consent is provided by all subjects before experiments. 46 patients with FLE are recruited from a patient population which has received clinical treatments in our hospital. 46 healthy controls(HCs),age- and gender-matched with those of the FLE group,are recruited here. 46 healthy subjects are classified as the control group(22 male,aged 20—39,mean±SD(standard deviation),25.3±5.33;24 females,aged 20—39;mean±SD 26.5±6.3),matching the age and gender of FLE group(21 male,aged 19—35,mean±SD 26±4.6;25 females,aged 20—35;mean±SD 26.9±4.4). 2 -sample t-tests of age show p>0.05,and the result of Pearson Chi-square test of gender indicates p>0.05. There is no statistically significant difference detected between the two groups. The FLE patients recruited here have disease duration ranging from 1 to 27 years(mean:9.2 ± 7.82 years),and the seizure frequency ranges from 0.42 to 912 times per year(mean:59.66 ± 166.67). To be specific,16 patients are treated with sodium valproate,11 with carbamazepine,6 with phenobarbital,5 with topiramate and 3 with oxcarbazepine,and the other 5 receive no medical treatment.
FLE is diagnosed following the International League against Epilepsy classification[11]. All the patients here meet the following criteria:(1)Every patient has one or more typical symptoms of FLE,e.g.,night seizures or posturing;(2)their electroencephalograms show typical generalized epileptiform spikes during electrophysiological monitoring;(3)their scalp electroencephalograms show predominantly interictal epileptic discharges;(4)no abnormalities are shown in regular structural magnetic resonance imaging(MRI).
1.2 MRI data acquisition
The rsfMRI data are acquired using a Magnetom Trio 3T MRI Scanner(Siemens AG,Erlangen, Germany) with a gradient recalled echo(GRE)combining echo - planar imaging sequence with the parameters as follows:Repetition time =2 000 ms,echo time = 30 ms,field of view =24 cm × 24 cm,flip angle = 90°,matrix size =64 × 64,slice thickness = 4 mm,slice gap =0.4 mm,30 slices and 240 repetitions. Three-dimensional T1-weighted images are also taken to normalize the rsfMRI data following a magnetization prepared rapid acquisition GRE sequence with a matrix size of 256 × 256 and a slice thickness of 1.0 mm. If the head motion exceeds 1 mm,or the rotation exceeds 1° in any direction,the rsfMRI data are excluded for analysis[12].
1.3 Graph theoretical analysis
Graph theoretical analysis of rsfMRI data is performed in MATLAB(MathWorks Inc.)using Gretna software(http://www.nitrc.org/projects/gretna)[13]. The cortical and subcortical areas are split into 90 regions using automated anatomic labeling atlas[14], each of which represents a network node[14]. Subsequently,the time series in each node are obtained,and Pearson’s correlation coefficients between each two possible pairs of nodes are acquired. Edges are defined by the strength of functional connectivity between the nodes,and its number represents the number of functional connections per region[6]. To build individual brain networks over a wide range of network densities,a sparse matrix of 36 points is developed by setting the sparsity as 0.05—0.4,with an increase by 0.01[14-15]. The sparsity is defined by the ratio between the actual number of edges and the maximum possible number of edges in a network.
The small-world structure is hypothesized to reveal an optimal situation associated with rapid synchronization and information transfer,minimal wiring costs,as well as a balance between local processing and global integration[5,16]. A real network is considered a small world if it meets the following criteria:γ =Crealp/Crandp≫1 and λ=Lrealp/Lrandp≈1,or σ=γ/λ >1. Crandand Lrandare the clustering coefficient and the average minimum path length,respectively,calculated for a random network with the same number of edges(the same sparsity)[14]. 100 random networks are obtained here following the random rewiring procedure for comparison.
Various global and nodal parameters are characterized to conclude the topological properties of the functional network in each group. Global efficiency(Eglob),local efficiency(Eloc),clustering coefficients(Cp)and path length(Lp)are parameters characterizing the global properties of the brain network[17].Eglobserves as a measure of whole-brain information transmission. Elocis a measure of information transmission among locally connected regions. The Cpvalue quantifies the number of connections that exist between the nearest neighbors of a node as a proportion of the maximum number of possible connections. Besides,the Cpvalue of a network can quantify the local interconnectivity of a network,namely the average of the clustering coefficients over all nodes. The Lpvalue,inversely related to network efficiency,is the minimum number of edges that must be traversed from one node to another.However,it is numerically more difficult to estimate the topological distances between elements of disconnected graphs. The Lpvalue quantifies the ability of parallel information propagation or Eglobof a network,which is averaged from all pairs of nodes.
Nodal efficiency,nodal degree and hubs are parameters characterizing the nodal properties of the brain network. Nodal efficiency measures the information propagation ability of a node to the other nodes in the network. The degree of a node(i.e.,nodal degree)is a simple measurement of the connectivity of a node with the other nodes in a network,measured as the number of connections that link to the rest of the network.
A hub is a population of nodes with high degree or high centrality. The centrality of a node measures how many of the shortest paths between all other node pairs in the network pass through it. Hubs are thus crucial for efficient communication. In this study,the node i is considered as a brain hub if the nodal efficiency(Enodal(i))is at least one SD greater than the average nodal efficiency of the network(i.e.,Enodal(i)>mean + SD),and the degree of nodes with the same criterion as to identify the network hubs[18]is examined.It is noteworthy that these nodal measurements reflect the significance of a node in a network from different aspects as defined above,and these are correlated with each other(i.e. a node with high degree was inclined to have high nodal efficiency since it has more directly reachable paths to other nodes,along which the information could propagate).
1.4 Statistical analysis
Patient demographics and clinical information are compared by two-sample t-tests,and gender difference is determined by Pearson’s chi-squared test between the two groups. The difference between the two groups in terms of topological properties of the functional network is assessed by two-sample ttests,followed by multiple comparison correction via false wise error(FWE)[19]. Results are considered significant with P <0.05.
2 Results
2.1 Group differences in edges
As shown in Fig.1,the edges represent symmetric correlations between nodes. Here P <0.05 and FWE is corrected. Compared with HC group,FLE group shows stronger edge connections between the middle temporal gyrus on the temporal pole(TPOmid)and opercular part of the inferior frontal gyrus(IFGoperc),insula(INS),and supramarginal gyrus(SMG),respectively(see red lines). And edges between posterior cingulate gyrus(PCG)and hippocampus(HIP),and between PCG and TPOmid demonstrate weaker connection,respectively(See blue lines).
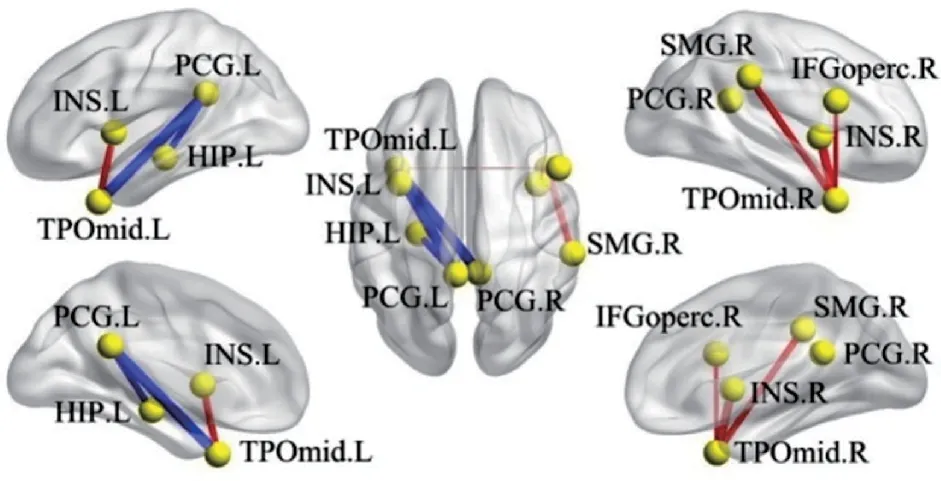
Fig.1 Illustration of between-group (FLE vs. HC) differences in edges in brainnet viewer (90 regions)
In Table 1,the nodes with significant statistical difference in edges between the two groups are compared. As compared with those in HCs,edges with stronger or weaker connections are found in the patients with FLE,indicating a disturbed wholebrain functional activity in FLE patients.
2.2 Small-world features(γ,λ and σ)
The prominent small- world features are observed in both groups,where γ ≫1,λ ≈1,andσ >1. As seen from Fig.2,the FLE group shows a lower γ value for a sparsity between 0.14 and 0.18,and a lower σ value for a sparsity between 0.14 and 0.17. The symbols of“*”and“ ★”indicate significant between-group differences(P <0.05,twosample t-test)in γ and σ,respectively.

Table 1 Between - group (FLE vs. HC) differences in edges (90 regions)

Fig.2 Change of γ, λ and σ with the sparsity of the wholebrain functional network
No significant difference is reported in Eglobof the whole -brain network between the two groups(Fig.3(a));Elocappears to be lower in FLE group,compared with HC group(Fig.3(b)). A lower Cpwas also found in the whole-brain network of FLE group(Fig.3(c));Lpof the whole-brain network is not significantly different between the two groups(Fig.3(d)).The symbol“★”represents significant between-group differences(P<0.05,false-positive adjustment corrected,two-sample t-test)in the parameters.
2.3 Nodal characteristics

Fig.3 Comparison of global parameters change with sparsity of the whole -brain functional network between FLE group and HC group

Fig.4 Comparisons of nodal characteristics between FLE group and HC group using brainnet viewer (90 regions)
As shown in Fig.4,significant differences are observed in the nodal efficiency and nodal degree of brain functional networks between FLE group and HC group(P<0.05,false-positive adjustment corrected). For nodal efficiency,functional connectivity is found reduced in SPG.L,ORBsupmed.L &R,REC.L,TPOmid.L & R,IFGoperc.R in FLE group. Also,for nodal degree,functional connectivity is found decreased in ORBsupmed.L & R,REC.L,TPOmid.L & R,SPG.L in FLE group. Here blue nodes represent the decreased values in FLE group.
In FLE group,seven brain regions are identified as the network hubs,namely SFGmed.L,INS.L,STG.L,PCG.R,SMG.R,INS.R,and IFGoperc.R(Fig.5(a)). In HC group,ten brain regions are identified as the network hubs,including SFGmed. L,ORBsupmed. L,INS. L,ANG. L,SMG. R,SFGmed. R,ROL. R,INS. R,ORBsupmed.R,and IFGoperc.R(Fig.5(b)).

Fig.5 Hubs of FLE group and HC group by using brainnet viewer (90 regions)
3 Discussions
In the present study,the brain resting -state functional connectivity in patients with FLE is compared with that in HCs by graph theoretical analysis.
The results here suggest that a localized functional network disruption,instead of breakdown of the whole-brain network,can be assumed in the patients with FLE[20]. Such the hypothesis may help to understand the clinical symptoms of FLE and gain insights into its diagnosis and treatment[21-22]. Similar abnormalities are also reported previously in children with FLE based on the observation that the brain network of patients with FLE is disrupted and organized loosely[8-9]. Such a disturbance in the brain functional network organization may lay a foundation for the cognitive impairment in FLE patients.
3.1 Group differences in edges
TPOmid accounts for multimodal analysis(e.g.semantic and episode memory)[23].IFGoperc is responsible for semantic memory[24],while PCG has been associated with working memory[25]. Besides,one of the functions of HIP has a relation to episodic memory[26]. The results here reveal that the functional connectivity increases between TPOmid and IFGoperc,while functional connectivity decreases between TPOmid and PCG as well as PCG and HIP(Fig.1). These variations in functional connectivity reflect alterations in semantic,working and episodic memory.As a matter of fact,previous studies show that patients with FLE could have impaired memory[27],which is consistent with the results here.
TPOmid also accounts for social and emotion processing[23]. INS cortex has been associated with social emotions[28],and PCG is also responsible for emotions[25]. According to the results here,the functional connectivity between TPOmid and INS increases,while functional connectivity decreases between TPOmid and PCG(Fig.1). These results can be associated with previous studies reporting that patients with frontal lobe epilepsy often experience emotional aura[29]. Also,it can be seen form Fig.1 that the functional connectivity increases between TPOmid and supramarginal gyrus(SMG)in patients with FLE. Since TPOmid is a part of the temporal lobe related to motor functions[30],and SMG is responsible for space and limbs location[31],the increased functional connectivity might be associated with the motion impairment in epilepsy patients[32].
3.2 Small-world features
The network lying between regular and random networks is termed small-world network,in which most of the nodes are connected to their nearest neighbors,and a few of nodes are linked over a long range. The network parameters over a range of threshold values are employed to ensure high correlation coefficients of the remaining connections. In fMRI,the concept of sparsity is used to analyze the network,and the sparsity is defined as a density range of 0.04—0.4[33].
The results here meet the criteria:γ =Crealp/Crandp≫1 and λ=Lrealp/Lrandp≈1,σ=γ/λ >1.
According to the definition of small-world,the results in both FLE and HC groups characterize the small-world features.In 2010,Sanz-Arigita et al.reported that the small-world topological properties of the brain functional networks of AD patients were partially lost,together with a reduction in brain processing efficiency[34]. Besides,the network of AD patients in their study was closer to the random network,whereas the clustering coefficient was not significantly different with that of normal people. Kim et al.[35]verified that patients with depression also showed the loss of small-world features as well as the variations in Cpand Lp.
Topological properties,e.g.the clustering coefficient(γ)and local efficiency(Eloc),imply a network segregation of the brain. According to the results here,the value of γ in FLE group is lower than that in HC group,suggesting that the smallworld features are inclined to be more random. Clustering coefficient (γ) has been reported to decrease[33]in a brain network of temporal lobe epilepsy(TLE). In 2013,Van diessen found that topological properties of brain network turned more random in epilepsy[36]. Lower Elocwas found in FLE group than HC group here,which is also consistent with previous reports[37]. Elocis defined as the mean of the global efficiencies of subgraphs consisting of the adjacent neighbors of a particular node. The lower the Eloc,the less efficient the information transmission will be in FLE group.
Properties,e.g. the characteristic path length(λ)and global efficiency(Eglob),indicate the network integration of the brain. Eglobis defined as the average inverse shortest path length. Based on the analysis here,no significant difference is found in λ and Eglob.
Small-worldness(σ)is calculated to assess the balance of segregation and integration. Network topological properties are dependent on the density of network. When brain graphs are built,each graph of individual subject undergoes thresholding to create an equal number of nodes and edges across subjects.In this study,since there is no difference in the value of λ,the value of σ is reduced in FLE group,which is primarily affected by γ.
The values of γ and σ are reduced in FLE group,suggesting that the brain networks have a tendency towards random networks[38]. This reveals that the degree of rapid synchronization and the optimization for information transmission can be impacted in FLE group. In previous study[39],decreased γ and σ are found associated with epilepsy based on small-world brain connectivity analysis.
Accordingly,from the analysis of small-world features,the functional connectivity network of FLE group tends to be looser. Moreover,the decrease in γ and σ suggests that it may be associated with epilepsy. γ and σ can therefore serve as potential markers to diagnose FLE by rsfMRI.
3.3 Nodal characteristics
The nodal efficiency is found declined in SPG.L,ORBsupmed.L & R,REC.L,TPOmid.L & R and IFGoperc.R in FLE group(Fig.4(a)).The SPG is critical for many sensory and cognitive processes(e.g. somatosensory and visuomotor integration,visuospatial attention,mental rotation and the control of socially relevant behaviors)[40]. ORBsupmed is found associated with the cognition[41]. REC is related to memory and AD[42]. TPOmid has a relation to semantic cognition[23]. IFGoperc is found accounting for semantic memory[24]. Since nodal efficiency measures the information propagation ability of a node to the other nodes in the network,the brain functional networks in these nodes of FLE patients show less efficient information transmission.
The nodal degrees are found dropped in SPG.L,ORBsupmed.L & R,REC.L and TPOmid.L &R in FLE group(Fig.4(b)),suggesting declined connectivity of those nodes with the other nodes in the functional networks. The decreased nodal degree is highly consistent with the decreased node efficiency.
Hubs are brain regions that integrate and distribute information efficiently and effectively. According to the results here,there are fewer hubs in FLE patients than those in HC(Fig.4). In both groups,SMG,SFGmed,INS and IFGoperc are considered hubs. In HC group instead of FLE group,ORBsupmed,ANG and ROL are considered hubs. ORBsupmed is found related to cognition. Previous study suggests the strong ANG involvement in attention mechanisms,spatial cognition,verbal working memory and episodic memory[43]. ROL is considered associated with phonological memory[44]. These results may reveal the functional disturbances of brain network in FLE patients.
4 Conclusions
A brain functional network is built using rsfMRI in FLE patients. Moreover,the resting -state functional connectivity of brain functional network is characterized for the first time by graph theoretical analysis in a FLE population. Either from the analysis of small-world features or of the nodes,the brain function of patients with FLE is indeed affected.The cognition and memory function will be inevitably disturbed by the declined nodes and corresponding efficiency.
The proposed method is efficient and noninvasive,providing a relatively high resolution. Our findings help to gain new insights into the functional and cognitive disorders in patients with FLE. For instance,Cpwith high sensitivity and specificity exhibites relatively high accuracy in reflecting brain local efficiency. Such parameters can also serve as potential biomarkers for the diagnosis,the monitoring and the treatment of FLE patients[45].
Previously,it has been shown that different parcellation schemes might yield different results with respect to whole-brain graph metrics among different groups. The presented binary network could potentially be further developed into a weighted one in the future.
AcknowledgementsThis work is supported by the Natural Science Foundation of China (Nos. 81422022, 81271553,81201155, 81171328, 61131003, 81401402, and 81201161), the Grant for a Young Scholar of Jinling Hospital (No.2015055), and 12.5 Key Grants (Nos.BWS11J063 and 10z026).
AuthorsMr. CAO Xinzhi received his M.S. degree in biomedical engineering from Medical University of the Air Force in 2004.Now he is a Ph.D.candidate in College of Automation Engineering,Nanjing University of Aeronautics and Astronautics(NUAA). His research interests focus on fMRI and epilepsy.
Prof. QIAN Zhiyu received his M.S. degree in the department of physics from Nanjing Normal University in 1991 and Ph.D. degree in the department from NUAA in 2003. He is now a full professor in College of Automation Engineering,NUAA. His research interests focus on clinical research in stereotactic navigation and neurosurgical treatment using near infrared spectrum(NIR).
Mr. XU Qiang received his M.S. degree in School of Life Science and Technology,University of Electronic Science and Technology of China in 2012. Now he is a Ph.D. candidate in College of Automation Engineering,NUAA. His research interests focus on multi-modal MRI and its application to epilepsy.
Dr. ZHANG Zhiqiang received his M.S. degree in Imaging Medicine & Nuclear Medicine and Ph.D. degree in Neurosurgery from Nanjing University of China in 2004 and 2010,respectively. His research interests focus on clinical applications of multi-modality MRI,diffusion tensor imaging,perfusion weighted imaging based on techniques of arterial-spin labeled,dynamic susceptibility contrast and dynamic contrast enhancement,morphometric imaging and MRI research on epilepsy.
Ms. SHEN Junshu received her M.S. degree in Biomedical Engineering from Medical University of the Air Force in 2006. Her research interests focus on radiotherapy physics and medical equipment.
Prof. LU Guangming received his M.S. degree in Diagnostic Radiology in Beijing Union Medical College of China in 1988. Now he is the chair of the Department of Medical Imaging,Jinling Hospital,medical school of Nanjing University,the director and M.D. supervisor of comprehensive clinical teaching and research section,medical school of Nanjing University.
Author contributionsProf. QIAN Zhiyu and Prof. LU Guangming developed and designed the project. Dr.ZHANG Zhiqiang acquired the rsfMRI data and stimulated the discussions and suggestions. Mr. XU Qiang and Ms.SHEN Junshu processed the data. Mr. CAO Xinzhi finished the project and wrote the manuscript.
Conflicts statementsThe authors declare no competing interests.
杂志排行

Transactions of Nanjing University of Aeronautics and Astronautics的其它文章
- Recent Advances in Hole Making of FRP/Metal Stacks:A Review
- Parameter Optimization for Improvement in Biomachining Performance
- Effect of Friction on Dynamic Response of A Power Split Transmission System
- Mathematical Model and Machining Method for Spiral Flute Rake Faces of Hourglass Worm Gear Hob
- Active Design Method of Tooth Profiles for Cycloid Drive Based on Meshing Efficiency
- Design and Study of Virtual Interventional Surgical System with Force Feedback