Interannual and Decadal Changes in Tropospheric Ozone in China and the Associated Chemistry–Climate Interactions: A Review
2019-07-23YuFUHongLIAOandYangYANG
Yu FU,Hong LIAO,and Yang YANG
1Climate Change Research Center,Chinese Academy of Sciences,Beijing 100029,China
2Jiangsu Key Laboratory of Atmospheric Environment Monitoring and Pollution Control,Jiangsu Collaborative Innovation Center of Atmospheric Environment and Equipment Technology,School of Environmental Science and Engineering,Nanjing University of Information Science and Technology,Nanjing 210044,China
ABSTRACT China has been experiencing widespread air pollution due to rapid industrialization and urbanization in recent decades.The two major concerns of ambient air quality in China are particulate matter(PM)and tropospheric ozone(O3).With the implementation of air pollution prevention and control actions in the last five years, the PM pollution in China has been substantially reduced. In contrast, under the conditions of the urban air pollution complex, the elevated O3 levels in city clusters of eastern China,especially in warm seasons,have drawn increasing attention.Emissions of air pollutants and their precursors not only contribute to regional air quality, but also alter climate. Climate change in turn can change chemical processes, long-range transport, and local meteorology that influence air pollution. Compared to PM, less is known about O3 pollution and its climate effects over China. Here, we present a review of the main findings from the literature over the period 2011–18 with regard to the characteristics of O3 concentrations in China and the mechanisms that drive its interannual to decadal variations, aiming to identify robust conclusions that may guide decision-making for emissions control and to highlight critical knowledge gaps.We also review regional and global modeling studies that have investigated the impacts of tropospheric O3 on climate,as well as the projections of future tropospheric O3 owing to climate and/or emission changes.
Key words: tropospheric ozone,chemistry–climate interactions,interannual and decadal variations,China
1. Introduction
Ozone (O3) pollution in North America and Europe has been alleviated as a result of the rigorous emission controls since the 1990s,whereas the O3levels in East Asia have been increasing (Cooper et al., 2014; Chang et al., 2017; Gaudel et al.,2018),especially in the rapidly developing city clusters[e.g., the Yangtze River Delta (YRD), the Pearl River Delta(PRD),and the North China Plain(NCP)].Observed concentrations from 74 Chinese cities showed that the mean value of daily maximum 8-h average O3concentrations (MDA8)for warm seasons (April–September) increased by approximately 3%yr−1over 2013–17(Lu et al.,2018)and the mean value of the 90th percentile of MDA8 O3increased from 139µg m−3(∼65 ppbva) in 2013 to 167 µg m−3(∼78 ppbv) in 2017 (Fig. 1). High O3concentrations at the ground level have been shown to pose major threats to human health and the ecosystem, as well as crop production, thereby having ramifications for future food security(Lim et al.,2012;Feng et al., 2015; Wang et al., 2017a). Furthermore, tropospheric O3plays a key role in determining the oxidation capacity of the atmosphere as a photochemical precursor of the hydroxyl radical(OH),and thus impacts the formation of other secondary pollutants, such as sulfate and secondary organic aerosol (Jacob, 2000). In addition, tropospheric O3has received continuous attention from both the scientific and regulatory communities because of its effect on climate. Tropospheric O3is estimated to have the third-highest positive radiative forcing after carbon dioxide (CO2) and methane(CH4)(Myhre et al.,2013).
Tropospheric O3is a secondary air pollutant produced by complex photochemical reactions of nitrogen oxides[NOx=nitric oxide(NO)+nitrogen dioxide(NO2)],carbon monoxide(CO),CH4,and non-methane volatile organic compounds(VOCs).The downward transport of O3from the stratosphere is also an important source of tropospheric O3.The concentration of O3in the troposphere is influenced by changes in the source emissions of its precursors(e.g.,VOCs and NOx).Most precursors are from anthropogenic sources, and some precursors can come from natural sources, such as biogenic VOCs (BVOCs) and soil and lightning NOx. The relationships between O3and its precursors are complex. In general,O3formation is nonlinearly dependent on its precursors,and can typically be summarized into two categories of chemical regimes—“NOx-limited”and“VOC-limited”—which are determined by the VOCs/NOxratio, VOC reactivity, photochemical aging,and meteorological conditions(Seinfeld and Pandis, 2006). In the NOx-limited regime, increase in NOxleads to increased O3concentration, with a weak sensitivity to VOC concentration. In the VOC-limited regime (the usual case in polluted regions in China),in contrast,increase in VOCs leads to increased O3with a weak or even negative sensitivity to NOxconcentration. The transitional conditions of dual sensitivities also occur. Therefore, identifying the O3formation regime is essential for the regulation of O3air pollution regionally(Xing et al.,2011;Ma et al.,2012).In addition to emissions,changes in O3concentrations are also influenced by changes in meteorological conditions. Previous studies have extensively suggested that high O3events are usually associated with conducive meteorological factors(e.g., high temperature, low wind speed and relative humidity) and typically synoptic circulation patterns (e.g., anticyclones), which can enhance chemical production and/or accumulation of O3in the boundary layer (Xu et al., 2011b;Shen et al., 2015; Zhao et al., 2016). Moreover, meteorological conditions can alter the stratosphere–troposphere exchange of O3, which influences the lower tropospheric O3(Stohl et al., 2003; Li et al., 2015; Lin et al., 2015). O3is mainly removed from the troposphere by chemical reactions.Dry deposition onto the surface, in particular to vegetation,is also a dominant sink of tropospheric O3. These removal processes are also affected by meteorological conditions.
In recent decades, the observed aerosol concentrations have been extremely high in China (Zhang et al., 2012b).These aerosols have large impacts on O3concentrations by heterogeneous reactions and by altering photolysis rates (Li et al.,2011;Lou et al.,2014;Feng et al.,2016).With the implementation of air pollution prevention and control actions in the last five years, assessing the potential changes in O3concentration under the conditions of decreases in aerosols has become an emerging scientific topic in China.

Fig.1.Interannual variations in annual mean concentrations of PM10, PM2.5, SO2, NO2, CO,and O3 based on the monitoring results from 74 Chinese cities over 2013–17.The O3 values represent the mean value of the 90th percentile of MDA8 O3.The units for CO are mg m−3,while those for other species areµg m−3. For clarity,the CO values are scaled by a factor of 10. All the data were obtained from the China Environment Report,2013–17,available at http://www.mep.gov.cn,in Chinese.
In this paper,we review the current understanding of the spatial and temporal variations of O3concentrations in China,the factors or processes that influence O3formation and distribution, and the interactions between tropospheric O3and climate in China,by summarizing the findings from the literature over the period 2011–18. Section 2 reviews the spatial and temporal variations of tropospheric O3based on observations;section 3 summarizes the impacts of changes in anthropogenic emissions,climate,land cover and land use,as well as aerosols, on O3concentrations; section 4 reviews the effects of O3on the climate over China;and section 5 provides a summary and recommendations for future studies.
2. Characteristics of observed O3 in China
Field measurements of O3are important for understanding the characteristics of O3concentrations. They also provide datasets for evaluating model simulations and improving the representation of chemical processes in models.Although numerous long-term monitoring sites have been established worldwide[mostly focusing on North America,Europe,and East Asia(Japan and Korea)](Sofen et al.,2016;Schnell and Prather,2017; Schultz et al.,2017; Gaudel et al.,2018; Yan et al., 2018), O3monitoring was very limited in mainland China before the mid-2000s,partly because most studies and control efforts in China were focused on particulate matter(PM)air quality in the early years. In 2012,the Chinese government revised the national ambient air quality standards,setting O3pollution standards for urban and industrial areas as an hourly concentration of 200 µg m−3or MDA8 of 160µg m−3[GB3095-2012,National Ambient Air Quality Standards (NAAQS), in Chinese, http://kjs.mep.gov.cn/hjbhbz/bzwb/dqhjbh/dqhjzlbz/201203/t2012030224165.htm, accessed on 31 August 2018]. Meanwhile, the surface O3became one of the species regularly monitored by the National Air Quality Monitoring Network,which became operational in 2013. The network covered 74 major cities in 2013, and,by the end of 2017, had nearly 1436 monitoring stations in 338 Chinese cities (Fig. 2). This monitoring network of the Ministry of Ecology and Environment of China reports hourly air quality data including concentrations of O3, CO,NO2, sulfur dioxide (SO2), and PM2.5(PM with a diameter less than 2.5µm)(http://106.37.208.233:20035/).
2.1. Seasonal variation of O3 concentrations
Numerous studies have reported severe O3episodes observed in the most developed regions of China,where O3concentrations are influenced by large anthropogenic emissions of O3precursors. During severe O3pollution episodes, the maximum 1-h O3mixing ratio reached 170–270 ppbv in the Beijing–Tianjing–Hebei(BTH)region(Xu et al.,2011a;Wei et al.,2015),130–180 ppbv in the YRD(Ding et al.,2013;An et al.,2015;Shi et al.,2015),and 200–220 ppbv in the PRD(Lu et al., 2012; Ou et al., 2016; Wang et al., 2016b). Remarkably,Li et al.(2017a)reported that,in April–September of 2015, the maximum hourly O3concentrations exceeded 400 µg m−3(∼200 ppbv) in more than 60 cities in eastern China,indicating widespread O3pollution in China.

Fig.2.The National Air Quality Monitoring Network of China in 2017,featuring 1436 monitoring sites in 338 cities, developed by the China National Environmental Monitoring Center.Data source: http://www.cnemc.cn/and http://beijingair.sinaapp.com/.
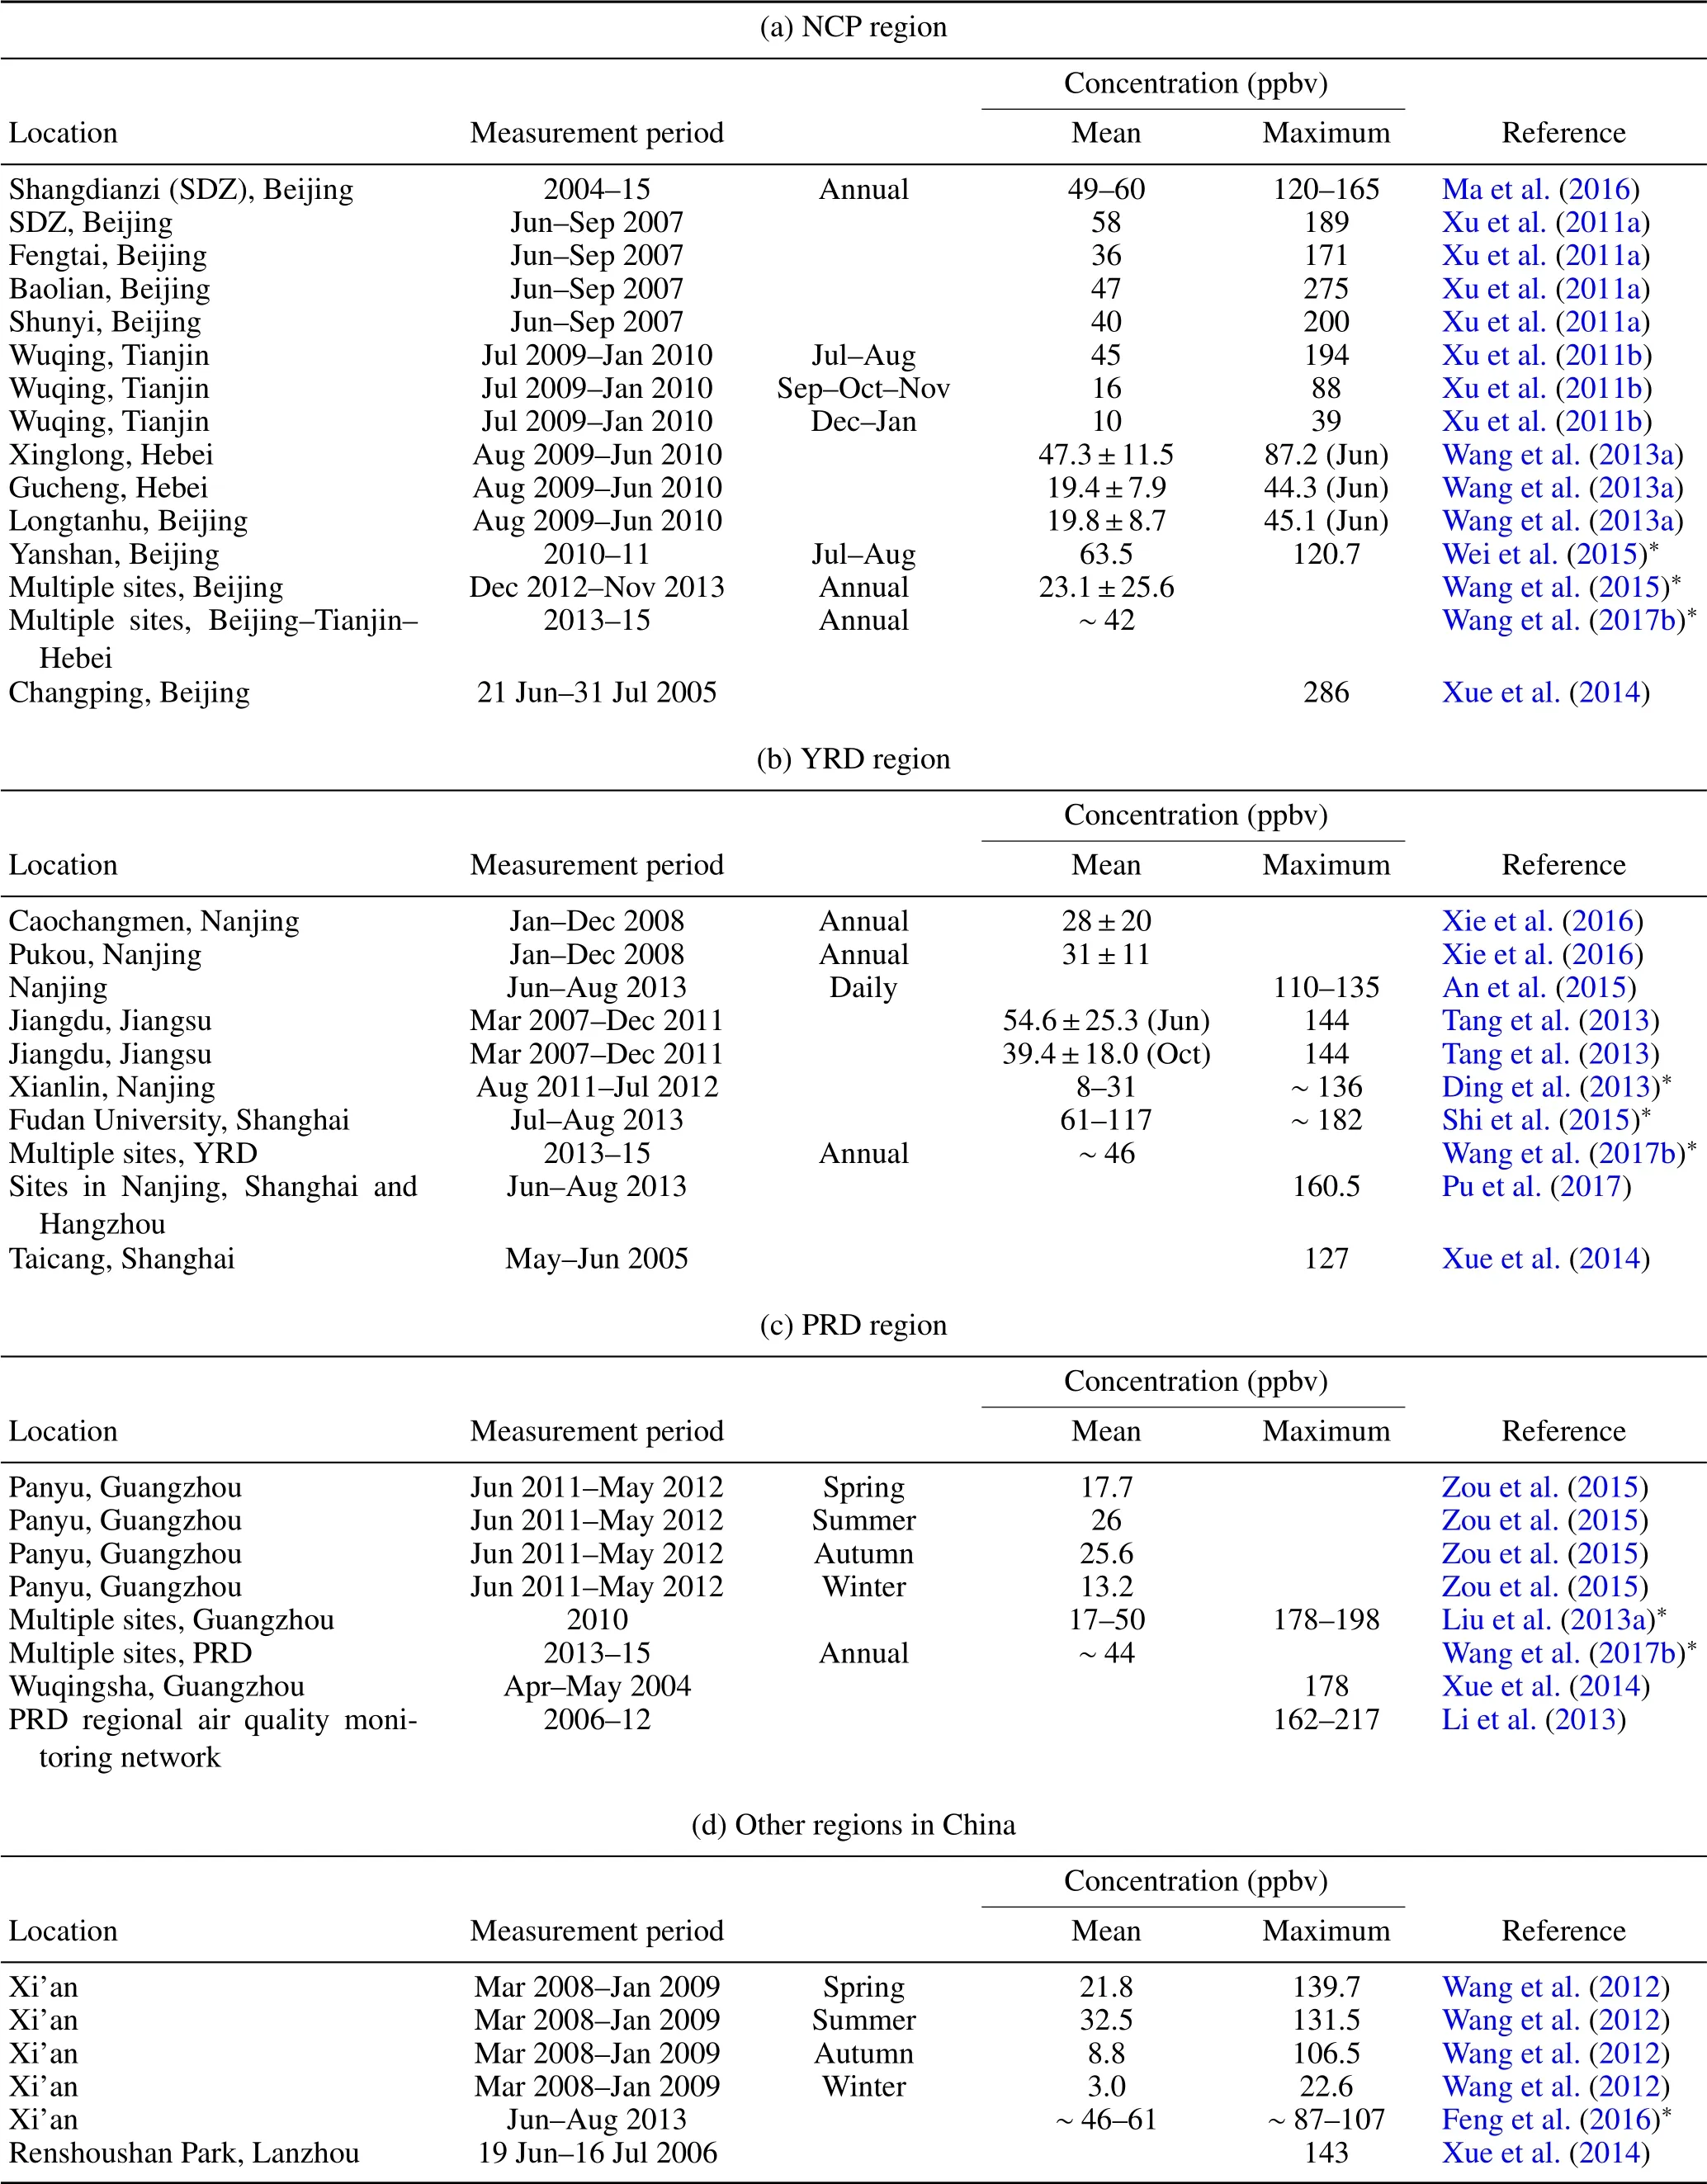
Table 1.Summary of field measurements of O3 in China based on the literature during 2011–18.
Tables 1 summarize the observational studies of O3in China published over the period of 2011–18. Most of these studies were focused on the spatial and temporal variations of surface-layer O3and precursors of O3.In general,the seasonal mean surface-layer O3concentrations were within the range of 20–60 ppbv, with the highest concentrations occurring in warm seasons in eastern China(Xu et al.,2011a;Tang et al., 2012; Wang et al., 2012, 2013a, 2017b; Ding et al.,2013; Chen et al., 2015). For example, Tang et al. (2012)reported highest O3concentrations in June and the lowest values in December in Beijing, which were attributed to local meteorological conditions. Ding et al. (2013)found that O3levels over the YRD exhibited a maximum in July,a second maximum in September, and a minimum in November,on the basis of the observations from August 2011 to July 2012. Tang et al.(2013)also found a bimodal seasonal pattern of O3at an agricultural site in the northern YRD,which were caused by winds associated with monsoon and open crop residue burning. In comparison,O3concentrations were found to be minimum in summer and maximum in autumn over the PRD region (Hu et al., 2016; Liu et al., 2017). In summer,prevailing southerlies with clean air from the oceans and the large rainfall associated with the East Asian monsoon leads to the decreases in O3levels.In autumn,the continental flow from the north with polluted air,in conjunction with the stable and warm weather,contributes to the high O3concentrations(Newell and Evans,2000; Wang et al.,2009; Zheng et al.,2010;Wang et al.,2017c).By analyzing 16 ozonesonde observations during a field campaign in April–May of 2005,Huang et al.(2015)found that the observed O3enhancement in the lower troposphere in Beijing in the late spring and early summer was attributed to an earlier onset of the East Asian summer monsoon(EASM).
2.2. Trends of O3 in recent decades
Recent studies in the framework of the Tropospheric Ozone Assessment Report, supported by IGAC (International Global Atmospheric Chemistry),showed that observed monthly mean MDA8 O3levels in South Korea and Japan were increasing with a regional trend of 0.35 ppbv yr−1over the 2000–14 period(Chang et al.,2017;Gaudel et al.,2018).In China,knowledge of decadal variation of O3on a nationwide scale is limited due to the lack of continuous measurements. Only a small number of studies have conducted longterm measurements of O3(Zhou et al.,2013;Li et al.,2014;Ma et al.,2016;Sun et al.,2016;Xu et al.,2018).In the NCP,based on the O3profiles derived from the MOZAIC (Measurement of Ozone and Water Vapor on Airbus In-service Aircraft)and IAGOS(In-service Aircraft for the Global Observing System)programs, Ding et al.(2008)showed an increasing trend of O3of 1.0 ppbv yr−1in the lower troposphere during 1995–2005. Zhang et al. (2014) found that the averaged O3in summer in Beijing increased by 2.6 ppbv yr−1(5%yr−1) during 2005–11, although NOxand total VOC mixing ratios decreased by 1.4 ppbv yr−1and 1.6 ppbv yr−1,respectively. They explained that such increases in O3mainly resulted from the decreased NO titration and elevated regional O3background concentration in the NCP,suggesting that the reduction of VOCs should be coordinated with NOxemission controls in urban areas.Ma et al.(2016)and Sun et al.(2016)reported that the annual mean surface O3concentration increased significantly at two background sites in the NCP over 2003–15, with an average rate of 1.13±0.01 ppbv yr−1at Shangdianzi and 2.1 ppbv yr−1at Mount Tai. Recent analyses by Zhang et al. (2016) and Gaudel et al. (2018) showed by using IAGOS data that O3in the NCP increased largely in the boundary layer, with the summertime concentrations increased by 15% from 1995 to 2014. In the PRD region,Li et al.(2014)observed an increase in O3of 2.0 ppbv yr−1and a decrease in NO2of 1.2 ppbv yr−1from 2006 to 2011 in suburban/urban areas, implying that photochemical O3production in the PRD was mainly VOC-controlled. Zhang et al.(2013)reported increases in O3concentrations in Hong Kong during 1999–2011 and suggested that the changes in meteorology contributed 36%to the observed increases. In western China, observed O3concentrations in spring and autumn at Mount Waliguan of the Tibetan Plateau also showed an increasing trend,of 0.2–0.3 ppbv yr−1,over 1994–2013,which was caused by the increased springtime transport from the stratosphere to the troposphere and was influenced by polluted air from Southeast Asia in autumn (Xu et al., 2016,2018).
Satellite remote sensing is a useful approach to investigate tropospheric O3over large regions, although retrieving tropospheric O3from satellite observations is still challenging, as tropospheric O3contributes only approximately 10% to the total atmospheric column O3(Seinfeld and Pandis,2006).Currently,there are several commonly used tropospheric column ozone products retrieved from the new generation of nadir-looking instruments onboard polar-orbiting satellites, such as IASI (Infrared Atmospheric Sounding Interferometer)-FORLI(Fast Optimal Retrievals on Layers),IASI-SOFRID (Software for a Fast Retrieval of IASI Data),IASI-LISA (Laboratoire Interuniversitaire des Syst`emes Atmosph´eriques), GOME (Global Ozone Monitoring Experiment), IASI+GOME-2, OMI (Ozone Monitoring Instrument)/MLS(Microwave Limb Sounder), OMI-SOA(Smithsonian Astrophysical Observatory), OMI-RAL (Rutherford Appleton Laboratory), and SCIAMACHY (Scanning Imaging Spectrometer for Atmospheric Chartography)(Gaudel et al.,2018).Note that the SCIAMACHY time series ended in 2012 and cannot be continued because the satellite became inoperable and later crashed. Xu and Lin (2011c) investigated the decadal trend of tropospheric O3over China during 1979–2005 using the NASA satellite product of tropospheric ozone residue(TOR),a surrogate of tropospheric column O3,and found a decreasing trend of TOR over the PRD and the Sichuan Basin and a significant increasing trend of TOR over the NCP for all seasons except winter. Based on Tropospheric Emission Spectrometer (TES) measurements of tropospheric O3and NO2, Verstraeten et al. (2015) reported that tropospheric O3concentrations over China increased by approximately 7% between 2005 and 2010, as a result of the 21% increase in Chinese emissions and the enhanced downward transport of stratospheric O3. Hayashida et al. (2015) analyzed O3in the lower troposphere over central and eastern China on the basis of OMI O3profiles over 2005–13 and pointed out that O3enhancement was the largest in June among all the months. However, using the lower-tropospheric columns derived from the IASI satellite instrument, Dufour et al. (2018) found an overall trend of−0.77% yr−1over the NCP for 2008–16, and large-scale dynamical processes such as QBO (quasi-biennial oscillation)and ENSO(El Ni˜no–Southern Oscillation)explain more than half of the observed trend, with a possible reduction in stratosphere-to-troposphere transport being the main contributor. It is noted that the negative trend derived in the lower troposphere from IASI is inconsistent with the positive trend derived from the surface measurements over the NCP(Ma et al., 2016; Sun et al., 2016). A possible explanation for this inconsistency is that the lower troposphere and surface O3respond differently to the recent reductions in NOx.In addition,the uncertainties in satellite retrievals of tropospheric O3trends should be addressed in future studies.
3. Mechanisms for the variations of tropospheric O3 in China
As mentioned in the introduction, tropospheric O3is a secondary air pollutant formed from a combination of nitrogen oxides(NOx=NO2+NO),VOCs, CO and CH4in the presence of sunlight. Several studies and reviews are available in the literature that describe the O3photochemistry reactions (e.g. Monks, 2005; Monks et al., 2015). For better understanding of the variations in tropospheric O3and its precursors,readers are referred to those papers for a comprehensive description of the chemical mechanisms of O3.
3.1. Impacts of changes in anthropogenic emissions
The most important O3precursors in the atmosphere include NOx, CO and VOCs, which emit from both anthropogenic and biogenic sources. For example, the majority of NOxemitted into the atmosphere is from anthropogenic fossil fuel combustion(i.e.,industry,power,residential,and transportation),with the remaining emissions from biomass burning, soil, and lightning. Non-methane VOCs have large anthropogenic sources,but vegetation also represents a significant source depending on the region.
Many researchers have put tremendous efforts into developing emissions inventories covering China(Streets et al.,2003,2006;Ohara et al.,2007;Zhang et al.,2009;Kurokawa et al., 2013; Li et al., 2017b). Table 2 summarizes several Asian emissions inventories for China that are widely used for atmospheric chemistry–climate research. Previous studies have reported the characteristics and the trends of anthropogenic emissions in China(Zhang et al.,2012a;Zhao et al.,2013;Wang et al.,2014;Wu et al.,2016;Zheng et al.,2018).For instance, Kurokawa et al. (2013) showed that emissions of NOx,CO and non-methane VOCs over China increased by 89%,42%and 71%,respectively,from 2000 to 2008. Wang et al. (2014) also found that the emissions of NOxand nonmethane VOCs in China increased by 25%and 15%,respectively, during 2005–10, due to inadequate control strategies.Wu et al. (2016) reported that China’s anthropogenic VOC emissions increased by 7.38% (from 22.45 Tg in 2008 to 29.85 Tg in 2012). Facing the big challenge of improving air quality, emission mitigation measures were implemented gradually in China during the 11th Five-Year Plan(2006–10)and the 12th Five-Year Plan(2011–15). Xia et al.(2016)estimated the emissions of SO2, NOxand CO for 2000–14 in China to evaluate the effectiveness of national air pollution control policies and found that the estimated NOxemissions increased from 11.7 Tg in 2000 to 29.8 Tg in 2011,and then decreased to 27.7 Tg in 2014. Recently, Zheng et al.(2018)showed that,during 2013–17,anthropogenic NOxemissions decreased by 21%(from 27.7 Tg in 2013 to 22.0 Tg in 2017),while non-methane VOCs emissions did not show a significant change (from 28.1 Tg in 2013 to 28.6 Tg in 2017), indicating the absence of effective control measures for non-methane VOCs in current policies.

Table 2.Summary of regional anthropogenic emissions inventories covering China.
Based on existing emissions inventories, the air quality degradation associated with elevated O3levels in China has been demonstrated to be primarily driven by increasing anthropogenic emissions of O3precursors. Some modeling studies have highlighted the importance of historical changes in anthropogenic emissions. Lou et al.(2015)found that the interannual variations in anthropogenic emissions in China over 2004–12 led to changes in summertime O3by 2–2.5 ppbv in the Sichuan Basin and South China. Fu and Tai(2015) showed that multidecadal changes in anthropogenic emissions between 1985 and 2005 enhanced summertime O3by up to 25 ppbv in eastern China. Some modeling studies have also examined the possible impact of future changes in anthropogenic emissions on O3concentrations. Liu et al.(2013b) indicated that the changes in anthropogenic emissions between 2005–07 and 2055–57 following the A1B scenario of the IPCC Special Report on Emission Scenarios would result in an average change of surface-layer O3by 12.8 ppbv in October over southern China. Wang et al. (2013b)also showed that surface O3would increase by 3.4±4.8 ppbv in East China,due to the 2000–50 changes in anthropogenic emissions under the IPCC A1B scenario. By using the future changes in emissions under the IPCC Representative Concentration Pathways (RCP2.6, RCP4.5, RCP6.0 and RCP8.5),Zhu and Liao(2016)simulated that,relative to the year 2000,the maximum increases in the annual mean surface O3concentrations of 6–12 ppbv would occur over southern China in 2020–30 under RCP8.5 and in 2040–50 under RCP6.0.Meanwhile,extremely high numbers of O3exceedance days would be found over most developed regions of China (i.e.,the NCP,YRD and PRD)in 2050 under RCP6.0 and in 2030 under RCP8.5.
To improve O3air quality, some studies have evaluated the effects of possible emission control regulations on O3concentrations at the regional scale. Li et al.(2013)showed that NOxregulation in the PRD region,especially in regions where O3formation was found to be predominantly VOClimited, could increase the mean O3level but decrease the peak O3concentration. Liu et al.(2013a)found that the simulated O3non-attainment rate (days in a year that exceed the air quality standard according to the grade II NAAQS for protection of residential areas) in Guangzhou would increase from 7.1% in 2010 to 12.9% in 2025 under a PM2.5-based emission control scenario, in which the emissions of NOxand VOCs in 2025 would be reduced by 51.9% and 41.3%, respectively, compared to 2010. Ou et al. (2016)explored the feasibility of O3control measures in the PRD by using a set of control scenarios in a numerical model and concluded that VOC-focused controls would be efficient for reductions of peak 1-h O3concentration and for long-term O3regulation (achieving the O3air quality standard). Lu et al. (2018) showed that observed surface O3concentrations increased continuously in China over 2013–17 when NOxemissions were reduced, suggesting that O3chemical production in eastern China was VOC-limited and decreases in NOxemissions or increases in VOCs emissions would enhance O3pollution. Recently, Li et al. (2019) also investigated the trend in summertime O3in China over 2013–17,and attributed the increasing O3trends of 1–3 ppbv yr−1in eastern China to the approximate 40%decrease in PM2.5concentrations. The reductions in PM2.5slow down the aerosol sink of hydroperoxy (HO2) radicals and thus produce more O3. These findings indicate that O3control(e.g.,VOCs control)must be taken into account when designing PM2.5control strategies and VOCs/NOxreduction ratios must be further investigated.
3.2. Impacts of multiscale meteorological conditions and climate change on O3 concentrations
Other than anthropogenic emissions, changes in meteorological variables, including temperature, precipitation, humidity, winds, clouds and stagnation events, are expected to affect O3concentrations via changing physical and chemical processes within the atmosphere(i.e.,photochemical production and loss, ventilation, dilution, and removal processes),altering natural emissions of O3precursors and disturbing the stratosphere–troposphere exchange(Fiore et al.,2015).
3.2.1. Impacts of changes in meteorological conditions on O3concentrations
A number of studies have examined local meteorological conditions during severe O3pollution episodes in China based on observations. They showed that high temperature,intense solar radiation, low relative humidity, low wind velocity and low planetary boundary layer height are conducive to the photochemical production and accumulation of O3and its precursors(Xu et al.,2011b; Zhao et al.,2016).Changes in wind direction and wind speed can also perturb regional O3pollution transport and thereby affect the O3air quality in downwind locations(Ma et al.,2011).Some regional studies have demonstrated that synoptic-scale circulation/weather patterns such as tropical cyclones in the western Pacific,continental anticyclones(high pressure systems),cold fronts,and the intensity of the western Pacific subtropical high(WPSH)are critical meteorological conditions aggravating the occurrence and maintenance of surface O3pollution in different regions (Ding et al., 2013; Zhang et al., 2013; Liao et al.,2017;Zhao and Wang,2017).For instance,O3episodes with hourly concentrations exceeding 120 ppbv during the period of 1999–2011 in Hong Kong were mainly due to regional transport under the influence of tropical cyclones and photochemical reactions upon the prevalence of the anticyclonic circulation (Zhang et al., 2013). The co-occurrence of high O3and PM2.5episodes in the YRD region is also related to anticyclones, since they may cause favorable local meteorological conditions for O3production and pollution accumulation,such as sunny weather and low wind speeds(Ding et al.,2013).The variability of the WPSH intensity has been identified as a meteorological driver affecting surface O3variations in eastern China.Zhao and Wang(2017)found that a stronger WPSH can enhance the southwesterly transport of moisture into South China, which is not conducive to O3formation(i.e., higher RH,more cloudiness and precipitation, less UV radiation, and lower temperatures), leading to a decrease in O3over South China.Meanwhile,a strong WPSH creates dry and sunny conditions over North China and therefore leads to an increase in O3there.
Several modeling studies have examined high O3pollution events in China. Most global and regional chemical transport models (CTMs) (e.g., GEOS-Chem, WRF-Chem,CMAQ, RegCM-CHEM) are able to capture the magnitude and distribution of O3concentrations, as well as the occurrence of O3pollution episodes, although model biases still exist in reproducing the highest or lowest values due to the uncertainties related to meteorological fields, emissions and model parameterizations (Hu et al., 2016; Li et al., 2017a). By using the regional chemistry–climate model RegCM-CHEM4, Pu et al.(2017)simulated the impact of a heat wave on a high O3event in the YRD region that occurred in the summer of 2013 and found that chemical reactions associated with the high temperature played the most important role,which resulted in a 12 ppbv O3enhancement compared to a non-heat wave period. Modeling analysis also indicated that the enhanced emission of biogenic isoprene under dry and warm conditions is another significant contributor to the extreme high O3pollution events (Geng et al., 2011; Wang et al., 2012). Meanwhile, both anthropogenic and biogenic O3precursors can be transported far from the sources,which can result in high O3concentrations in the downwind locations(Wang et al.,2012; Xue et al.,2014). Hu et al.(2018)explored the underlying mechanism of a severe O3episode over the PRD region using the WRF-Chem model and indicated that the regional O3transport contributed considerably to the rapid increase in the surface O3level.
Previous studies have reported that variations in meteorological fields lead to large interannual variations of O3concentration in East Asia. Jeong and Park(2013)examined the variability on O3concentration for the period of 1985–2006 using the global chemical transport model GEOS-Chem and showed that changes in cloud cover and temperature were important for O3variability. Fu and Liao(2012)found that the interannual variations in meteorological parameters changed the summertime O3concentrations over 2001–06 by 3–5 ppbv. Lou et al.(2015)indicated that,in North China during 2004–12(Fig.3), the interannual variation in simulated surface O3concentrations induced by variations in meteorology were larger than those caused by changes in anthropogenic emissions,and the variations in winds were found to have the largest impact on the interannual variation of surface-layer O3among all meteorological parameters, followed by temperature and specific humidity. On the basis of these studies,the interannual variations in surface O3concentrations driven by meteorological parameters alone are in the range of 0.5–5.0 ppbv in China.
3.2.2. Impacts of the East Asian monsoon on O3concentrations
The East Asian monsoon, which is the most important pattern of general circulation that drives meteorology over East Asia, has been demonstrated to influence the seasonal and interannual variation of O3in China (Tang et al., 2013;Zhou et al.,2013;Yang et al.,2014a;Li et al.,2018a). Tang et al. (2013) explored five years (2007–11) of surface O3measurements at an agricultural site in the northern YRD region and found a bimodal pattern in the seasonal variation of O3with peaks in June and October, which was mostly due to variations in marine air mass incursions driven by the Asian summer monsoon and open crop residue burning across the regions.By analyzing 11 years of ozonesonde data in Hong Kong with the aid of Lagrangian dispersion modeling, Zhou et al. (2013) indicated that the interannual variability in the boundary layer O3was mainly associated with the intensity of the East Asian monsoon, with high O3mixing ratios being linked to northeasterly circulation anomalies.Yang et al. (2014a) quantified the impact of the EASM on summertime surface O3concentrations over China for 1986–2006 and reported positive correlation between summertime O3concentrations and the EASM strength.The largest difference in O3concentration between the strongest and weakest EASM years exceeded 6% in northeastern and southwestern China, which was mostly attributed to the differences in the transboundary transport of O3between strongest and weakest EASM years. Li et al. (2018a) analyzed the impact of EASM intensity on O3concentrations using the RegCM4-Chem model and illustrated that the chemistry was the uppermost process controlling summertime O3over eastern China during monsoon seasons,through changing winds in the lower troposphere, cloud cover, and downward shortwave radiation.
3.2.3. Impacts of climate change on future O3concentrations
By coupling a general circulation model (GCM) and CTMs,some studies have examined the future changes in surface O3over China under different climate scenarios and the potential drivers for the changes. These model results have generally showed that a warmer climate would lead to increased O3levels overpopulated areas as a result of enhanced biogenic hydrocarbon emissions and accelerated decomposition of peroxyacetyl nitrate (PAN) to form NOxat higher temperature(Jacob and Winner,2009;Doherty et al.,2013).However,tropospheric O3levels in remote regions were simulated to decrease at higher temperature, because increased water vapor accompanied by the higher temperature would increase O3destruction and therefore cause a shorter O3lifetime(Fiore et al.,2012).Through sensitivity simulations,Lee et al. (2015) compared the contributions of climate change and emission changes to the changes in summertime MDA8 O3concentrations over 2000–50 under the A2 scenario and found that the regional climate change would lead to a decrease in O3by 2.2 ppbv in China, owing to an increase in precipitation and cloud fraction in the 2050s relative to the year 2000.Liu et al.(2013b)reported that surface O3concentrations in the afternoon in autumn could be changed by ±5 ppbv in southern China over 2005–55 owing to the changes in both meteorology and biogenic emissions under the IPCC A1B scenario. Wang et al. (2013b) also reported that summertime O3would increase largely over eastern China, with local increases of up to 10 ppbv due to the climate change alone over 2000–50 under the A1B scenario, representing a significant “climate change penalty”. In contrast, the surface O3over western China was simulated to decrease with the 2050 climate, with the largest reduction of 5 ppbv, implying a“climate change benefit”.The aforementioned studies have indicated that changes in BVOCs under future climate tend to modify O3concentrations, but, currently, the effect of BVOCs on O3formation under the future climate scenarios remains uncertain. Some studies have found that atmospheric CO2,O3and soil moisture affect BVOCs emissions(Pe˜nuelas and Staudt,2010),although the biochemical mechanisms have not been fully understood(Guenther et al.,2012). For example, Tai et al. (2013) predicted that climate change over 2000–50 could enhance summertime O3by up to 6 ppbv in eastern China,while upon an inclusion of the inhibition effect of CO2on isoprene,the projected O3changes due to climate change were substantially modified.

Fig.3. Mean absolute deviation (units: ppbv) of seasonal mean surface O3 concentrations obtained from simulations of (a)CTRL,(b)MET,(c)AEMIS,and(d)AEMISB for the period 2014–12 over China. CTRL represents the interannual variation(IAVs) of O3 driven by both meteorological fields and emissions (including anthropogenic, natural, and biomass emissions).MET represents the IAVs of O3 driven by meteorological fields alone. AEMIS represents the IAVs of O3 driven by anthropogenic emissions alone. AEMISB represents the IAVs of O3 driven by biomass burning emissions change alone. [Reprinted from Lou et al.(2015)].
In summary,studies so far have shown that O3concentrations are sensitive to meteorological conditions on synoptic,interannual, and decadal time scales, which have important implications for O3air quality planning. Scientifically,more studies are needed for systematic understanding of the meteorological conditions for the occurrence of severe O3pollution(duration, intensity etc.) at regional scales. For the development of O3air quality control strategies for different time scales,if meteorological conditions in the regions are not favorable for O3air quality, extra efforts are needed to reduce emissions.
3.3. Impacts of land use and land cover changes on O3 concentrations
Land use and land cover(LULC)change often occurs in response to both human influences (e.g., urbanization, agriculture development,deforestation or afforestation practices,and agricultural waste burning) and climate influences (e.g.,CO2fertilization,climate-driven biome shifts and wildfires).LULC change has impacts on climate by perturbing surface albedo, the water cycle, and concentrations of atmospheric chemical components. For instance,the terrestrial biosphere is a significant emission source of isoprene,a dominant biogenic hydrocarbon species with a global annual emission comparable to anthropogenic emissions.The emission of isoprene depends on the type and density of vegetation and other environmental conditions(Guenther et al.,2012).In polluted regions with high NOxconcentrations, the oxidation of isoprene contributes to O3production. In remote regions with low NOx, isoprene may reduce O3by ozonolysis or by sequestering NOxas isoprene nitrate. In addition, dry deposition onto the surface, and specifically the uptake by vegetation,represents a dominant sink within the boundary layer for trace gases and particles.
A growing number of high-resolution modeling studies have investigated the impacts of regional-scale LULC change on O3using satellite-derived and land survey data. By using the WRF-Chem model and dynamical vegetation datasets derived from MODIS and AVHRR measurements, Li et al.(2015)found that a twofold increase in BVOC emissions by LULC in the PRD from the early 1990s to 2006 increased surface O3concentrations in the downwind region by 0.9–4.6 ppbv,whereas the large increase in BVOC emissions during 2006–12 tended to reduce the peak surface O3concentrations by 1.6–2.5 ppbv in rural regions. Liao et al. (2015)simulated,by using the WRF-Chem model,that urbanization between 1992 and 2004 caused an increase of O3by up to 6.8 ppbv(2.3 ppbv)during daytime in July(January)in the YRD region. Li et al. (2016b) reported that urbanization-induced changes in atmospheric circulation could lead to decreases in daytime O3concentration by about 1.3 ppbv. The recent work by Tao et al. (2018) reported that LULC change over the BTH region could lead to an increase in summertime O3of 0.4–4.3 ppbv during daytime in Beijing but a decrease in O3by up to 3.4 ppbv at noon in Tianjin.
Historical and future changes in LULC have also been shown to have important ramifications for tropospheric O3in China.Fu and Liao(2014)found that the seasonal mean surface O3concentrations changed by −4 to +6 ppbv in China between the late 1980s and mid-2000s owing to changes in both climate and land cover. Further, Fu and Tai (2015)showed that LULC change alone between the periods of 1981–85 and 2007–11 led to decreases in summertime O3by up to 4 ppbv in China,and the sensitivity of surface O3to land cover change is more dependent on dry deposition than on isoprene emission in most of the study area(Fig.4).
3.4. Impacts of aerosols on O3 concentrations
The presence of aerosol in the atmosphere has a large influence on photochemical reactions. The formation and growth of secondary aerosols,i.e.,sulfate and nitrate aerosol,are related to the abundance of the precursor gases (SO2,NOx)and atmospheric oxidants such as OH radical,hydrogen peroxide(H2O2),and O3(Seinfeld and Pandis,2006;Unger et al.,2006).Thereby, the changes in concentrations of OH,H2O2,and NOxresulting from the formation of aerosols are expected to influence concentrations of tropospheric O3.Additionally, the heterogeneous reactions of chemicals such as dinitrogen pentoxide(N2O5),NO3,NO2,and HO2on aerosol surfaces (sulfate, nitrate, ammonium, organic carbon, sea salt, and mineral dust) have considerable impacts on the O3concentration (Liao and Seinfeld, 2005). Moreover, aerosol can influence the climate (temperature, atmospheric ventilation, cloud formation precipitation etc.) by direct, indirect and semi-direct radiative effects,which can further influence O3concentration.
Some existing modeling studies have endeavored to identify the influence of aerosols on O3concentration in China by heterogeneous reactions and by altering photolysis rates(Li et al., 2011; Xu et al., 2012; Lou et al., 2014). Li et al. (2011) found that the summertime O3in the boundary layer was reduced by 5% in highly polluted regions over central and eastern China, driven by the 53% reduction in daytime average O3→O (1D) photolysis frequency in the lower troposphere.Xu et al.(2012)revealed that the absorption of NO2by aerosols could increase O3at noon by 4–20 ppbv in VOC-limited urban areas but decrease O3by 4–10 ppbv in NOx-limited suburban areas during a high O3episode that occurred in Beijing during June 26–27 2000,suggesting that the impact of heterogeneous reactions on O3depends on the local VOC/NOxratio. They also showed that the reduced photolysis rate by aerosol radiative effects led to a large decrease in O3concentration of up to 73 ppbv in Beijing.Lou et al. (2014) reported that the impact of aerosols on O3by heterogeneous reactions was simulated to be much larger than that of aerosols on O3by altering the photolysis rate in China. Feng et al. (2016) investigated a heavy air pollution episode with high concentrations of O3and PM2.5, and found that high aerosol concentrations in Xi’an and the surrounding areas significantly reduced the photolysis frequencies and hence reduced O3concentrations by about 25 ppb on average. A recent study by Qu et al.(2018)suggested that the relative roles of heterogeneous reactions and the changes in photolysis rates by aerosols depend on the concentration of aerosols. In their simulations for Nanjing, heterogeneous reactions dominated O3reduction when aerosol levels were low(PM2.5<50µg m−3),whereas changes in photolysis by aerosols led to a greater O3reduction when aerosol concentrations were high(PM2.5>50µg m−3).
Few studies have quantified the impacts of aerosol formation on O3concentrations in China. For example, Yang et al.(2014b)showed that the chemical reactions associated with sulfate formation were simulated to increase O3concentrations over the NCP and Sichuan Basin of China, with maximum increases of ∼2.0 ppbv in the NCP and ∼3.0 ppbv in the Sichuan Basin in spring.The effect of nitrate formation on O3concentration is opposite,leading to a decrease in O3concentration by up to 1.0 ppbv in summer in eastern China.
Changes in meteorology induced by radiative effects of aerosols can also influence O3concentrations. By using a coupled meteorology–air quality model, Xing et al. (2015)found that the inclusion of the aerosol direct radiative effect led to an increase in surface O3by 2%–3%in eastern China,as averaged over 1990–2010,which mainly resulted from the aerosol-induced lower planetary boundary layer height and the increased precursor concentrations. Wang et al. (2016a)simulated the direct effect of aerosols on O3air quality in March 2005, and found that the surface daily maximum 1-h O3(MD1O3) was reduced by up to 12% in eastern China as a result of less radiation reaching the surface. Xing et al.(2017)found that the aerosol direct effect reduced the surface MD1O3in eastern China by up to 11 ppbv in January but increased it in most areas of China by up to 2 ppbv in July due to the aerosol-induced changes in atmospheric stability,suggesting that the reductions in aerosols will have the potential risk of increasing O3in winter but the benefit of reducing the maximum O3in summer.
The studies cited above underscore the considerable effects of aerosols on O3concentrations in China. However,the mechanism of the heterogeneous reactions and some coefficients in related processes remain uncertain. Subsequent experiments,including in-situ measurements and model simulations,should be carried out in future research.
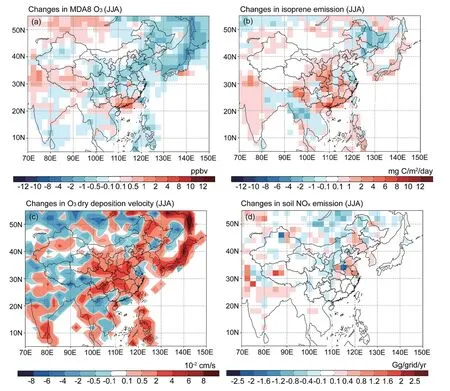
Fig.4. Changes in summertime (a) surface maximum daily 8-h average O3 concentration (MDA8 O3), (b) isoprene emissions, (c) O3 dry deposition velocity, and (d) soil NOx emissions, driven by changes in land cover and land use alone over 1980–2010. [Reprinted from Fu and Tai(2015)].
4. Influence of tropospheric O3 on climate
Tropospheric O3is distinguished from other well-mixed greenhouse gases (i.e., CO2and CH4) by having significant spatial and temporal heterogeneity due to its relatively short lifetime of a few days to several weeks. Changes in O3concentrations perturb the radiative energy budget of the earth–atmosphere system,which may further alter the climate. Furthermore, O3can affect climate indirectly via modification of the surface fluxes of energy and water as well as the land carbon sink. Many field experiments have demonstrated the damaging effect of surface O3on vegetation productivity.The phytotoxicity of tropospheric O3has been shown to reduce the ability of plants to absorb CO2, then to decrease photosynthesis, plant growth and biomass accumulation by entering leaves through the stomata,generating other reactive oxygen species and causing oxidative stress(Ainsworth et al.,2012;Feng et al.,2015).In this review,we describe recent estimates of radiative forcing(RF)by tropospheric O3,as well as the RF and regional climate resulted from the changes in tropospheric O3over China.
4.1. RF of tropospheric O3
Due to the significant increases in anthropogenic emissions since pre-industrial times,the increases in tropospheric O3have amplified its greenhouse effect,and thus contributes to the RF.Relying on a limited number of studies for the period of 1998–2011 with regard to the RF of short-lived components(Skeie et al.,2011;Søvde et al.,2011;Shindell et al.,2013), the IPCC Fifth Assessment Report (AR5) suggested that the global mean RF due to tropospheric O3was 0.4(0.2–0.6)W m−2over 1750–2011(Myhre et al.,2013).The recent estimate by Myhre et al.(2017)showed that the global mean RF due to the changes in tropospheric O3and aerosol over 1990–2015 was 0.17±0.08 W m−2,in which approximately one-third was due to tropospheric O3(0.06 W m−2),and this value was larger than that reported in IPCC AR5 for the same time period. Understanding the contribution that individual countries have made to global RF is of particular importance for implementation of the agreement on “common but differentiated responsibilities” reached by the United Nations Framework Convention on Climate Change. However, few studies have examined the RF induced by tropospheric O3over recent decades in China. Table 3 summarizes the simulated annual mean tropospheric O3RF over China. Early estimates of annual mean RF of tropospheric O3over the domain of China were in the range of 0.45–0.87 W m−2for the present day (year 2000) relative to pre-industrial times(Berntsen et al.,2000;Wang et al.,2005;Chang et al.,2009;Chang and Liao, 2009), indicating the large positive contribution of tropospheric O3over China to global RF. Li et al.(2016a) quantified the relative and absolute contributions of historical anthropogenic emissions of well-mixed greenhouse gases,O3precursors and aerosols in China to global RF over 1750–2010 and found that China contributed approximately 12%±2%(0.48±0.09 W m−2)of the global positive RF from well-mixed greenhouse gases, tropospheric O3, and black carbon (BC). The RF induced by China through emissions of precursors of O3was as much as +0.2 W m−2over eastern China. Zhu and Liao(2016)estimated an averaged RF of tropospheric O3of+0.58 W m−2over eastern China for the period of 1850–2000,with high RF values of 0.6–0.8 W m−2found over central and eastern China(i.e.,the Sichuan Basin and the provinces of Hunan,Hubei and Jiangxi)and low RF values of 0.2–0.4 W m−2over the Tibetan Plateau.
Zhu and Liao(2016)projected future changes(2000–50)in the annual mean RF of tropospheric O3under the four RCP scenarios (RCP2.6, RCP4.5, RCP6.0 and RCP8.5) and reported that the four RCP scenarios provide a wide range of possible future changes in O3RF,from −0.11 W m−2under RCP2.6 to +0.14 W m−2under RCP8.5, in 2050 relative to 2000, which offer options for mitigating warming over eastern China from 2000 to 2050(Fig.5).
4.2. Climate effects of tropospheric O3
The climate effects of tropospheric O3have drawn widespread attention,but only a small number of studies have examined the impacts of tropospheric O3on climate in China.Xie et al.(2016),by using an aerosol–climate coupled model,BCCUACE/Aero, found that the changes in tropospheric O3over 1850–2013 increased the surface temperature by 0.2◦C–0.8◦C, whereas they reduced precipitation in most of China. Zhang et al. (2018) reported that the changes in short-lived climatic pollutants(SLCPs),including CH4,tropospheric O3and BC,under the three RCP scenarios,would lead to different climate responses for the period 2010–50, especially in regional climate. For example, by 2050,changes in the SLCPs would increase surface temperature in north China under RCP8.5 but reduce surface temperature by up to 0.6 K(0.8 K)under RCP4.5(RCP2.6)in the same region. However,they examined only the climate responses to changes in all of CH4, tropospheric O3and BC,and did not distinguish the role of tropospheric O3. Recently, Li et al.(2018b) examined the radiative effect of tropospheric O3on monsoon circulation and the possible feedback mechanism by using the regional climate model RegCM4, and reported that changes in tropospheric O3led to an increase in summertime temperature by 0.06 K and an increase in precipitation by 0.22 mm d−1over eastern China.
5. Summary and recommendations

Table 3.Summary of the simulated annual mean tropospheric O3 radiative forcing over China.
This review is focused on the recent advances in existing literature on tropospheric O3in China from 2011 to 2018,including the observed O3abundance and its variations in the troposphere,the factors that determine O3formation and distribution, and the influences of tropospheric O3on regional climate in China. We offer the following conclusions and recommendations:

Fig.5.Projected future changes in annual mean tropospheric O3 radiative forcing(units: W m−2)at the tropopause over 2010–50 for every decade(relative to the year 2000)under the RCP scenarios. The annual mean O3 radiative forcing averaged over eastern China(18◦–45◦N,95◦–125◦E)is shown in the top-right corner of each panel. [Reprinted from Zhu and Liao(2016)].
(1)The available observational studies have shown an increasing trend of tropospheric O3in China and more frequent extreme pollution episodes. In the past five years,severe O3pollution events were detected in city clusters of China(e.g.the North China Plain,the Yangtze River Delta,and the Pearl River Delta).Previous studies have shown that the O3levels increased at a rate of 1.0–3.0 ppbv yr−1at several sites in eastern China over the past two decades, which was higher than the overall rate of increase(0.45 ppbv yr−1)in other places of East Asia(Japan and Korea). However,knowledge of the interannual variation and decadal trend of O3concentration on a nationwide scale is still limited. With the development of the National Air Quality Monitoring Network and the regular monitoring of surface O3around China,more studies should be focused on the spatial and temporal variations in the whole of China to better understand O3air quality in China.
(2)Measurements and modeling studies have highlighted the important role of anthropogenic emissions in the shortterm and long-term variations of surface O3concentrations in China. However, estimates of the changes in O3concentrations caused by the changes in anthropogenic emissions in China are still subject to large uncertainties. The major uncertainty arises from anthropogenic emissions inventories. In this regard,it is strongly suggested that consistent and up-todate emissions inventories should be made available for improving model performance and for assessing the effectiveness of emission regulations on current and short-term trends of O3air quality. Additionally,in terms of regional emission controls,future work should be focused on a more systematic analysis of the relationships between O3and its precursors,especially the spatial variability of O3sensitivity to changes in O3precursors,which may help to determine the regionalscale O3chemical formation regimes in China.
(3)Modeling studies in China have suggested that,on the interannual time scale, the variations in meteorological conditions may have larger influences on surface O3concentrations than the changes in anthropogenic emissions. The East Asian monsoon,as a critical climate pattern in Asia,has been found to have large influences on the seasonal and interannual variability of O3in China. Therefore,if meteorological conditions are not favorable for O3air quality,short-term air quality control may need extra effort to reduce emissions. A systematic understanding of the relationships among largescale circulation,synoptic-scale circulation patterns,and tropospheric O3concentrations in China should be addressed in future studies.Likewise,on the decadal scale,climate change may at least partly offset or aggravate the effect of changes in emissions regionally,representing a“climate change benefit”or“climate change penalty”on O3air quality. Therefore,the effects of climate change should receive particular attention to achieve given air quality goals. Some studies have suggested that the ambient CO2levels could affect biogenic isoprene emissions and may partly offset the effects of climate warming,which is a source of uncertainty for O3air quality in the coming century. In this regard,it is recommended that more research be conducted on the effects of CO2-isoprene inhibition,as well as soil moisture,on isoprene emissions for a comprehensive assessment of the impact of climate on O3air quality.
(4) The variation characteristics of severe O3pollution,and the possible factors affecting the occurrence of high O3episodes are discussed. However,most studies were focused on analyzing a small number of high O3pollution days or O3air quality in a single city or on a local scale.There is a lack of systematic understanding of the characteristics(e.g.,duration and intensity) of severe O3pollution in China. The mechanisms of medium-term and long-term variations in severe O3pollution episodes are still unclear.Further studies are needed to examine how atmospheric circulation and weather types affect the formation and development of high O3events.
(5)LULC driven by climate change and human activities may substantially impact O3air quality in China, although this effect is less considerable than the effects of changes in climate and anthropogenic emissions. Future studies should be focused on a more systematic analysis of the spatial variability of O3sensitivity to vegetation changes in China. Anthropogenic land use changes,such as urbanization,crop expansion, biofuel development, afforestation, and some agricultural practices,may further complicate the effects of land cover changes,and the implications for O3need to be considered in future studies,which may benefit both long-term land use policies and air quality regulations.
(6)Research on the effects of aerosols on O3concentrations in China is limited, and the mechanism of the heterogeneous reactions, the combined effect of particles on both photolysis rates and heterogeneous reactions, and some coefficients in related processes have not been thoroughly elucidated to date. Subsequent experiments, including in-situ measurements and model simulations, should be addressed in future research. In particular, in recent years, the Chinese government has implemented stringent control actions for reducing aerosol concentrations. Whether such extensive aerosol controls will aggravate O3pollution remains an unclear issue,and the impact of aerosols on O3pollution needs further quantification and assessment for air pollution cleaning strategies. Such studies will benefit both scientific cognition and policy-making for fighting against the complex air pollution in China.
(7)Large changes in regional emissions of O3precursors,aerosol precursors, and aerosols have occurred over China,and the net effect of these emission changes on the Earth’s radiative balance is less clear. Therefore,an improved understanding of the impacts of O3on climate over China is very necessary to evaluate the climate impacts of recent and future air quality regulations and the potential to mitigate near-term warming by selective emission reductions of SLCPs.
Acknowledgements.This work was supported by the National Natural Science Foundation of China (Grant Nos. 91744311 and 91544219), the National Key Research and Development Program of China (Grant No. 2016YFA0600203) and the National Natural Science Foundation of China(Grant No.41405138).
杂志排行

Advances in Atmospheric Sciences的其它文章
- Pathways of Influence of the Northern Hemisphere Mid–high Latitudes on East Asian Climate: A Review
- Progress in Semi-arid Climate Change Studies in China
- Recent Progress in Numerical Atmospheric Modeling in China
- Recent Progress in Dual-Polarization Radar Research and Applications in China
- A Review of Atmospheric Electricity Research in China from 2011 to 2018
- Recent Progress of Aerosol Light-scattering Enhancement Factor Studies in China