Regional Advantages of Green Feed Production in China: Based on Panel Data of 31 Provinces in China from 2014 to 2016
2019-06-27JianweiYAN
Jianwei YAN
Zhoukou Development Research Center, Zhoukou Normal College, Zhoukou 466000, China
Abstract The panel data of 31 provinces in China from 2014 to 2016 were subjected to production concentration ratio and scale comparative advantage index analysis combining explicit supply and implicit demand. It was found that the explicit supply of green feed production and the production areas of beef cattle and mutton sheep related to implicit demand of green feed production terminal are relatively concentrated and stable. The area of green feed production with scale comparative advantage accounts for a large proportion. The number of advantageous areas was less than that of beef cattle and mutton sheep. There were fewer matching advantageous areas between the explicit green feed supply and the implicit cattle and sheep consumption across China. According to the matching between explicit green feed supply and implicit beef and sheep consumption, China’s green feed production can be divided into four types. Therefore, based on grasping the current layout of green feed and beef cattle and mutton sheep production, according to the comparative advantages of each region, the government should make reasonable arrangements according to local conditions and adopt different development strategies for different regions.
Key words Grain crop-cash crop-forage ternary structure, Green crops, Regional layout, Comparative advantage
1 Introduction
With the rapid development of economy and the acceleration of agricultural modernization, the animal husbandry industry in China has developed rapidly. The construction and coordinated development of regions with grain crop-cash crop-forage rotation has received more and more attention from the government. Since 2014, China’s economy has entered a new normal. There is an urgent need to promote supply-side reforms to promote economic development. For three consecutive years, the No.1 Document of the Central Committee proposed to accelerate the development of herbivore and grass farming, support for the cultivation of silage crops such as silage corn and alfalfa, pilot the modes that change grain crops to feed crops or combine planting and feeding, and accelerate the construction of a ternary planting structure for the coordinated development of grain crop, cash crop and silage[1]. It is an important issue to ensure national food security, increase farmers’ income and promote structural reforms in the supply side of agriculture. Optimizing the layout of green feed production and accelerating the reform of crop planting structure is an urgent need to promote grain destocking, a realistic choice to reduce the cost of agriculture and animal husbandry, an important way to promote the combination of planting and breeding and the integration of the primary, secondary and tertiary industries, and is an important measure to implement the spirit of the No.1 Document of the Central Committee and promote the structural reform of the supply side of agriculture. Therefore, the current research on the layout of green feed production in China is of great significance.
At present, domestic scholars have a lot of research results on the layout of bulk grain and even some economic crops. For example, Zhu Qirong used the area index to analyze the changes in China’s cotton layout[2]. Zhong Funingetal. and Yang Chun used the planting area and comprehensive comparative advantage index to explore the rice production layout in China[3-4]. Yang Yanzhaoetal.[5]used the methods of economic modal decomposition, production concentration ratio and spatial center statistics to study the spatial and temporal layout of corn production in China[5]. Liu Xueetal.[6]used the geographical concentration ratio and scale advantage index to analyze the vegetable pattern. Wang Zhidanetal.[7]used the scale comparative advantage index, efficiency comparative advantage index and comprehensive comparative advantage index to study the advantageous layout of melon production[7]. In view of the mature research methods of the predecessors, the research methods of agricultural regional advantageous layout are mostly concentrated on the comparison of product scale, benefit, cost or comparative advantage index. Green crops are a kind of special agricultural products. For a long time, limited to China’s grain crop-cash crop dual structure, coupled with the neglect of statistics on the production of green crops, the academic community is less concerned about the green feed industry, especially its layout. In view of the inaccessibility of the indicator data, as the study of the green feed layout cannot be "fact oriented" as the previous agricultural products (green feed is for herbivores and animals such as cattle and sheep. It is generally not suitable for dry storage or long-distance transportation, so it is mostly supplied to local areas, such as silage corn), this study adopted the production concentration ratio and scale comparative advantage index of explicit supply and implicit demand to study the regional advantage layout of green crops in China, based on the panel data of 31 provinces (cities, regious) ofChinaStatisticalYearbookandChinaRuralStatisticalYearbookfrom 2014 to 2016, in order to provide reference suggestions for the regional construction of the grain crop-cash crop-forage ternary planting structure in the current agricultural supply-side structural reforms.
2 Theoretical basis, research methods and data source
2.2 Research methods
2.2.1Production concentration and concentration ratio (CRn). Production concentration ratio refers to the proportion of the production scale of a certain agricultural product in a certain region to the total production scale of the agricultural product in the country of the same period.
Concentration ratio (CRn) is generally measured as a percentage of the size of the topnproducers to the total size of the sector. The greater the CRnis, the higher the concentration is; otherwise, the lower the concentration is. Concentration is an important indicator to measure the structure of the sector’s industrial market. This indicator also applies to agricultural production. According to the standards of industrial concentration of American economist Bain and the Ministry of Internal Trade and Industry of Japan, the industrial market structure is roughly classified into an oligopoly type (CR8≥40%) and a competitive type (CR8<40%). Between them, the oligopoly is subdivided into extremely high oligopoly (CR8≥70%) and low oligopoly (40%≤CR8<70%)[9].
2.2.2Scale comparative advantage index. Scale comparative advantage index is often used in difference analysis of comparative advantages of crops. It measures the comparative advantage of crop production in a certain region from the perspective of scale and specialization of production[10]. The formula is as follows:
SAI=(Pit/Pi)/(Qt/Q)
where,Pitis the planting area of a certain crop in provinceiin periodt;Piis the planting area of all crops in provinceiin periodt;Qtis the planting area of a certain crop across the country in periodt; andQis the planting area of all crops in the country. IfSAI>1, it suggests that the production of a certain crop in the region has a scale advantage. If the value is large, it suggests that the scale and the degree of specialization of the crop in the region are relatively high.
It seemed to fly rather than gallop44, but so smoothly45 that Beauty was not frightened; indeed, she would have enjoyed the journey if she had not feared what might happen to her at the end of it
2.2.3Explicit supply and implicit demand. As the production of green crops is for the consumption of herbivorous animal industry such as beef cattle and mutton sheep, the indicators calculated from the data of green crops are the explicit supply indicators, and the indicators calculated from the data of beef cattle and mutton sheep in the animal husbandry are implicit demand indicators. The combination of the two is used to supplement the lack of a single green feed indicator to analyze regional production advantages. Among them, the green feed production data came from theChinaRuralStatisticalYearbookfrom 2014 to 2016, and the production data of beef cattle and mutton sheep came from theChinaStatisticalYearbookfrom 2014 to 2016.
3 Results and analysis
3.1 Comparative analysis of explicit supply and implicit demand of China’s green feed-producing provinces
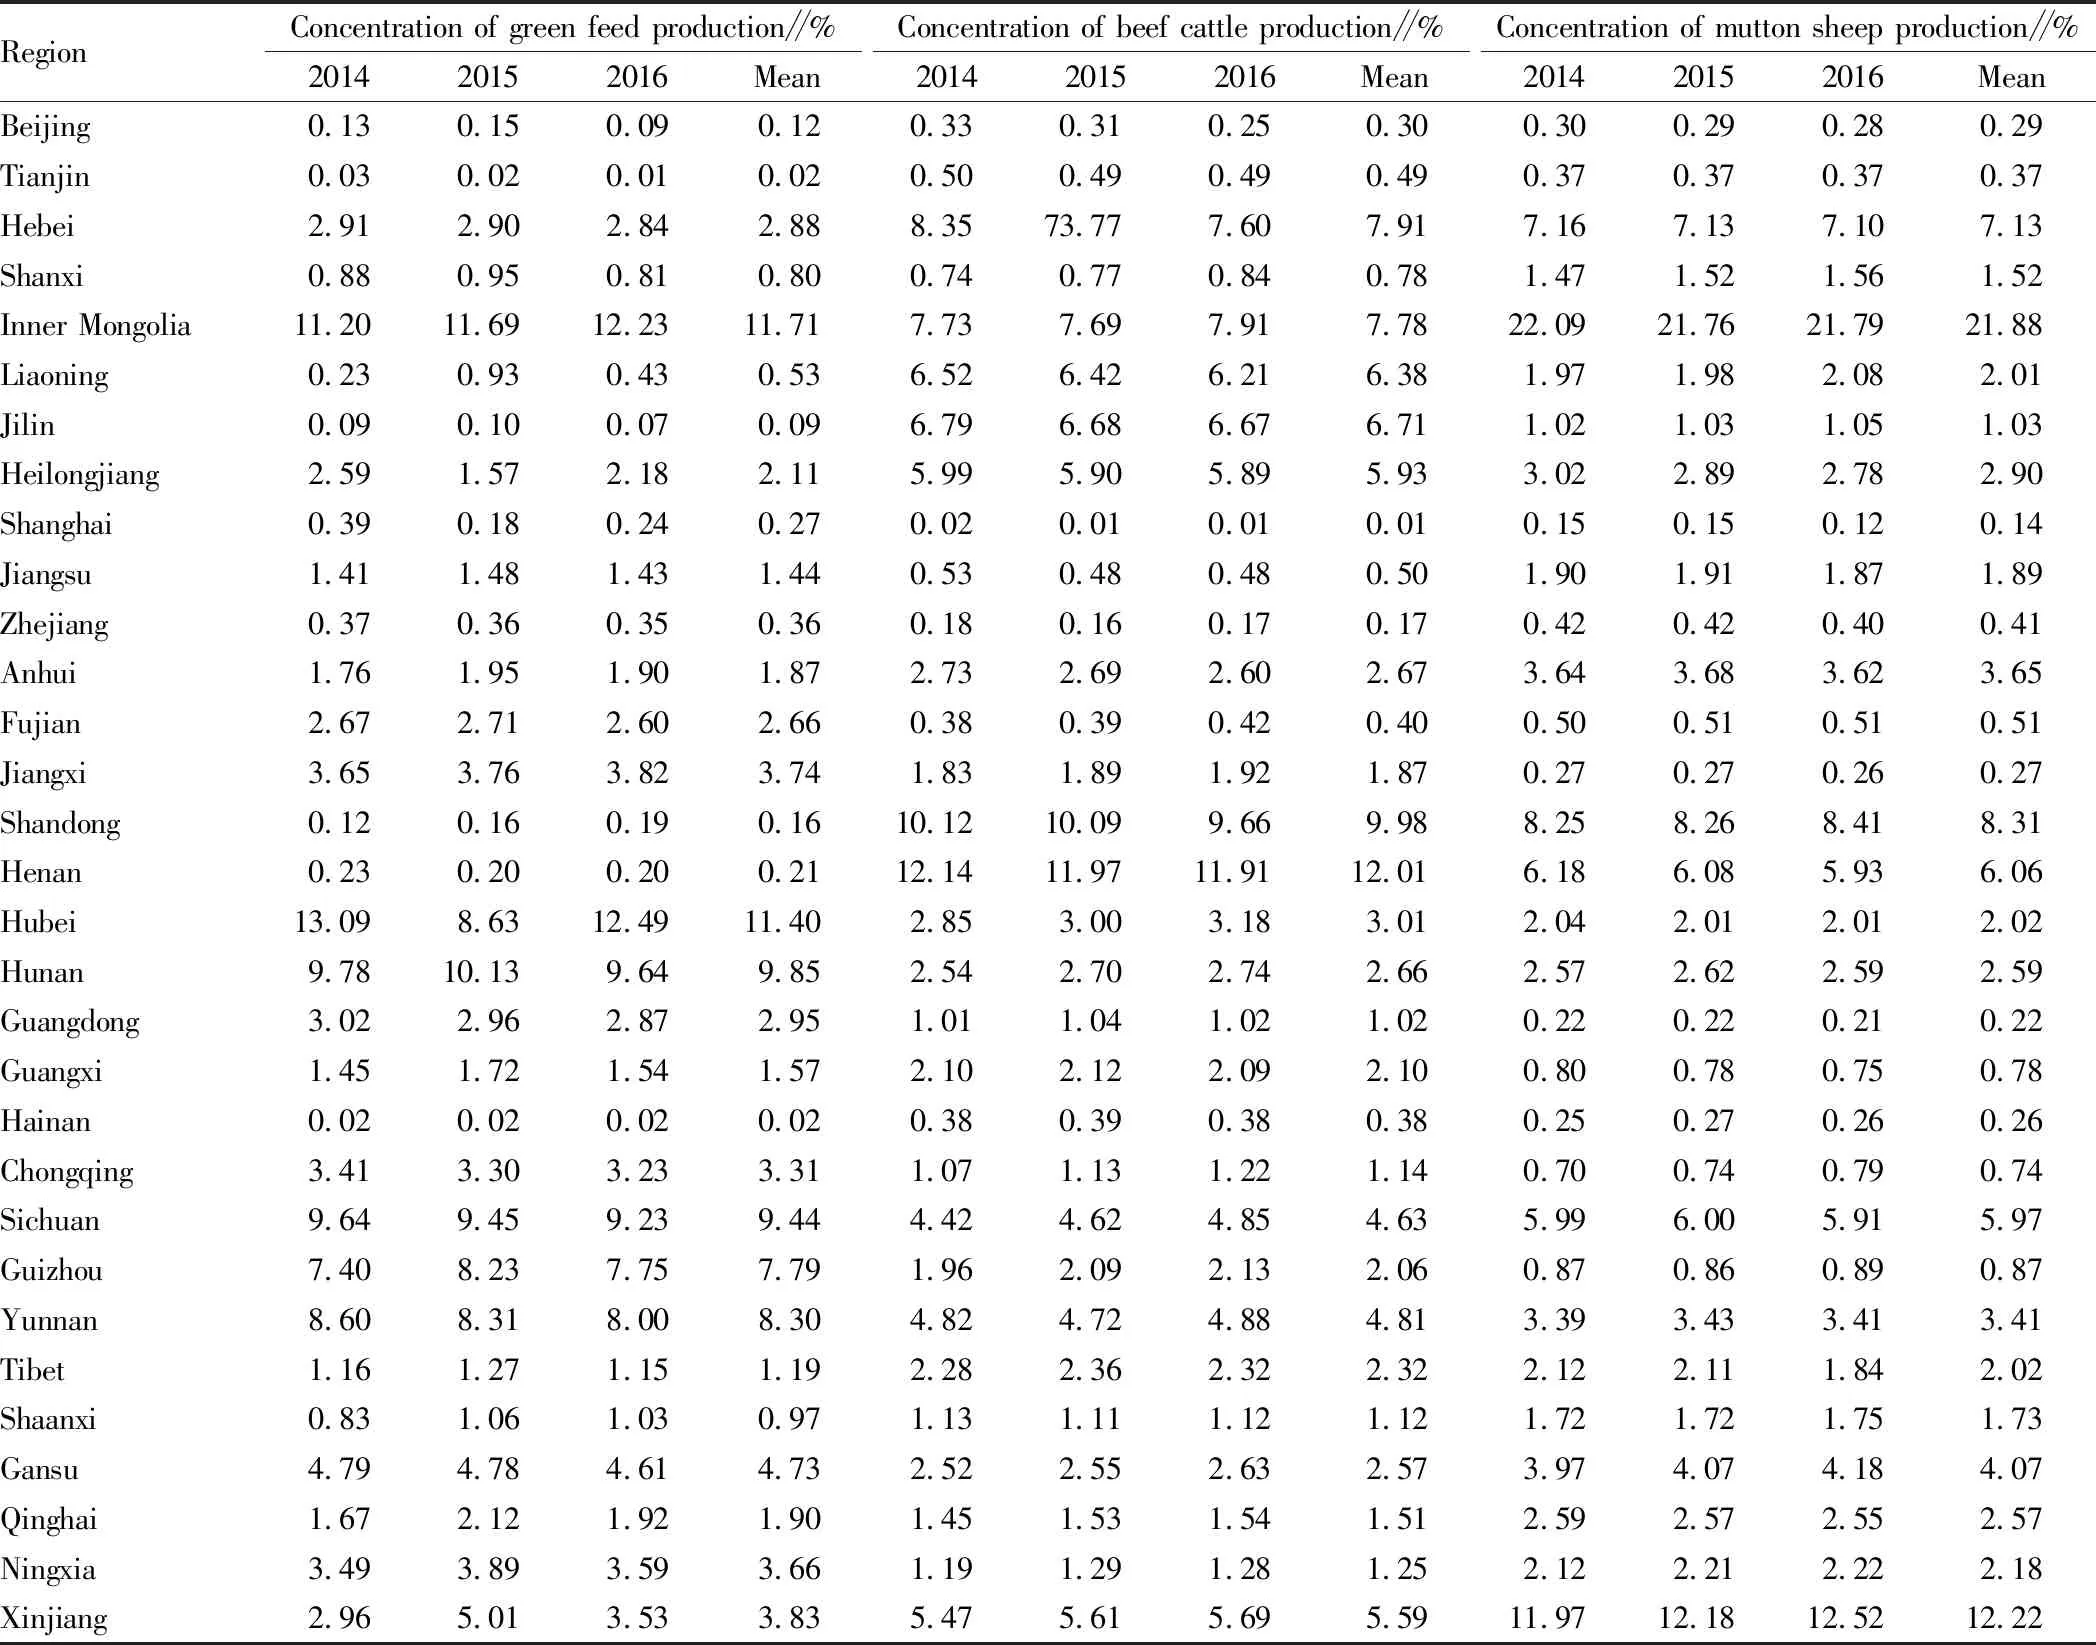
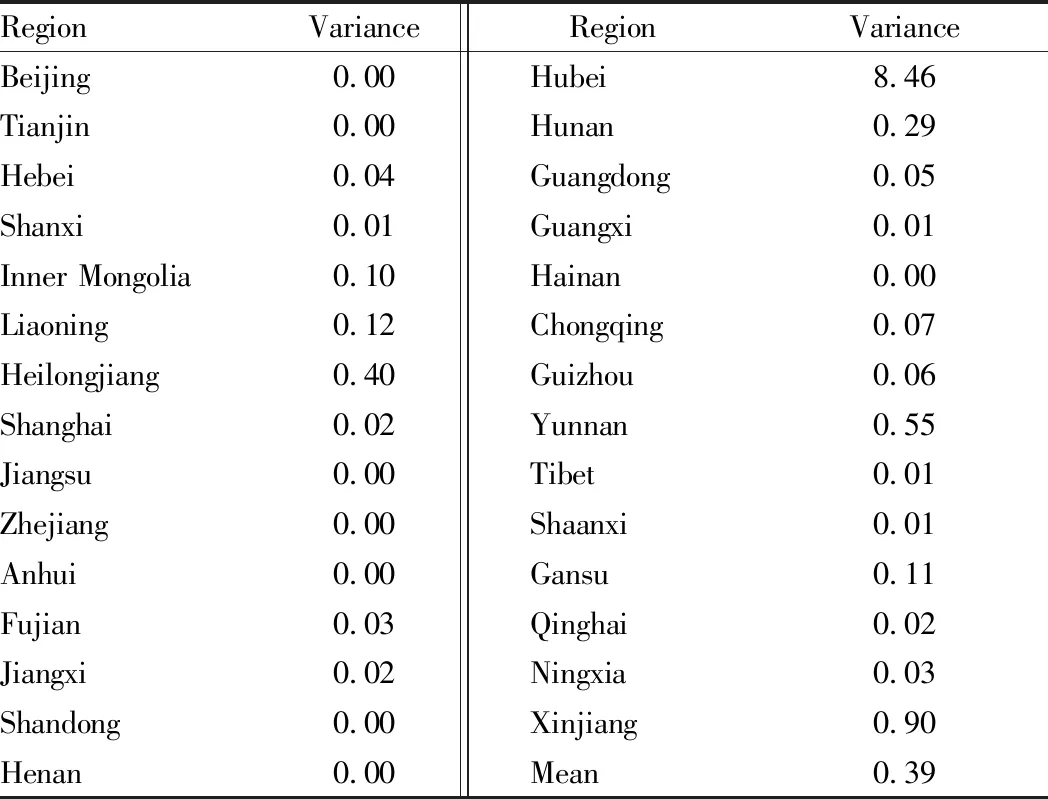
3.1.1Production concentration analysis. (i) Production concentration of green feed of explicit supply. According to Table 1, the average concentrations of green feed production in the 31 provinces (cities, districts) in the past three years are known. The production of green feed in each of 20 provinces accounted for more than 1% of China’s total, and their total accounted for 96.33% of China’s total. They are mostly distributed in the humid temperate zone, the middle temperate zone, and the subtropical monsoon climate zone. Among them, the proportion of green feed production in 14 provinces ranged from 1% to 5%, and their total accounted for 37.84% of China’s total. The proportion of green feed production in 4 provinces (Sichuan, Guizhou, Yunnan and Hunan) ranged from 5% to 10%, and their total accounted for 35.38% of China’s total. The green feed production in Inner Mongolia and Hubei accounted for 10% of China’s total, respectively, and their total accounted for 23.11%. As shown by data, the production area of green crops in China was very concentrated. The total scale of green feed production in the five provinces (except Inner Mongolia) of which the green feed production accounted for more than 5% of China’s total, respectively accounted for 46.78% of China’s total production scale. They are located in the humid subtropical monsoon climate zone in the southwest and central regions. The data about production concentration ratio CR8 were shown in Table 2. The total green feed production scale of the top 8 provinces accounted for about 70% of the total production of China, further indicating that the industrial structure of China’s green feed production was oligopolistic and the industrial concentration was high. Table 3 shows the variances of green feed production scale in various regions in the past three years. The change in the total scale of green feed production in 31 provinces was small, and the variance of the change was only 0.38. In terms of single provinces, there were 3 provinces with a variance of 0.5 or more. Among them, only the green feed production area in Hubei Province fluctuated greatly, which was much higher than the other 30 provinces. The data show that the green feed production in various regions of China was relatively stable. In addition to natural climate reasons, this might also be related to history, economy and social customs.
Table 1 Concentration of green feed, beef cattle and mutton sheep production in China from 2014 to 2016
RegionConcentration of green feed production∥%201420152016MeanConcentration of beef cattle production∥%201420152016MeanConcentration of mutton sheep production∥%201420152016MeanBeijing0.13 0.15 0.09 0.12 0.33 0.31 0.25 0.30 0.30 0.29 0.28 0.29 Tianjin0.03 0.02 0.01 0.02 0.50 0.49 0.49 0.49 0.37 0.37 0.37 0.37 Hebei2.91 2.90 2.84 2.88 8.35 73.77 7.60 7.91 7.16 7.13 7.10 7.13 Shanxi0.88 0.95 0.81 0.80 0.74 0.77 0.84 0.78 1.47 1.52 1.56 1.52 Inner Mongolia11.20 11.69 12.23 11.71 7.73 7.69 7.91 7.78 22.09 21.76 21.79 21.88 Liaoning0.23 0.93 0.43 0.53 6.52 6.42 6.21 6.38 1.97 1.98 2.08 2.01 Jilin0.09 0.10 0.07 0.09 6.79 6.68 6.67 6.71 1.02 1.03 1.05 1.03 Heilongjiang2.59 1.57 2.18 2.11 5.99 5.90 5.89 5.93 3.02 2.89 2.78 2.90 Shanghai0.39 0.18 0.24 0.27 0.02 0.01 0.01 0.01 0.15 0.15 0.12 0.14 Jiangsu1.41 1.48 1.43 1.44 0.53 0.48 0.48 0.50 1.90 1.91 1.87 1.89 Zhejiang0.37 0.36 0.35 0.36 0.18 0.16 0.17 0.17 0.42 0.42 0.40 0.41 Anhui1.76 1.95 1.90 1.87 2.73 2.69 2.60 2.67 3.64 3.68 3.62 3.65 Fujian2.67 2.71 2.60 2.66 0.38 0.39 0.42 0.40 0.50 0.51 0.51 0.51 Jiangxi3.65 3.76 3.82 3.74 1.83 1.89 1.92 1.87 0.27 0.27 0.26 0.27 Shandong0.12 0.16 0.19 0.16 10.12 10.09 9.66 9.98 8.25 8.26 8.41 8.31 Henan0.23 0.20 0.20 0.21 12.14 11.97 11.91 12.01 6.18 6.08 5.93 6.06 Hubei13.09 8.63 12.49 11.40 2.85 3.00 3.18 3.01 2.04 2.01 2.01 2.02 Hunan9.78 10.13 9.64 9.85 2.54 2.70 2.74 2.66 2.57 2.62 2.59 2.59 Guangdong3.02 2.96 2.87 2.95 1.01 1.04 1.02 1.02 0.22 0.22 0.21 0.22 Guangxi1.45 1.72 1.54 1.57 2.10 2.12 2.09 2.10 0.80 0.78 0.75 0.78 Hainan0.02 0.02 0.02 0.02 0.38 0.39 0.38 0.38 0.25 0.27 0.26 0.26 Chongqing3.41 3.30 3.23 3.31 1.07 1.13 1.22 1.14 0.70 0.74 0.79 0.74 Sichuan9.64 9.45 9.23 9.44 4.42 4.62 4.85 4.63 5.99 6.00 5.91 5.97 Guizhou7.40 8.23 7.75 7.79 1.96 2.09 2.13 2.06 0.87 0.86 0.89 0.87 Yunnan8.60 8.31 8.00 8.30 4.82 4.72 4.88 4.81 3.39 3.43 3.41 3.41 Tibet1.16 1.27 1.15 1.19 2.28 2.36 2.32 2.32 2.12 2.11 1.84 2.02 Shaanxi0.83 1.06 1.03 0.97 1.13 1.11 1.12 1.12 1.72 1.72 1.75 1.73 Gansu4.79 4.78 4.61 4.73 2.52 2.55 2.63 2.57 3.97 4.07 4.18 4.07 Qinghai1.67 2.12 1.92 1.90 1.45 1.53 1.54 1.51 2.59 2.57 2.55 2.57 Ningxia3.49 3.89 3.59 3.66 1.19 1.29 1.28 1.25 2.12 2.21 2.22 2.18 Xinjiang2.96 5.01 3.53 3.83 5.47 5.61 5.69 5.59 11.97 12.18 12.52 12.22
Note: The data in the table are calculated based on the data inChinaStatisticalYearbookandChinaRuralStatisticalYearbookfrom 2014 to 2016.
Table 2 Concentration ratio CR8 of green feed, beef cattle and mutton sheep production in China from 2014 to 2016

ItemConcentration ratio CR8201420152016MeanGreen crops74.6266.2267.7769.19Beef cattle63.1162.1462.0962.45Mutton sheep69.2569.1569.4569.29
(ii) Concentration of livestock production of implicit demand. The average concentrations of beef cattle production in the 31 provinces and cities in the past three years were shown in Table 1. The beef cattle production in 23 provinces accounted for more than 1% of China’s total, respectively, and their total accounted for 97.01%. Among them, the scales of green feed production in 15 provinces accounted for 1%-5% of China’s total, and their total accounted for 34.74% of China’s total. The proportion of beef cattle production scale in 7 provinces (Hebei, Inner Mongolia, Liaoning, Jilin, Heilongjiang, Shandong and Xinjiang) to China’s total ranged from 5% to 10%, and their total accounted for 50.26% of China’s total. There was only one province with beef cattle production scale accounting for more than 10% of China’s total (Henan, 12.01%). The beef cattle production concentration ratio CR8 data are shown in Table 3. The beef cattle production scale of the top 8 provinces accounted for 60%-70% of China’s total, indicating that the industrial structure of beef cattle production in China was oligopolistic and the industrial concentration was high.
There were 20 provinces with mutton sheep production scale accounting for more than 1% of China’s total, and their total accounted for 95.16% of China’s total. Among them, there were 14 provinces with proportion ranging from 1%-5%, and their total accounted for 33.59% of China’s total. The mutton sheep production scale of 4 provinces (Hebei, Henan, Shandong and Sichuan) accounted for 5%-10% of China’s total, and their total accounted for 27.47% of China’s total. There were 2 provinces (Inner Mongolia and Xinjiang) of which the mutton sheep production scale accounted for more than 10% of China’s total, and their total accounted for 34.10%. As shown in Table 3, the mutton sheep production in the top 8 provinces accounted for about 70% of China’s total, indicating that the industrial structure of China’s mutton sheep production was also oligopolistic, and the industrial concentration was high, slightly higher than that of green crops.
Table 3 Variances of green feed production in different regions of China from 2014 to 2016
RegionVarianceRegionVarianceBeijing0.00Hubei8.46 Tianjin0.00 Hunan0.29 Hebei0.04 Guangdong0.05 Shanxi0.01 Guangxi0.01 Inner Mongolia0.10 Hainan0.00 Liaoning0.12 Chongqing0.07 Heilongjiang0.40 Guizhou0.06 Shanghai0.02 Yunnan0.55 Jiangsu0.00 Tibet0.01 Zhejiang0.00 Shaanxi0.01 Anhui0.00 Gansu0.11 Fujian0.03 Qinghai0.02 Jiangxi0.02 Ningxia0.03 Shandong0.00 Xinjiang0.90 Henan0.00 Mean0.39
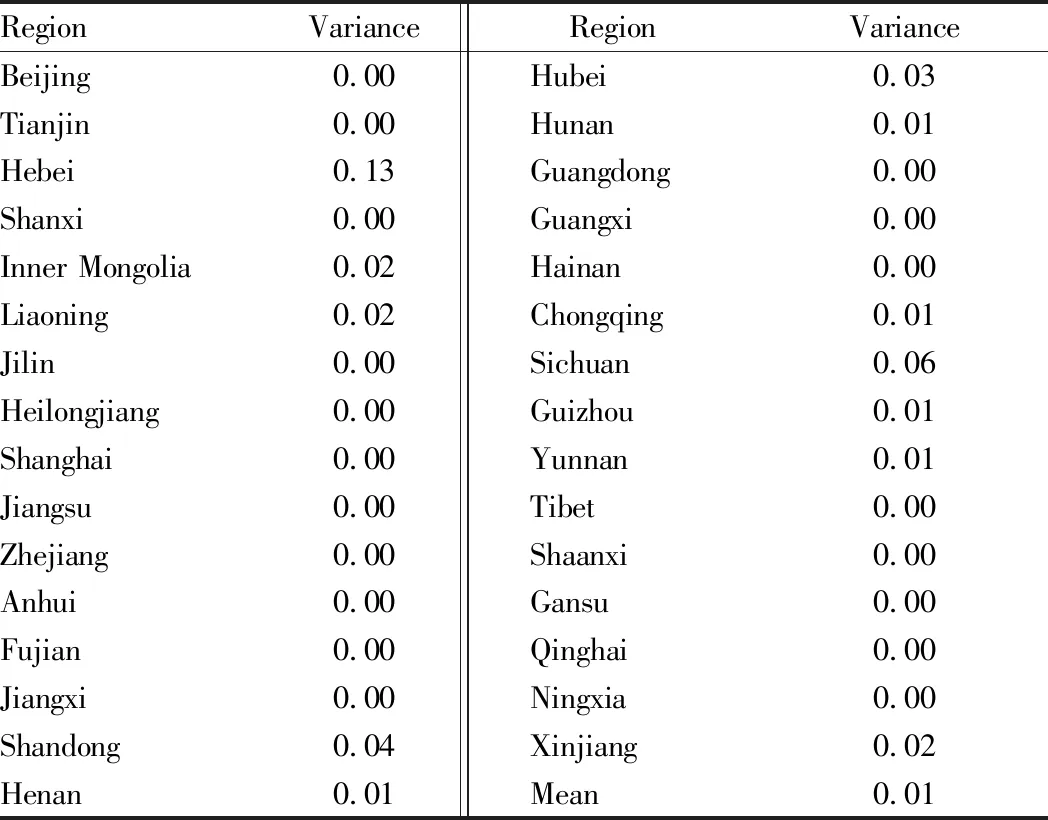
The variance of beef cattle production scale in each region in the past three years is shown in Table 4. From the national point of view, the variation of production scale of beef cattle in 31 provinces was small, and the variance was only 0.01, smaller than that of green crops. From a single province, there were only two provinces with variance greater than 0.05, indicating that beef cattle production in all regions of China was relatively stable. Compared with green crops, the variation was smaller.
Table 4 Variances of beef cattle production in different regions of China from 2014 to 2016
RegionVarianceRegionVarianceBeijing0.00 Hubei0.03 Tianjin0.00 Hunan0.01 Hebei0.13 Guangdong0.00 Shanxi0.00 Guangxi0.00 Inner Mongolia0.02 Hainan0.00 Liaoning0.02 Chongqing0.01 Jilin0.00Sichuan0.06 Heilongjiang0.00 Guizhou0.01 Shanghai0.00 Yunnan0.01 Jiangsu0.00 Tibet0.00Zhejiang0.00 Shaanxi0.00 Anhui0.00 Gansu0.00 Fujian0.00 Qinghai0.00 Jiangxi0.00 Ningxia0.00 Shandong0.04 Xinjiang0.02 Henan0.01 Mean0.01
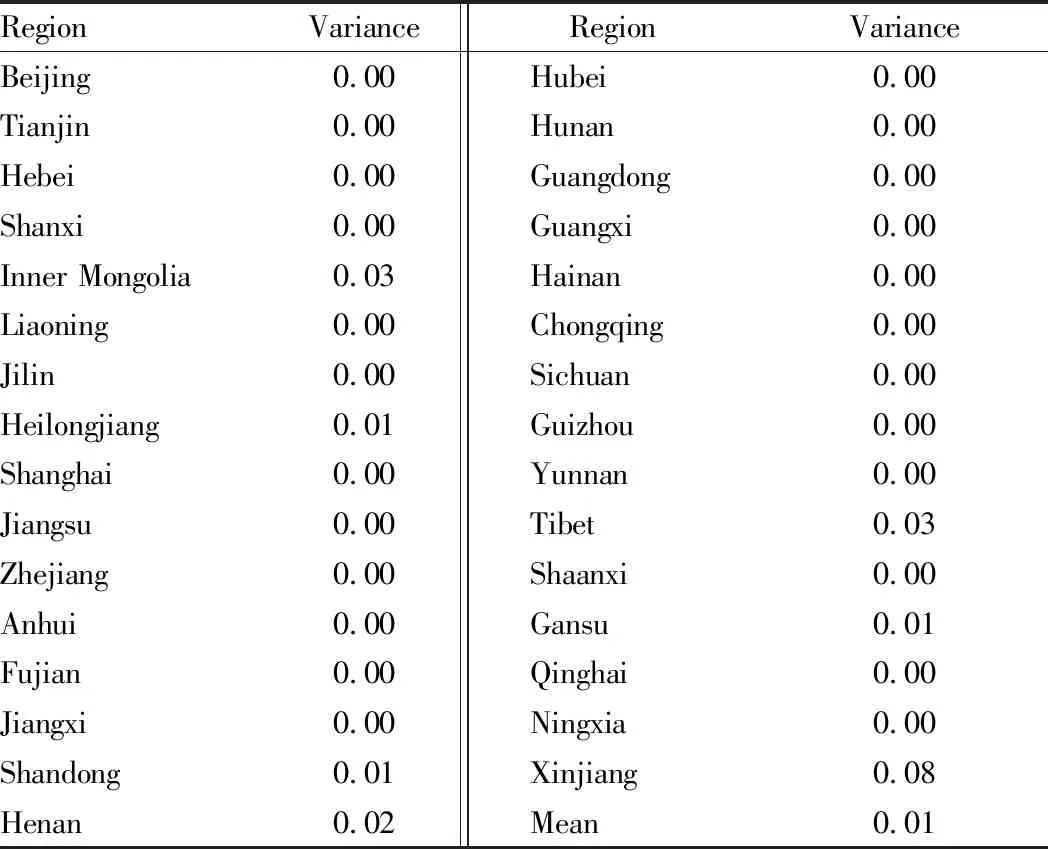
As shown in Table 5, from a national perspective, the variation in production scale of mutton sheep in 31 provinces was very small, and the average variance was only 0.01, close to that of beef cattle and smaller than that of green crops. From a single province, there was only one province of which the variation was slightly higher than 0.05, indicating that the production of mutton sheep in various regions of China was relatively stable. Compared with green crops, the variation was smaller.
Table 5 Variances of mutton sheep production in different regions of China from 2014 to 2016
RegionVarianceRegionVarianceBeijing0.00 Hubei0.00 Tianjin0.00 Hunan0.00 Hebei0.00 Guangdong0.00 Shanxi0.00 Guangxi0.00 Inner Mongolia0.03 Hainan0.00 Liaoning0.00 Chongqing0.00 Jilin0.00 Sichuan0.00 Heilongjiang0.01 Guizhou0.00 Shanghai0.00 Yunnan0.00 Jiangsu0.00 Tibet0.03 Zhejiang0.00 Shaanxi0.00 Anhui0.00 Gansu0.01 Fujian0.00 Qinghai0.00 Jiangxi0.00 Ningxia0.00 Shandong0.01 Xinjiang0.08 Henan0.02 Mean0.01
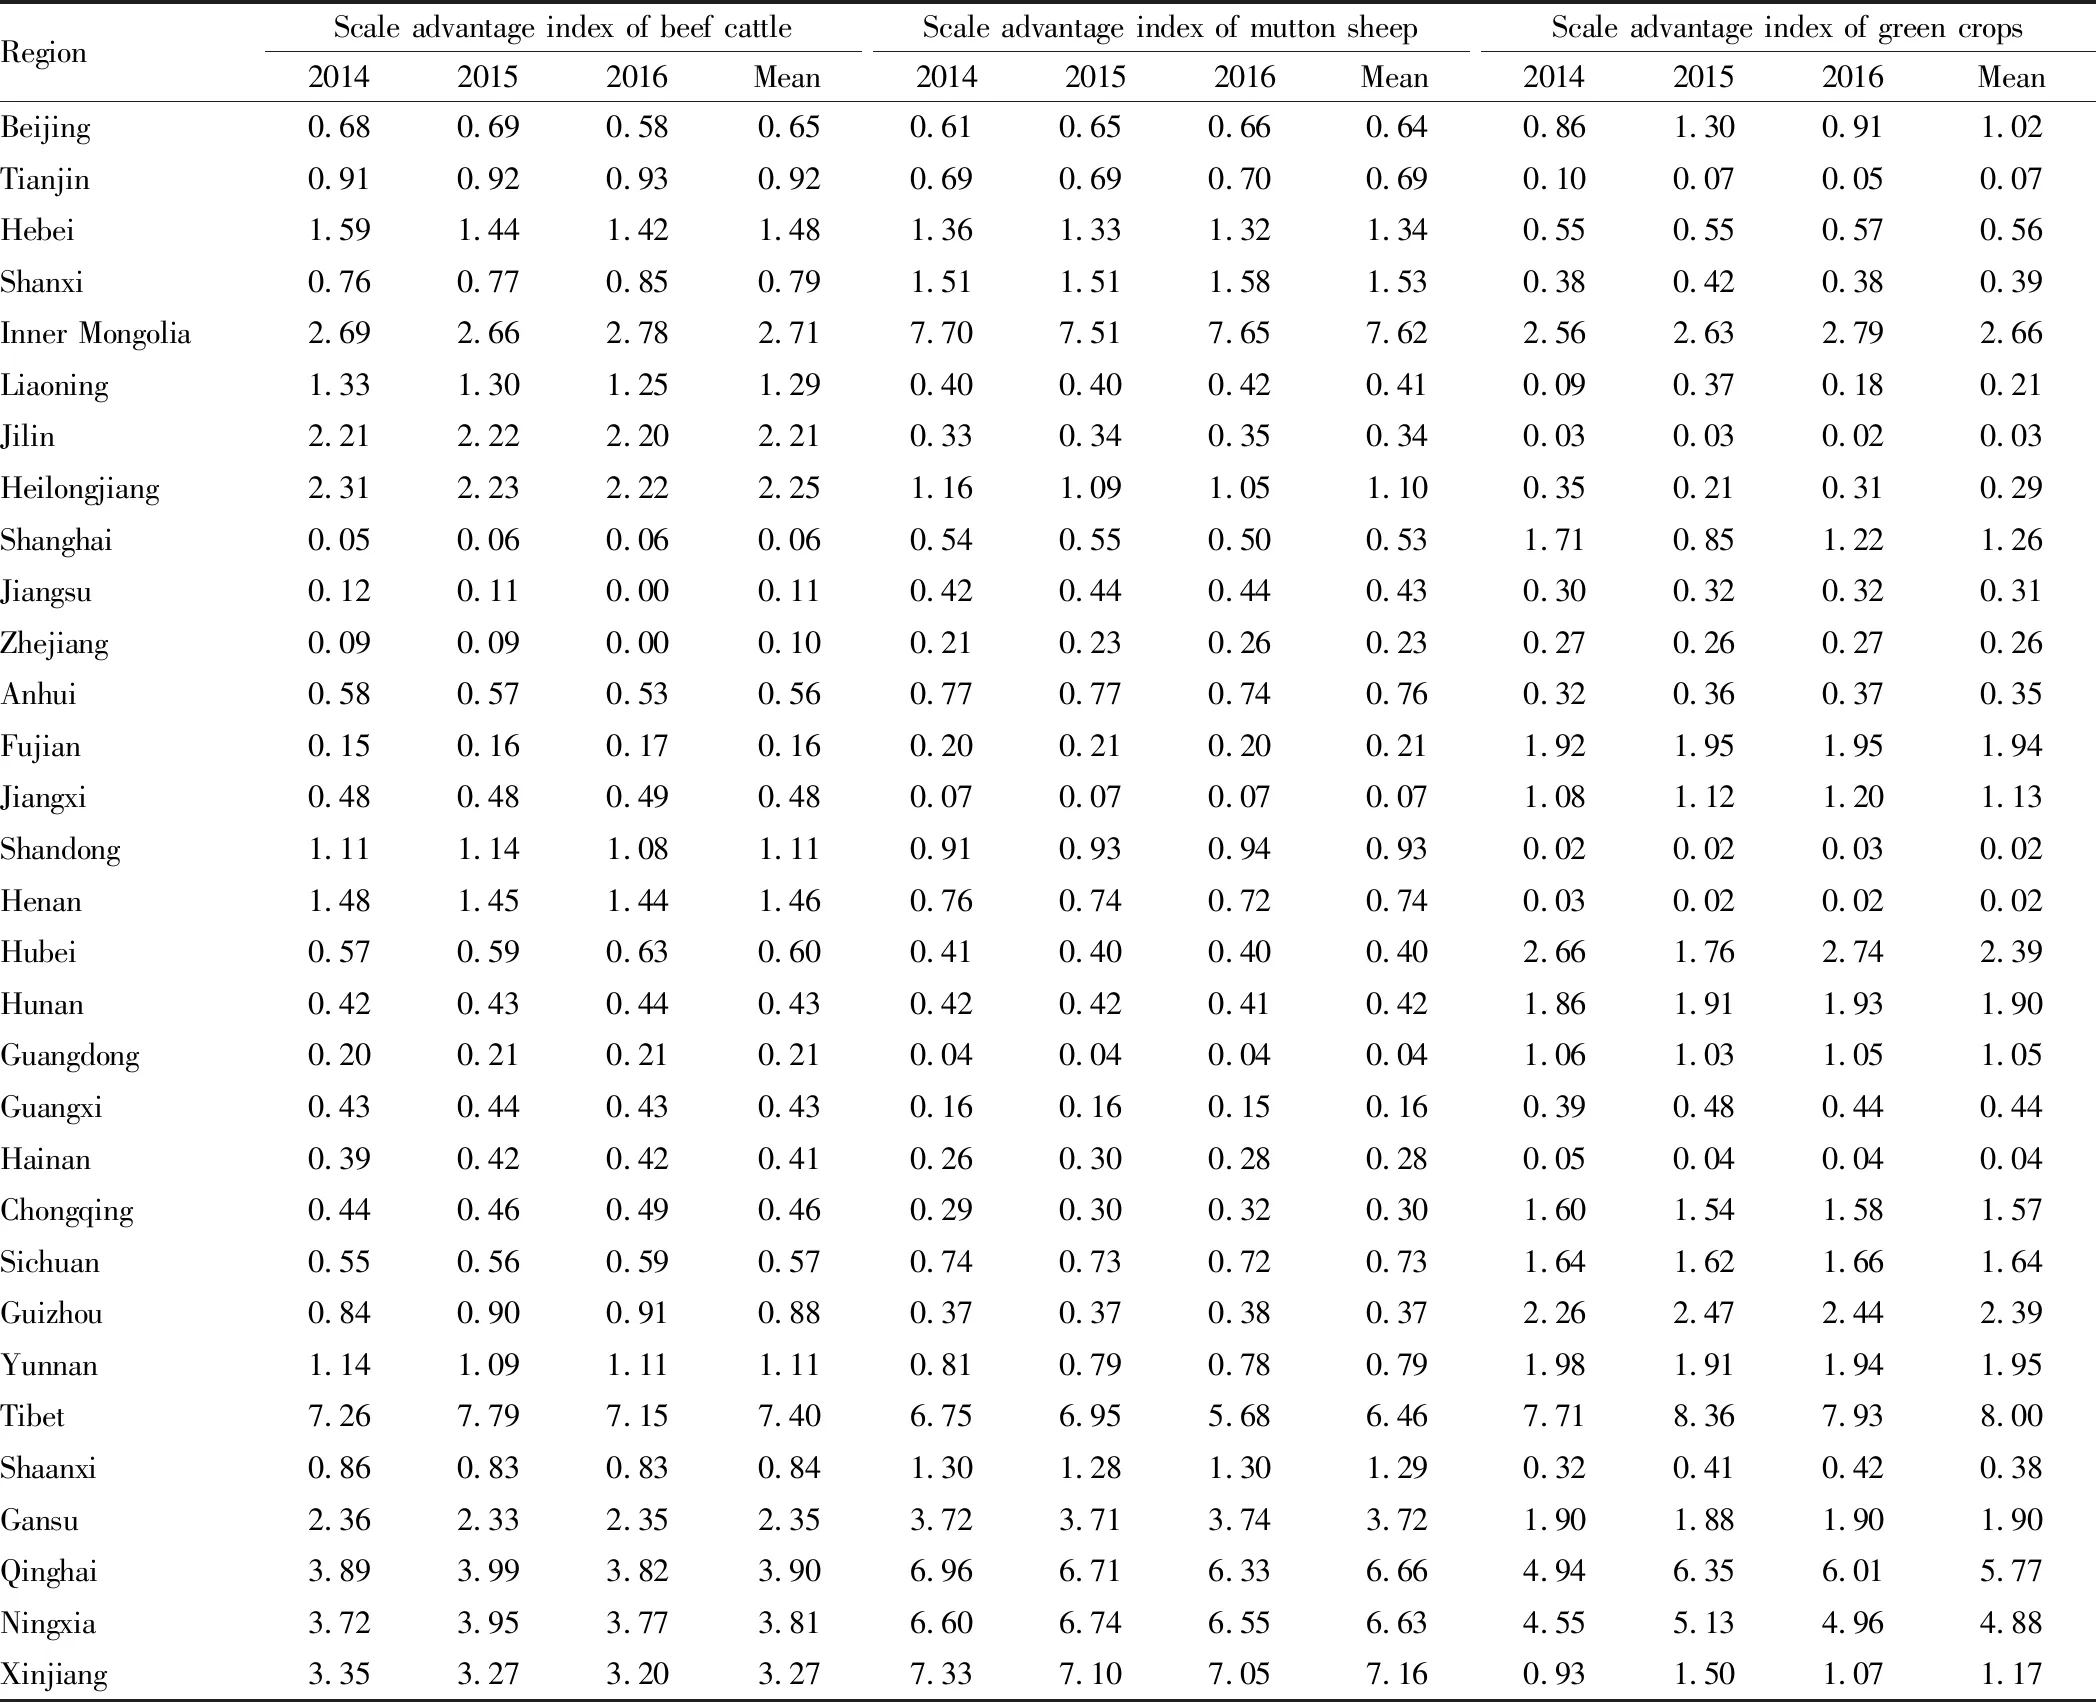
3.1.2Comparative analysis of production scale advantages. As shown in Table 6, there were 13 provinces with scale advantage index greater than 1, mainly distributed in the northeast, northwest and Hebei, Shandong, Henan, Yunnan and Tibet. Among them, 12 provinces had a scale advantage index value between 1 and 5, indicating that these regions have significant scale advantages. Only the scale advantage index of beef cattle production in Tibet was greater than 5, suggesting that the region had a very significant scale advantage. There were 10 provinces with mutton sheep production scale advantages, mainly located in the northwest, northeast (Inner Mongolia and Heilongjiang) and Hebei. Among them, there were 5 provinces with scale advantage index greater than 5, indicating that these regions had very obvious scale advantages. There were more provinces with scale advantages for green feed production. Among them, 17 provinces had a scale advantage index greater than 1. They were widely distributed, in the northwest and south. There were 15 provinces with a scale advantage index between 1 and 5, which had obvious scale advantages. However, only 2 provinces had a scale advantage index greater than 5, with obvious scale advantages.
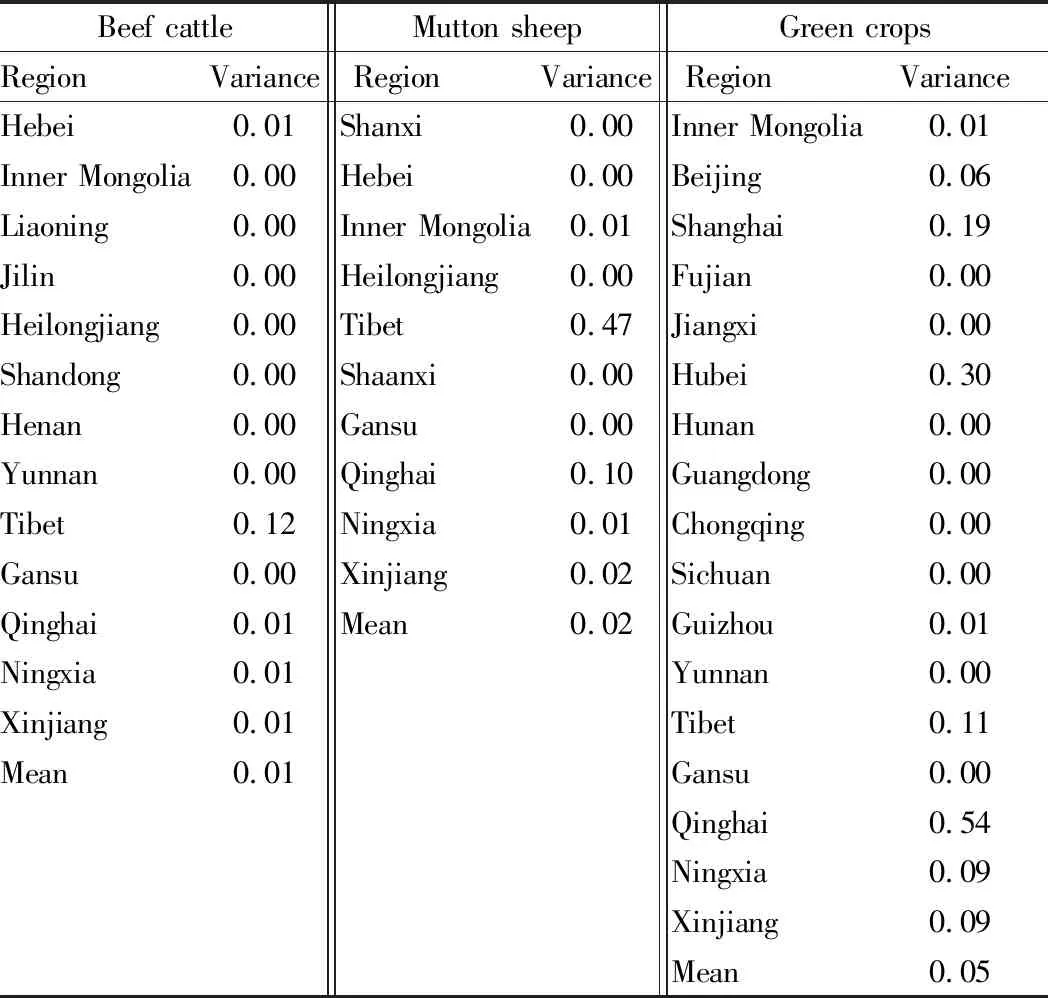
As shown in Table 7, the scale advantages of beef cattle, mutton sheep and green crops production of various provinces were relatively stable in the past three years. Tibet showed a greater fluctuation, and the scale advantages of green feed production in Hubei and Qinghai provinces also changed slightly.
Table 6 Scale advantage index of green feed, beef cattle and mutton sheep production in different regions of China from 2014 to 2016
RegionScale advantage index of beef cattle201420152016MeanScale advantage index of mutton sheep201420152016MeanScale advantage index of green crops201420152016MeanBeijing0.68 0.69 0.58 0.65 0.61 0.65 0.66 0.64 0.86 1.30 0.91 1.02 Tianjin0.91 0.92 0.93 0.92 0.69 0.69 0.70 0.69 0.10 0.07 0.05 0.07 Hebei1.59 1.44 1.42 1.48 1.36 1.33 1.32 1.34 0.55 0.55 0.57 0.56 Shanxi0.76 0.77 0.85 0.79 1.51 1.51 1.58 1.53 0.38 0.42 0.38 0.39 Inner Mongolia2.69 2.66 2.78 2.71 7.70 7.51 7.65 7.62 2.56 2.63 2.79 2.66 Liaoning1.33 1.30 1.25 1.29 0.40 0.40 0.42 0.41 0.09 0.37 0.18 0.21 Jilin2.21 2.22 2.20 2.21 0.33 0.34 0.35 0.34 0.03 0.03 0.02 0.03 Heilongjiang2.31 2.23 2.22 2.25 1.16 1.09 1.05 1.10 0.35 0.21 0.31 0.29 Shanghai0.05 0.06 0.06 0.06 0.54 0.55 0.50 0.53 1.71 0.85 1.22 1.26 Jiangsu0.12 0.11 0.00 0.11 0.42 0.44 0.44 0.43 0.30 0.32 0.32 0.31 Zhejiang0.09 0.09 0.00 0.10 0.21 0.23 0.26 0.23 0.27 0.26 0.27 0.26 Anhui0.58 0.57 0.53 0.56 0.77 0.77 0.74 0.76 0.32 0.36 0.37 0.35 Fujian0.15 0.16 0.17 0.16 0.20 0.21 0.20 0.21 1.92 1.95 1.95 1.94 Jiangxi0.48 0.48 0.49 0.48 0.07 0.07 0.07 0.07 1.08 1.12 1.20 1.13 Shandong1.11 1.14 1.08 1.11 0.91 0.93 0.94 0.93 0.02 0.02 0.03 0.02 Henan1.48 1.45 1.44 1.46 0.76 0.74 0.72 0.74 0.03 0.02 0.02 0.02 Hubei0.57 0.59 0.63 0.60 0.41 0.40 0.40 0.40 2.66 1.76 2.74 2.39 Hunan0.42 0.43 0.44 0.43 0.42 0.42 0.41 0.42 1.86 1.91 1.93 1.90 Guangdong0.20 0.21 0.21 0.21 0.04 0.04 0.04 0.04 1.06 1.03 1.05 1.05 Guangxi0.43 0.44 0.43 0.43 0.16 0.16 0.15 0.16 0.39 0.48 0.44 0.44 Hainan0.39 0.42 0.42 0.41 0.26 0.30 0.28 0.28 0.05 0.04 0.04 0.04 Chongqing0.44 0.46 0.49 0.46 0.29 0.30 0.32 0.30 1.60 1.54 1.58 1.57 Sichuan0.55 0.56 0.59 0.57 0.74 0.73 0.72 0.73 1.64 1.62 1.66 1.64 Guizhou0.84 0.90 0.91 0.88 0.37 0.37 0.38 0.37 2.26 2.47 2.44 2.39 Yunnan1.14 1.09 1.11 1.11 0.81 0.79 0.78 0.79 1.98 1.91 1.94 1.95 Tibet7.26 7.79 7.15 7.40 6.75 6.95 5.68 6.46 7.71 8.36 7.93 8.00 Shaanxi0.86 0.83 0.83 0.84 1.30 1.28 1.30 1.29 0.32 0.41 0.42 0.38 Gansu2.36 2.33 2.35 2.35 3.72 3.71 3.74 3.72 1.90 1.88 1.90 1.90 Qinghai3.89 3.99 3.82 3.90 6.96 6.71 6.33 6.66 4.94 6.35 6.01 5.77 Ningxia3.72 3.95 3.77 3.81 6.60 6.74 6.55 6.63 4.55 5.13 4.96 4.88 Xinjiang3.35 3.27 3.20 3.27 7.33 7.10 7.05 7.16 0.93 1.50 1.07 1.17
Note: The data in the table are calculated based on the data inChinaStatisticalYearbookandChinaRuralStatisticalYearbookfrom 2014 to 2016.
3.2 Regional layout division based on comparative advantages of explicit supply and implicit demandThrough the comparative analysis of the explicit supply and implicit demand indicators of the regional advantages of green crops, beef cattle and mutton sheep production, the 31 provinces (cities, districts) across China could be divided into four types.
3.2.1Type of regions with fully matched comparative advantages. The regions of this type had both green crops production advantages and beef cattle or mutton sheep production advantages, including Inner Mongolia, Yunnan, Gansu, Qinghai, Ningxia, Tibet and Xinjiang. They had comparative advantages in all the production of green crops, beef cattle and mutton sheep, excepting Yunnan with scale comparative advantage for green crops and beef cattle production.
3.2.2Type of regions with more obvious comparative advantages for implicit demand. The regions of this type were characterized by the lack of significant comparative advantages in the scale of green feed production. However, they had significant comparative advantages in the production of beef cattle or mutton sheep. They could be subdivided into two categories, one with beef cattle production scale comparative advantages, mainly including Hebei, Liaoning, Jilin, Heilongjiang, Shandong and Henan, and the other with mutton sheep production scale comparative advantages, mainly including Shanxi, Hebei, Heilongjiang and Shaanxi.
3.2.3Type of regions with more obvious comparative advantages for explicit supply. The regions of this type had only scale comparative advantages for green feed production, and they had no obvious scale advantages in the production of beef cattle or mutton sheep, mainly including Beijing, Shanghai, Fujian, Jiangxi, Hubei, Hunan, Guangdong, Chongqing, Sichuan and Guizhou.
3.2.4Type of regions without comparative advantages. The regions of this type had scale comparative advantages neither in green feed production nor in mutton sheep or beef cattle production, mainly including Tianjin, Jiangsu, Zhejiang, Anhui, Guangxi and Hainan.
Table 7 Variances of scale advantages of beef cattle, mutton sheep and green feed production in main regions of China from 2014 to 2016
Beef cattleRegionVarianceMutton sheepRegionVarianceGreen cropsRegionVarianceHebei0.01Shanxi0.00Inner Mongolia0.01Inner Mongolia0.00Hebei0.00Beijing0.06Liaoning0.00Inner Mongolia0.01Shanghai0.19Jilin0.00Heilongjiang0.00Fujian0.00Heilongjiang0.00Tibet0.47Jiangxi0.00Shandong0.00Shaanxi0.00Hubei0.30Henan0.00Gansu0.00Hunan0.00Yunnan0.00Qinghai0.10Guangdong0.00Tibet0.12Ningxia0.01Chongqing0.00Gansu0.00Xinjiang0.02Sichuan0.00Qinghai0.01Mean0.02Guizhou0.01Ningxia0.01Yunnan0.00Xinjiang0.01Tibet0.11Mean0.01Gansu0.00Qinghai0.54Ningxia0.09Xinjiang 0.09Mean0.05
4 Analysis of the reasons for the formation of green feed production layout
4.1 Constraints of natural resources such as climate and soil
As a natural reproduction process, green crops must first be constrained by natural resource conditions, such as sorghum and green corn. Sorghum, known as the "king of the pasture", is resistant to drought and heat and cold. It has high yield and high quality, and is popular among all kinds of livestock and poultry. The number of harvestables and the total yield per growing season are mainly determined by the length of the growing season, the adaptability to the soil, whether the sunlight is sufficient, especially the amount and distribution of precipitation and irrigation during the growing season. Green corn is the most widely used green feed in the world and is the king of feed. China has a superior geographical position, with a long span from north to south, and most climate zones are suitable for corn planting, such as the Northeast Plain, the Huanghuaihai Plain, and the southwestern region of South China.
4.2 Regional differences in the development level of non-agricultural industriesThere are significant differences in the opportunity costs of production factors such as capital, land and labor in the regions with different development levels of non-agricultural industries. In the regions with high development level of non-agricultural industries, the opportunity costs of capital, land and labor for green feed production are gradually increasing[11]. Although green feed is more economically efficient than other crops, its economic benefit is lower than non-agricultural industries. Therefore, in regions with high levels of development in non-agricultural industries, resources such as capital and land used for green feed production are bound to be squeezed. In areas with high levels of development of non-agricultural industries, when faced with more non-agricultural employment opportunities, farmers will also choose to engage in non-agricultural industries, and reduce and even give up the planting of green crops. Thus, the space for further development of green feed production is limited. Therefore, in the regions with imbalanced economic and social development, the opportunity cost of capital and land for green feed production is different, the non-agricultural employment opportunities faced by farmers are also different, and their green feeding capacity also vary.
4.3 Government’s industrial policiesIn order to meet the needs of agricultural "transfering mode and adjusting structure" and promote the sustainable and healthy development of herbivorous animal husbandry, the Ministry of Agriculture of People’s Republic of China has actively promoted the supply-side structural reform of agriculture. In 2015, the Ministry of Agriculture selected 30 counties in 10 provinces (Heilongjiang, Jilin, Hebei, Gansu, Shaanxi, Qinghai, Ningxia, Shanxi, Inner Mongolia and Liaoning) to carry out pilot projects. With a focus on whole silage corn, 190 000 ha of land originally planted with grain crops was planted with silage, and 9.95 million t of high-quality forage was harvested, achieving a win-win situation of planting and breeding[12]. In 2016, the scope of "grain-to-feed" pilot was expanded to 17 provinces in the "Shovel Bend" area and the Huanghuaihai corn producing area, with a scale of 400 000 ha[13]. In 2017, the Ministry of Agriculture formulated theWorkPlanfortheImplementationofGrain-to-feed, which clarified the working principles of "demand-oriented, production and marketing docking, tailoring according to local conditions, classification guidance, combination of farming and breeding and moderate scale". The area of land for grain to feed reaches 670 000 ha, and more than 30 million t of high-quality forage is harvested. By 2020, the planting area of high-quality forage in China will grow to over 1.67 million ha, further promoting the development of the green feed industry.
4.4 Production technology levelFrom a technical point of view, taking green corn as an example, the harvest of green crops has high requirements for agricultural machinery and equipment, and the treatment of silage also requires a high level of technology. When the silage crop is harvested, the grain is harvested together with the straw, so large-scale agricultural machinery with kneading function must be required, which is expensive, generally around 160 000 US dollars. Ordinary farmers simply don’t have enough funds, and this must be solved through a professional social service organization. In addition, green crops need to be fermented after harvesting. The technical difficulty of this link is currently high. Improper operation can lead to fermentation failure, material waste and economic loss.
4.5 Financial subsidy policiesFrom the perspective of financial subsidies, the intensity and methods of subsidies cannot meet the needs of regional development. In 2015, the national finance gave each pilot county an average annual subsidy of about 1.6 million US dollars, and the implementation cycle was 3 years. In terms of subsidy standards, there were great differences in the subsidy standards for acquisition and storage in various pilot districts and counties. Due to the difference scale of farming in each county, the forage subsidies in some places were about 3.5 US dollars/t, while in some others were about 7.9 US dollars/t, which would also lead farmers to misunderstand the policy.
4.6 Farmers’ willingness to grow green cropsFrom the perspective of technical propaganda and promotion, the acceptance of farmers is a major difficulty. On this tissue, the government can only guide and respect the wishes of the peasants. In actual promotion, there is often the problem of farmers’ approval. On the one hand, farmers are reluctant to adjust the land to grow green crops due to the influence of traditional planting concepts. On the other hand, there are subsidies and benefits for growing grain, and the benefits of green crops cannot be immediately achieved after the planting.
5 Conclusions and suggestions
5.1 ConclusionsBy further measuring and analyzing the production concentration and scale comparative advantage index of explicit supply and implicit demand in each province, it was found that: (i) the green feed production of explicit supply in China is relatively concentrated and stable, and the dominant areas account for a large proportion; (ii) The production of beef cattle and mutton sheep as an implicit demand for the consumption of green feed terminal, is relatively concentrated and stable. (iii) The 31 provinces (cities, districts) across China can be divided into four types: the type of regions with fully matched comparative advantages, the type of regions with more obvious comparative advantages for implicit demand, the type of regions with more obvious comparative advantages for explicit supply and the type of regions without comparative advantages. (iv) There are fewer regions with matched comparative advantages for explicit supply and implicit demand, which will affect the construction and coordinated development of the grain crop-cash crop-forage ternary planting structure in the agricultural supply-side reform.
5.2 SuggestionsOn the basis of grasping the layout of China’s green feed, beef cattle and mutton sheep production, different development strategies should be taken for different regions according to their comparative advantages and specific conditions. (i) For regions with more significant green feed production advantages and beef cattle or mutton sheep production advantages, the development of animal husbandry should be consolidated and strengthened, and the professionalization and scale of the production of herbivorous livestock such as green crops, beef cattle and mutton sheep should be actively improved to provide a solid foundation for local economic development[14]. (ii) For regions without significant scale comparative advantages for green feed production but with significant scale comparative advantages for beef cattle or mutton sheep production, it should be suitable to develop green forage crops suitable for beef cattle or mutton sheep, adhere to leading farming with breeding, farming for breeding and determining planting according to breeding, reasonably determine the varieties of green crops, accord to local conditions, rationally change the planted crops, and scientifically select the varieties. (iii) For regions with significant scale comparative advantages for green feed production but without significant scale comparative advantages for beef cattle or mutton sheep production, the government should be strengthened to participate in the guidance and actively support the development of local leading livestock enterprises, increase investment and attract investment to improve the overall level of local animal husbandry. (iv) For regions without significant scale comparative advantages for green feed, beef cattle or mutton sheep production, market circulation and coordination should be done well. In addition, in regions where conditions are advantageous, attention should be paid to the following aspects in the development of the herbivorous livestock industry. First, it must accelerate the integrated development of breeding research and development, production and promotion of high-quality green crops, cultivate excellent varieties with strong adaptability, organize regional trials of new varieties, improve the evaluation system of new varieties, and promote the development of processing equipment for green crops that adapt to different regional characteristics and different production scales. At the same time, it is necessary to strengthen feed treatment and utilization, carry out high-efficiency production and use demonstration of green crops, and promote the application of silage, yellow storage and micro-storage technologies[15]. Second, it must active use the financial funds to do a good job in breeding, production and technology promotion of green crops, and the subsidy object is tilted to the main production area and the new business entity. On the one hand, it must continue to implement the reward policy for cattle and sheep to transfer the county, carry out pilot construction of green crop development trials and strengthen typical demonstration guidance to promote the development of industrialization. On the other hand, it is necessary to further promote financial funds to stimulate financial capital to support green feed as a pilot for large-scale planting and explore ways such as credit guarantees, interest subsidies and subsidies to guide financial capital to support the development. At the same time, it must expand financing channels and encourage financial institutions such as banks and insurance companies to promote the solution to the problems of large-scale growers and livestock enterprises. It must also pay attention to the continuous strengthening of the management of support funds, and at the same time establish and improve the supervision and evaluation system to make sure that the support funds are used well and that the effects they deserve are effectively exerted. Third, it must mobilize the enthusiasm of farmers to develop green crops, support farmers (households) to actively develop silage products, and strengthen technical guidance and combination of planting and breeding to drive the planting of green crops. Fourth, it must cultivate and develop forage production service organizations, and support a number of large-scale planting, processing, sales and logistics enterprises for green crops to promote the development of the industry. At the same time, it must actively promote the pilot work of green crops, vigorously develop a variety of planting-breeding combination modes such as "aquaculture enterprise+large planter", "aquaculture enterprise+planting cooperative" and "aquaculture enterprise+self-owned planting base", encourage local governments to build a comprehensive platform for regional grassland animal husbandry socialization services, accelerate the development of various forms of productive service organizations, and cross-regionally provide specialized production, processing and distribution services for green crops[16].
杂志排行
Asian Agricultural Research的其它文章
- Delimitation and Zoning of Natural Ecological Spatial Boundary Based on GIS
- Career Planning Education Paths for Students of Aquatic Animal Medicine Discipline in the Context of the Belt and Road Initiative: A Case Study of Construction Achievement of Guangdong Ocean University
- Pilot-scale Study on NCMBR Process for Upgrading of Sewage Treatment Plant in Industrial Park
- Preliminary Exploration on Design of Green Landscape of Urban Streets: A Case Study of Guangchang East Road in Xihu District of Nanchang City
- Present Situation and Renovation Strategies of Farmhouses in Yingxi Village, Fuliang County, Jingdezhen
- Influence of Sino-US Agricultural Trade on China’s Total Agricultural Output Value Based on Cointegration Model
