LRV:A Tool for Academic Text Visualization to Support the Literature Review Process
2019-06-12TahaniAlmutairiandMahaAlyahya
Tahani Almutairi and Maha Al-yahya
Abstract:Text visualization is concerned with the representation of text in a graphical form to facilitate comprehension of large textual data.Its aim is to improve the ability to understand and utilize the wealth of text-based information available.An essential task in any scientific research is the study and review of previous works in the specified domain,a process that is referred to as the literature survey process.This process involves the identification of prior work and evaluating its relevance to the research question.With the enormous number of published studies available online in digital form,this becomes a cumbersome task for the researcher.This paper presents the design and implementation of a tool that aims to facilitate this process by identifying relevant work and suggesting clusters of articles by conceptual modeling,thus providing different options that enable the researcher to visualize a large number of articles in a graphical easy-to-analyze form.The tool helps the researcher in analyzing and synthesizing the literature and building a conceptual understanding of the designated research area.The evaluation of the tool shows that researchers have found it useful and that it supported the process of relevant work analysis given a specific research question,and 70% of the evaluators of the tool found it very useful.
Keywords:Text visualization,information extraction,text mining,literature review.
1 Introduction
The literature review is an essential process in any research study.It “demonstrates a familiarity with a body of knowledge and establishes the credibility of work;summarizes prior research and indicates how it is related to other work in the field;integrates and summarizes what is known about a subject.” [Royal Literary (2015)].With the availability of an enormous amount of research studies published online,the literature review task becomes difficult and time-consuming.One of the main problems that face the researcher when doing a literature review is the difficulty in discriminating between relevant and irrelevant papers to the research question.In addition,the researcher needs to read,understand,and analyze a large collection of papers to gain comprehensive knowledge about the research domain.
Text visualization is a technology for representing textual data in a graphical form [Lu and Gang (2011)].Text visualization aims to improve our ability to understand and utilize the wealth of text-based information available to us [John,Shawn,Steve et al.(2014)].Moreover,text visualization provides a better way to present text,which can help in coping with information overload [Paranyushkin (2011)].It can be utilized to facilitate the analysis of the huge amount of textual information such as collections of research articles.
In this paper,we present the design of the LRV (Literature Review Visualization)tool that supports the researcher during the literature review task by providing different visualizations for the literature collected.These visualizations enable the researcher to visualize a large number of articles in graphical form.The tool helps the researcher in analyzing and synthesizing the literature and building a conceptual understanding of the designated research area.So,it aims to help the researcher by facilitating the literature review process and providing text visualization for academic research papers by showing the conceptual content of these research papers in a graphical form based on his/her research question.
The rest of this paper is organized as follows:Section 2 presents the background,Section 3 presents related work on text visualization tools,Section 4 describes the research problem,Section 5 presents the research methodology,Section 6 describes the design of the tool and the experiment,Section 7 presents the results and evaluation,and finally,Section 8 presents the conclusion and future work.
2 Background
The LRV tool fits in the intersection of the scientific discipline areas of text visualization and data and text mining.
2.1 Text visualization
Text visualization is a method for showing the specific text as a graph using technology [Kim and Jin (2011)].Text visualization involves the analysis of textual data to understand the key information from the text.Then,it formulates the information and relations between data in intuitive forms to allow easy processing of the data by the user [Jiawei,Micheline and Jian (2012)].
The text visualization process is composed of three phases.First,the text is processed in a representative way to make it more suitable for subsequent operations.The second step is mapping the text onto a 2D or 3D space to draw a view.The third step is to enable user interaction [Artur and Bojana (2010)].
A text visualization functional element is composed of four key components:Tokenization,Vector space modeling,Specialization,and Labeling.
Tokenization is the component that splits a string into identifiable linguistic units to characterize the lexical content of text units through extraction,normalization,and selection of key terms [John,Shawn,Steve et al.(2014);Steven,Ewan and Edward (2009)].
Vector space modeling is a space modeling component that produces a computationally tractable vector space representation of a collection of text segments [Steven,Ewan and Edward (2009)].
Specialization is the component that uses the previous component outcomes to generate a 2D or 3D spatial arrangement that places the points representing conceptually similar text units in near spatial proximity [Steven,Ewan and Edward (2009)].
Labeling is the component that assigns special text labels to various areas of the semantic map [Steven,Ewan and Edward (2009)].
2.2 Data mining
Data mining is the process of selecting,exploring,and modeling large amounts of data to extract the interesting (nontrivial,implicit,previously unknown,and potentially useful)patterns or knowledge which provide a clear and useful result to the data analyst [Jiawei,Micheline and Jian (2012)].One of the famous types of mining is text mining,which refers to the process of deriving high-quality information from text [Dell (2015)].
Text mining refers to the process of deriving high-quality information from text.Moreover,it usually involves the process of structuring the input text [Jiawei,Micheline and Jian (2012)].The famous algorithm used is the vector space model.
The VMS is an algebraic model for representing text documents,and it represents the documents as concept vectors and each concept defines one dimension.Moreover,the distance between these vectors is expressed as the relationship between the documents (similarity).So,it is used to cluster the documents based on similarity [Michael (1996)].
The vector space model (VSM)converts and transforms the raw documents to numerical vectors by representing each document as a vector with one real-valued component,usually a tf-idf weight for each term [Xiong,Shen,Wang et al.(2018)].The VSM has three phases:first,the document is indexed,that means the content bearing terms are extracted from the document text.The second phase is weighting the indexed terms to enhance retrieval of documents relevant to the user.The last phase ranks the document with respect to the query according to a similarity measure [Nandni and Santosh (2017)].
3 Related work
There are several tools available for text visualization.The ReVis tool is designed to help the researcher identify and make a decision whether to include or exclude the studies in the systematic literature review (SLR).It uses text mining to support the selection stages in the SLR process,it uses content-based analysis of documents and metadata analysis.It enables the users to investigate content similarity relationships among pairs of data points [Katia,Elisa,Stephen et al.(2014)].
Another tool is the START tool,which can be used by the researcher in all stages of the process of an SLR.This tool enables the researcher to enter his/her keywords and upload the BibTex file.Then,these files will be ordered and scored according to the entered keywords.The decision should be made after reading the title,abstract,and keywords of the study.Finally,it summarizes the documents,then it generates charts that support a quantitative SR characterization [Fabbri,Hernandes,Thommazo et al.(2012)].
In another study [Wang,Liu,Qu et al.(2016)],the authors designed a web-based application to help the researcher to read the academic papers,specifically the related work section,by presenting the literature review section as interactive slides using narrative visualization.It was designed to display the result into two logics:author-based logic and citation-oriented logic.In addition,it displayed the result to three levels.It used text mining and the term frequency-inverse document frequency (TF-IDF)method to process the text.It extracted the citations and authors,then searched in Google Scholar to find the answer for these questions:how many cited,the year,also to specify the authors’ opinion of this citation by calculating the sentiment of each sentence,i.e.,positive,negative,or neutral,using the sentiment analysis.
Within the research domain,the Stanford Dissertation Browser is a visualization tool that was used to identify influences and convergent lines of research across disciplines by detecting shared language used within university-wide publications.It used a publication of Ph.D.theses from Stanford University as a data source.It visualized theses based on textual similarity (word similarity and topic similarity)to process and analyze the text.It presented and visualized the result as landscaped views [Jason,Daniel,Christopher et al.(2012)].
Many techniques are available to visualize the text but based on the literature review these techniques mainly focus on visualizing general documents,books,news,events,and streaming text from Twitter (social media).To our knowledge,no prior studies exist to visualize academic research papers to support the literature review process with different visualization options and processes all the content of the paper,especially the paper’s body.Therefore,the main contribution of this paper is to provide a tool that focuses on the analysis and visualization of research papers by processing the content of a paper based on a user-provided research question.
4 The research problem
Text visualization provides new ways to present text in the form of graphical representations,which can reduce information overload and improve its quality [Paranyushkin (2011)].Because researchers are faced with a large number of published research studies to read and review,using text visualization can help the researcher and facilitate the literature review process.
In scientific research,the aim of the literature review is to provide a comprehensive understanding of the field of study.It is a required part in any research work,as it provides a context for the research,justifies the research,shows where the research fits into the existing body of knowledge,and enables the researcher to learn from previous theory on the subject [The writing center (2015)].With the availability of the enormous number of research studies published online,the literature review task becomes difficult and time-consuming.One of the main problems that face the researcher when doing a literature review is the difficulty in discriminating between relevant and irrelevant papers to the research question [The university of Queensland (2015)].In addition,the researcher needs to read more papers to acquire comprehensive knowledge about the domain.The aim of this study is to investigate if text visualization can support and enhance the literature review process.
5 Methodology
The methodology we adopted consisted of four steps:(1)Extract the characteristics of research papers to determine the appropriate method to cluster the papers and visualize the results.(2)Choose a suitable text visualization technology and method to cluster the papers.(3)Design and develop the LRV tool for article visualizations.(4)Evaluate the developed system.
5.1 The LRV tool
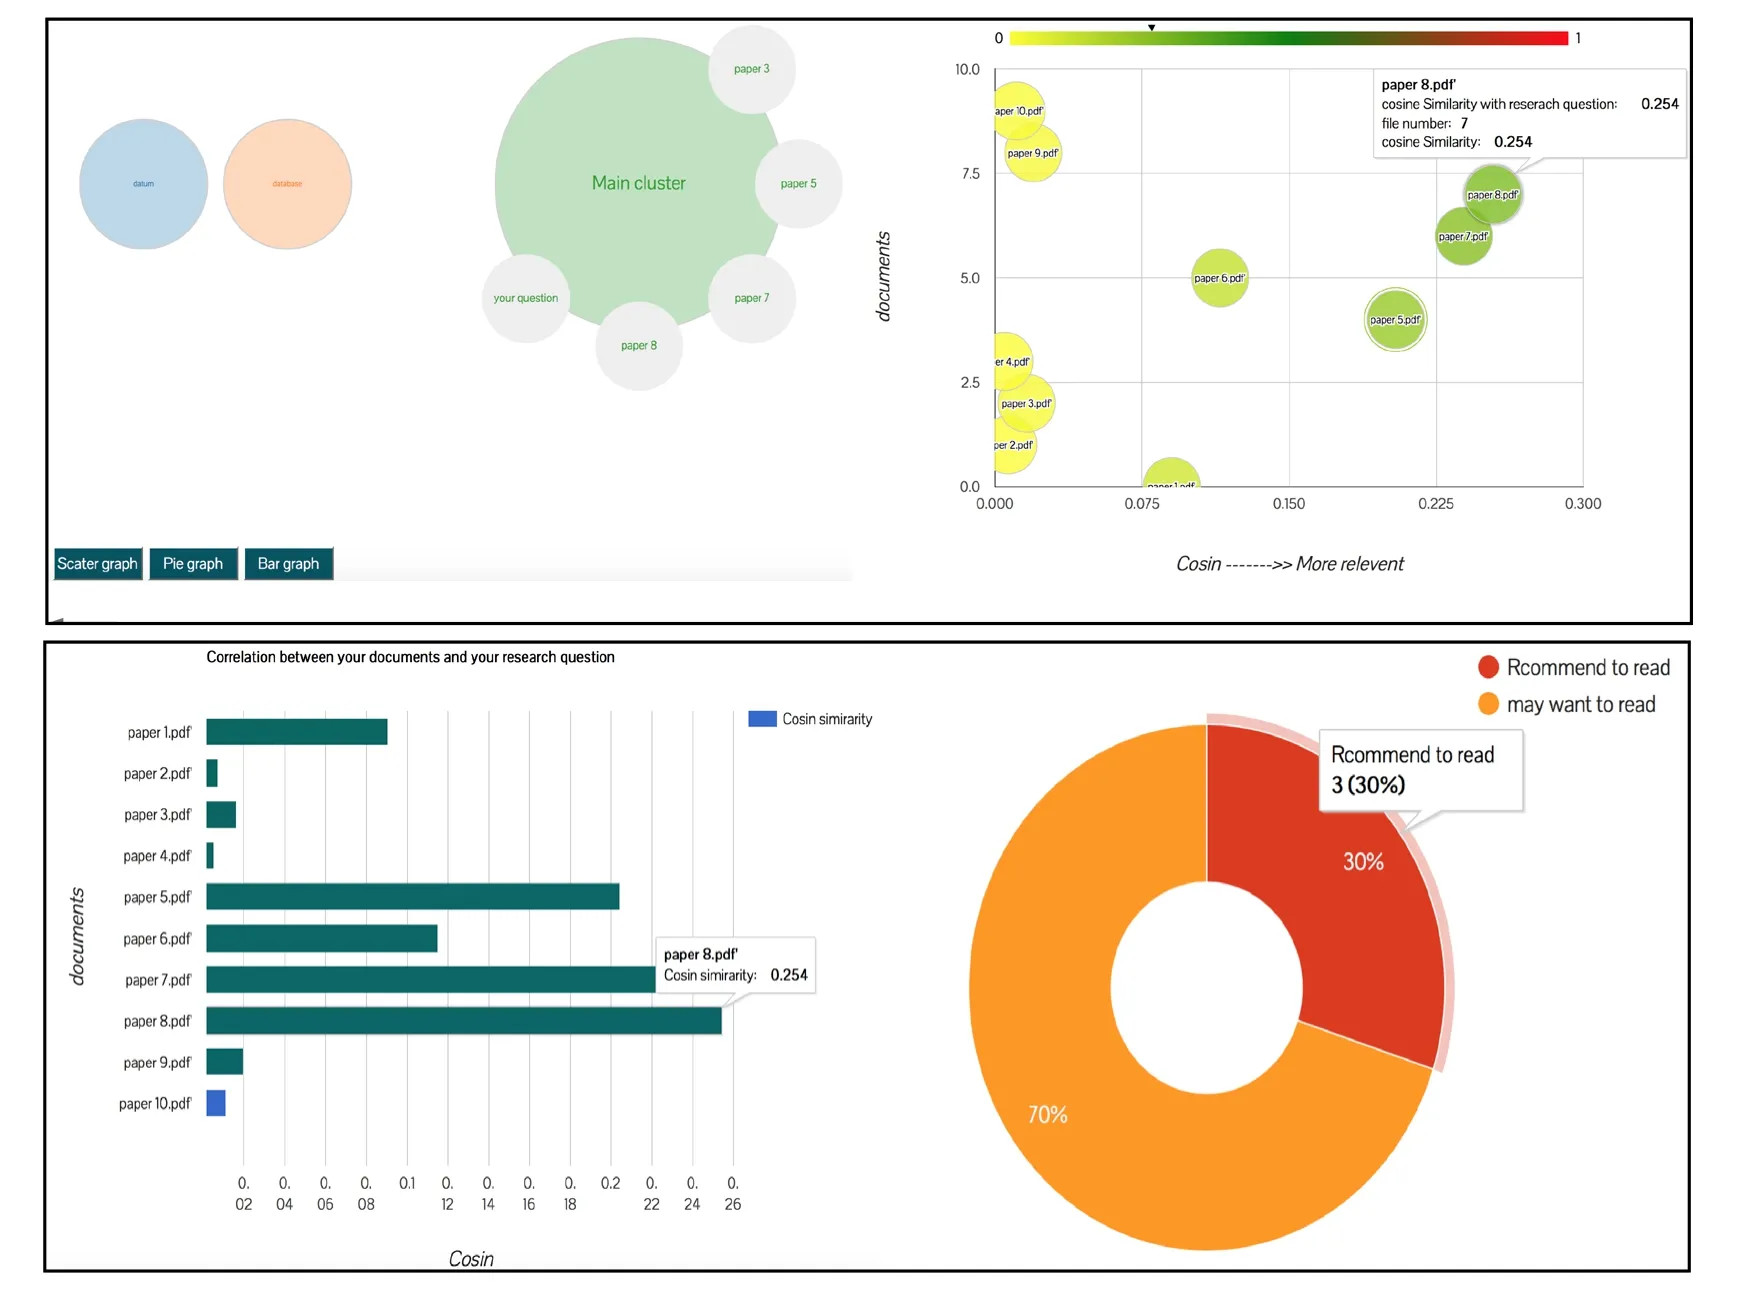
The LRV tool is designed as a web-based application.Researchers can upload the collection of articles and the research question,research objective,or keywords for the topic of the research.Then,the tool suggests a clustering of the articles by conceptual modeling and provides different options that enable the researcher to visualize a large collection of articles in different graphical forms.The LRV tool performs three main tasks to provide the visualizations:(1)text analysis,(2)information extraction,and (3)text mining the tool also provides several visualization options,namely:cluster,bubble,bar,and pie visualizations.Fig.1 shows the general architecture of the system.

Figure 1:LRV tool
The LRV tool focuses on the analysis of raw data to convert it into useful and meaningful data that can be used for graphical visualizations.
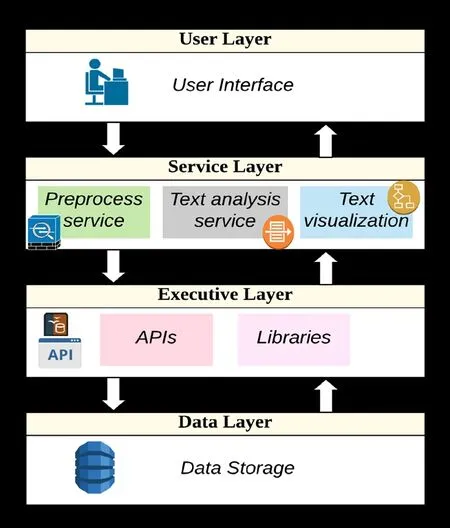
The design of the LRV tool is based on a layered architecture (Fig.2).The LRV tool contains a user interactive interface,which is the first layer in the structure.Moreover,this layer communicates with a second layer,which contains the service that is provided through the LRV.The third layer contains APIs and libraries and is called the executive layer.The final layer is the system database layer.The main layer is the service layer,which contains the preprocess service,text analysis service,and text visualization service.
The preprocess service is used to clean and process the documents through the removal of the stop words,the removal of figures and tables,and the removal of numbers,the lemmatization of the words,and finally tokenization.
The text analysis service contains two core functions:information extraction and text processing.Text mining is a part of the text process function,and it uses the vector space model and k-mean with cosine similarity to cluster the documents.More details on this process are presented in Section 6.
The text visualization service provides the functionality for visualization of the results using available APIs.

Figure 2:LRV architecture
6 Text analysis and visualization
The text analysis and visualization services come after the preprocessing service.They are based on two core technologies:Information Extraction (IE)and Text Mining.IE is concerned with analyzing natural language to extract useful information [Cunningham (2006)].In the LRV tool,it is used to extract relevant information from research papers to support the visualization service.It extracts important data such as the date,title,and main topics from the article abstract and article body.
After the information extraction step,the tool mines the text.Text mining is the process of analyzing large collections of text to generate new information [Visa (2001)].It is used to cluster research papers into conceptual clusters to support the visualization service.It uses the vector space model and k-means to cluster the documents (texts).First,it converts all documents to vectors using a term-document matrix in which the columns represent the topics and the rows represent the document.The LRV tool considers the research question as an instance similar to the document.The tool then calculates the term frequency-inverse document frequency (TF-IDF)for all instances.In this step,the tool adds weight for each topic that appears in the abstract and title by adding an extra percentage based on the occurrence of these topics in the abstract and title.For example,if the word appears in the abstract 10 times,the tool adds for term frequency 10% as weight.On the other hand,it calculates the TF-IDF for the research question instance in a different way;if the topic appears in a research question put one while if it does not appear put zero.Then,the tool clusters the documents using the WEKA tool.Finally,it calculates the cosine similarity.
The visualization service uses the data resulting from information extraction and text mining to build the visual graph.The Google APIs and d3 APIs were used to generate the required visualizations (see Fig.3).

Figure 3:LRV Visualization Results
The LRV tool uses a number of algorithms to prepare the texts to use inside information extraction,text mining and visualization APIs,these algorithms are:Lemmatization algorithm for English,Topic model algorithm,vector space model.
Finally,we validated the model and tested the tool by uploading a collection of research articles to the tool,and the results of the visualizations were verified with expert researchers in the field.Our evaluation method used a combination of both a quantitative and qualitative approach.
7 Results and evaluation
The LRV tool was evaluated by researchers who tested the tool and completed a survey.The LRV tool has been tested by 10 researchers.Each user was given some time to learn the LRV tool,then we asked them to use it for their research question and literature survey,and then they were asked to complete a survey.The survey was classified into two parts:the first one to collect information related to the user and the second part to collect the information that related to the LRV tool.
When asked about the accuracy of the results of the visualizations,60% of respondents said the tool provided accurate results,see Fig.4.Moreover,80% of the users agreed that the tool was useful and satisfied their needs,see Fig.5,and would recommend it to a friend.80% of respondents agreed that the LRV tool was easy to use,understand,and navigate,see Fig.6.

Figure 6:LRV tool usability-ease of use
The training data set that was used in this evaluation was categorized into two parts.The first part,used to test the LRV tool performance,was based on the size.The second part was used to test the LRV tool performance in different domains.
The quality testing is testing the degree of conformance to explicit or implicit requirements and expectations [Kshirasagar and Priyadarshi (2008)].We tested the LRV tool quality using well known and available tools.The quality of the LRV tool is acceptable.It has 1.5 s load time and there are no issues for the readability standards.Moreover,it is compatible with majority of browsers.The performance testing determines or validates the speed,scalability,and/or stability characteristics of the tool.The performance of the tool depends on the CPU,memory space,and number of files that you uploaded,but in general it is acceptable.Moreover,we wrote different test cases to use them to test how the tool works in different situations.Then,we applied these test cases to see how the tool works.
8 Conclusion and future work
The LRV tool supports the researcher during the literature review task by providing different visualizations for the dataset of articles that will be used for the literature review.These visualizations enable the researcher to visualize a large number of articles in graphical form.The tool helps the researcher in analyzing and synthesizing the literature,and it provides a conceptual understanding of the designated research area.Therefore,this tool will have an impact on the academic research community as it facilitates the literature review task,especially with the availability of the enormous number of research studies published online.
The main limitation of the LRV tool is the performance of the tool (the time it takes for processing and visualization)as it depends on the CPU,memory space,and number of files that are uploaded.
Work for the LRV tool can be expanded to include recommendation services to recommend new relevant papers.The LRV tool can be integrated with library information systems to enable researchers to visualize the retrieved results in new innovative visualizations so that the selection of relevant papers becomes more intuitive.Another future direction emanating from this study is that the clustering could be used as a basis for building an ontological representation for the research question domain.
杂志排行
Computers Materials&Continua的其它文章
- Development of Cloud Based Air Pollution Information System Using Visualization
- A Learning Based Brain Tumor Detection System
- Shape,Color and Texture Based CBIR System Using Fuzzy Logic Classifier
- Application of Image Compression to Multiple-Shot Pictures Using Similarity Norms With Three Level Blurring
- On Harmonic and Ev-Degree Molecular Topological Properties of DOX,RTOX and DSL Networks
- A Reliable Stochastic Numerical Analysis for Typhoid Fever Incorporating With Protection Against Infection
