Surface stabilized cubic phaseof CsPb I3 and CsPbBr3 atroom tem perature*
2019-05-11FengYang杨凤CongWang王聪YuhaoPan潘宇浩XieyuZhou周谐宇
Feng Yang(杨凤),CongWang(王聪),Yuhao Pan(潘宇浩),Xieyu Zhou(周谐宇),
Xianghua Kong(孔祥华),and Wei Ji(季威)‡
Beijing Key Laboratory ofOptoelectronic FunctionalMaterials&M icro-Nano Devices,DepartmentofPhysics,
Renm in University ofChina,Beijing 100872,China
(Received 11March 2019;revisedmanuscript received 21March 2019;published online4 April2019)
Keywords:inorganic perovskite solar cell,thermal stability,surface energy,nanow ire,quantum dot,nanoplate
1.Introduction
Organic–inorganic hybridized perovskite solar cellshave recently attracted tremendous attention[1–11]because of its high power conversion eff iciency(PCE),[12]low cost,[4,6,13]and manufacturing feasibility.[1,14,15]While its PCE reaches 23.7%[12]only 9 years after the f irst reported 3.8%in 2009,[16,17]its thermal stability issue under ultraviolet light illum ination,[18]in moisture environment,[19]or at high temperatures[20]is still a challenge to the whole community.Organic–inorganic hybridize perovskite CH3NH3PbI3(MAPbI3)tends to dissociate into volatile NH3and CH3I gases[21]and PbI2[20,22]solid under thosementioned conditions.Unfortunately,PbI2has a larger bandgap compared with CH3NH3PbI3,which leads to largely reduced PCEs in perovskite solar cells.This instability wasbelieved to be one of themost challenging issues in commercialization of perovskitesolar cells.
Efforts from allaspects,suchasnew ly designed cellarchitectures,substantially optimized morphology,or introduced protecting layers,have been exhaustively made to solve this issue,[13,24–27]amongwhich large-size inorganic cations[28,29]appear to play an active role.Itwas found thatmixing MA with larger cations,such as Cs+,can improve the photo-and thermal-stabilitiesof theperovskite solar cells.[29]Asa result,CsPbIxBr3-xorCsPbI3showsbetter thermalandmoisturestabilitieswith a reasonably high PCEof~10%[30–32]and a large open-circuit voltage of 1.23 V.[33]These pioneering attempts suggest another route to build practical solar cells that uses purely inorganic perovskites,like CsPb X3(X=I,Br).Another issue,however,arises that the cubic phase of inorganic perovskites,with moderate direct bandgaps of~1.7–2.0 eV and thus offering the highest performance of light absorption among allallotropes of CsPb X3,ismore stable athigher temperatureswhile their bulk form undergoes a transition to an orthorhombic phase(Pnma)at 578 K[34]for CsPbI3and 360 K[17]for CsPbBr3or to a tetragonal phase at 403 K[17]for CsPbBr3.The room temperature orthorhombic phase has amuch larger indirectbandgap,such as2.6 eV forCsPbI3,[34]compared with thatof the cubic phase,which,consequently,reduces the PCE,such as0.09%for CsPbI3,[35]and lightabsorption coeff icient.
However,the stability of the cubic phase could be enhanced by downsizing its size to nanoscalewhere the surface energy dom inates,as illustrated by CsPbI3nanocrystals[36,37]or quantum dots[33]which maintained the cubic phase for months under ambient conditions.Here,we thus comprehensively investigated the roleof surface energy in tuning the cubic to orthorhombic phase transition using f irst-principles calculations.We considered the differences of surface energies of both the cubic and the orthorhombic phases.It turns out that the cubic phase has a higher total energy for its bulk but the surface energies of its solids are substantially lower than those of the orthorhombic phase.These competitive interactions thus lead to a reduced criticaltemperature for the cubic to orthorhombic phase transition if the surface ratio is enlarged.We have considered zero-,one-,and two-dimensional nanostructureswhile the bulk forms of both CsPbI3and CsPbBr3could be stabilized at room temperature if the crystal size is small enough.Given size and temperature dependent phase diagrams,we found characteristic sizes of 7.8–18.0 nm,3.0–10.0 nm,1.3–4.8 nm for0D(nanocrystal),1D(nanow ire)and 2D(nano-plates)CsPbI3,respectively,while the corresponding values are 14.0–71.9 nm,9.7–48.3 nm,and 5.4–24.6 nm for CsPbBr3.W ith the conf ined sizes smaller than these critical values,the cubic phase becomes themoststable phase at room temperature in CsPb X3nanostructures.These f indings offer a feasible route to stabilize the cubic phase and to utilize thesematerials in solar cellapplications.
2.M ethods
2.1.Density functional theory calculation
Our density functional theory(DFT)calculations were performed using the generalized gradient approximation for the exchange–correlation potential,the projector augmented wavemethod,[38,39]and aplane-wavebasissetasimplemented in the Vienna ab-initio simulation package(VASP).[40,41]Van derWaals interactionswere considered by a pairw ise potential in the Grimme’s 10 form(D3)[42,43]with the Becke–Jonson(BJ)form[43]for the damping function(DFT-D3-BJ).Kinetic energy cutoffs for theplane-wavebasissetsweresetat600 eV and 400 eV forgeometry relaxationsand energy calculations,respectively.The shapes and volumes of each cellwere fully optim ized for bulk counterparts and all atoms were allowed to relax until the residual force on each atom was less than 0.01 eV/˚A.AΓcentered 9×9×9 k-meshwasused for sampling the Brillouin zone(BZ)for the cubic phases of both materials,while k-meshes of 5×11×3 and 7×7×5 were adopted to sample the BZs of the orthorhombic phases for CsPbI3and CsPbBr3,respectively.
2.2.Surfaceenergy
For CsPbBr3,a tetragonalphaseemergesbetween the cubic and orthorhombic phases when the temperature is in a range from 360K to 403K.Forsimplicity,weonly considered the cubic and orthorhombic phases for CsPbBr3in thiswork,consistentwith the two phases discussed in CsPbI3.We considered nine surfaces for each CsPb X3in comparison of their surface energies,as shown in Fig.3 and Table 2.There are foursurfaces,which each containsCs,Pb,and Iatoms integer times those of a formula unit cell.They are the(001)surface of the cubic phasewith CsIand PbIterm inationson each of the surfaces,respectively[Cubic(001)-asym,Fig.3(a)],the(010)surfaceof theorthorhombic phase[Orth(010),Fig.3(b)],the I and Csco-term inated(001)surfaceof theorthorhombic phase[Orth(001)-CsI,Fig.3(c)],and the3Iterm inated(100)surface of theorthorhombic phase[Orth(100)-3I,Fig.3(d)].
The surface energy is derived using ESurf=(ESlabnECsPbX3)/A,where ESlaband ECsPbX3are the total energies of the surface slab and the CsPb X3bulk unit cell,respectively,A is the area of the surface and n represents the number of formula unit cells that the slab contains.The surface energies of the rest surfaces are relevant to the chemical potentials of Cs,Pb,and I in forming them.In light of this,their surface energies are calculated using formula ESurf=(ESlab-Σniμi)/A,where nirepresents the number of atoms for the ithelement(Pb,I,Br,Cs)andμirepresents the chemical potentialof the ithelement.Here,the chemical potentials are not determ inative and are in ranges estimated usingμi=μelem+Δμiin thiswork,whereμelemis the chemical potentials of their elementary substances andΔμiis thus the chem ical potential difference of the element between in CsPb X3and in its elemental bulk counterpart.These differences satisfyΔμPb+3ΔμI/Br+ΔμCs=ΔμTot.Here,ΔμTotis the total chem ical potential variation of all these elements between in bulk CsPb X3and in their elementary substances,in otherwords,is the formation enthalpy.Asa consequence,the surface energiesmay have three extremes:ΔμPb=ΔμTot;3ΔμI/Br=ΔμTot;ΔμCs=ΔμTot.We summarized these results in Tables2 and 3.
2.3.Transition temperatureand conf ined size
Ata certain temperature,the stability of the cubic phase in ananostructurewascomparedwith theorthorhombic phase in the same nanostructure with conserved number of atoms.Here,the free energy determines the relative stability,which includes three energy terms

The f irst term which sums up surface energies of all types of surfaces in one conf iguration is the total surface energy of the nanostructure.Here,i represents the type of surfaces and ANanorepresents the corresponding surface area.The second term is the bulk energy of the nanostructure,in which Vbulkrepresents the bulk volume in the nanostructure and Ebulkcorresponds to the volumetric energy density of the bulk phase.The totaland surface energies depend on the shape,size,and surface/bulk ratio of thenanostructures.In the last term,T and S represent temperatureand entropy,respectively.
Two nanostructuresat thephase transition pointshare the same free energy FNano.Thus we can obtain the transition temperature by calculating the volume normalized difference(ΔENano)of the total surface energies and bulk energies between the two nanostructures

Volume normalized difference of entropies(ΔS)of the cubic and orthorhombic phases were estimated to be 2.0×10⁻³meV/(K·˚A3)forCsPbI3and 1.3×10⁻³meV/(K·˚A3)for CsPbBr3,according to the experimental phase transition temperaturesofbulk CsPb X3.
3.Resultsand discussion
Figures 1(a)–1(d)show the atomic models of a CsPbI3crystal in the cubic and orthorhombic phases,respectively,while the associated lattice constants are summarized in Table 1. The cubic phase of CsPbI3[space group Pm-3m(No.221)]has higher symmetry in a smaller unit cellwith a lattice constant of 6.29˚A.The orthorhombic phase[Pnma(No.62)]hasa larger cellsizewith a=10.46˚A,b=4.79˚A,and c=17.81˚A.These theoretical values are highly comparablewith the experimental valueswith errors less than 0.5%.Figure 1(e)plots the total energies of these two phases as a function of cell volume,which indicates that the orthorhombic phase,with asmallerequilibrium volume,is0.29 eVmore stable than the cubic phase at the zero temperature lim it.The structure of the cubic phase of CsPbBr3is similar to that of CsPbI3(Fig.2(a)).The calculated lattice constant is 5.92˚A,only 0.83%larger than the experimental value,while the orthorhombic phase of CsPbBr3is substantially different from thatof CsPbI3,as shown in Figs.2(b)–2(d).The theoretical lattice constants of the orthorhombic phase are a=8.05˚A,b=8.42˚A,c=11.81˚A with an error of less than 2%in comparison with the experimental values.A lthough both orthorhombic phases of CsPbI3and CsPbBr3share the same Pnma(D2H-16)space group,their atom ic details do differ from each other.For CsPbI3,Pb2+ions are embedded in distorted iodine octahedra forming(Pb2I6)2-chains oriented along the y direction(Fig.1(b)),while Cs cations are f illed in the interstitial regions of these chains.Figure 1(d)clearly shows the cross-sectionofeach(Pb2I6)2-chain,inwhich each Pb atom is octahedrally coordinated by six Iatomsand these(Pb2I6)2-chainsare alternately titled to leftand rightsidesas arranged in a zig-zag pattern.
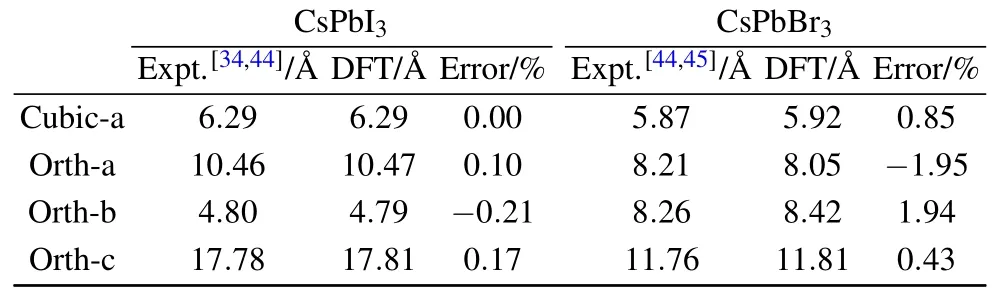
Tab le1.Lattice parametersof bulk CsPbI3 and CsPbBr3 and relativeerrors comparingwith theexperimentalvalues.

Fig.1.Schematicmodels and thermal stability of bulk CsPbI3 in cubic and orthorhombic phases.(a)Perspective view of the high temperature cubic phase bulk CsPbI3.(b)–(d)Side-and top-viewsof the low temperature orthorhombic phase bulk CsPbI3.Purple,gray and pink balls represent Cs,Pb and I atoms,respectively.(e)Thermal stability of bulk CsPbI3 in cubic(orange line)and orthorhombic(green)phases.
In terms of CsPbBr3,each Pb is again octahedrally coordinated by six I atoms,however,no chain is formed and these(PbBr6)2-octahedra are continuously connected,and are slightly tilting,along all of the lattice directions forming a 3D framework,as shown in Figs.2(c)and 2(d).Table 1 summarizes the calculated lattice constants of both phases in CsPbI3and CsPbBr3,reasonably consistentwith the experimental values.The energetic difference between the cubic and orthorhombic phasesofCsPbBr3,i.e.,0.11 eV(Fig.2(e)),is smaller than that of CsPbI3,consistent with the nearly 200 K[17,34]lowered transition temperature for CsPbBr3.

Fig.2.Schematicmodelsand thermalstability ofbulk CsPbBr3in cubic and orthorhombic phases.(a)Perspective view of the high temperature cubic phase bulk CsPbBr3.(b)–(d)Top-and side-views of the low temperature orthorhombic phase bulk CsPbBr3.Purple,gray and brown balls represent Cs,Pb and Bratoms,respectively.(e)Thermalstability of bulk CsPbBr3in cubic(orange line)and orthorhombic(green)phases.
We further considered the surface energies of these phases.Energiesof the surfacesCubic(001)-asym(Fig.3(a)),Orth(010)(Fig.3(b)),Orth(001)-CsI(Fig.3(c)),and Orth(100)-3I(Fig.3(d))are independentof the chem ical potentials of the individual atoms.Among these surfaces,the f irsttwoarenon-polarand theothersarequasi-nonpolar.Their surfaceenergiesare9.6meV/˚A2,16.0meV/˚A2,13.1meV/˚A2and 23.3meV/˚A2,respectively(see Table 2).The f irst three surfaces were believed to bemost stable among all surfaces considered,although the Cs rich lim it of the Orth(001)-Cs(Fig.3(e))surface isa bitmore stable than the Orth(001)-CsI surface and the I-rich lim itof the Orth(100)-4I(Fig.3(f))surface is slightlymore stable than the Orth(010)surface.Here,we emphasize that the Cs rich lim it is very diff icult to reach and the surface energy of the Cs-def icient lim itof this surface isover100meV/˚A2which is ratherhigh compared with other surfaces(see Table 2).A lthough the I-rich condition is relatively more feasible to reach,its energy is comparable with that of the Orth(010)within 1 meV and the stability rapidly decreases to over40meV under I-def icientconditions.In light of this,weexclude both Orth(001)-Csand Orth(100)-4Iin the follow ing discussion.
Apparently,surfaces of the cubic phase are more stable than those of the orthorhombic phase,which,again,indicates that reduced dimensions down to nanoscale could stabilize the cubic phase at room temperature.There are two terminations of surface Cubic(001),namely Cubic(001)-PbIand Cubic(001)-CsI,whose energies are in ranges from-20.4meV/˚A2(Irich,Cs def icient)to 59.4meV/˚A2(I rich,Pb def icient)and-39.8 meV/˚A2(I rich,Pb def icient)to 39.9 meV/˚A2(I rich,Cs def icient),respectively.Therefore,theexactsurfaceenergy of oneof the surfaces iseven smaller than their averaged value of 9.6meV/˚A2,which leads to underestimated surface stability of the cubic phase.In terms of cubic CsPbBr3,the CsPbBr3Cubic(001)-asym surfacewas used to consider the surface energy of cubic CsPbBr3,which gives an surface energy of 10.9 meV/˚A2,slightly larger than thatof the cubic CsPbI3.Theorthorhombic phaseof CsPbBr3appears differently from that of cubic CsPbI3,forwhich,we used asymmetric(001)and(110)surfaces,see Figs.3(g)and 3(h),since the energies of these surfaces are independent of the chem ical potentials of the individualatoms.Interestingly,both surfaceshave the surfaceenergy of 13.9meV/˚A2.

Fig.3.Side views of surface conf igurations.(a)Surface(001)-asym of cubic CsPbI3 with the Pb,Iatoms and Cs,Iatoms at the different terminations.(b)Surface(010)of orthorhombic CsPbI3.(c)Surface(001)-CsI and(d)surface(100)-3Iof orthorhombic CsPbI3.(e)Surface(001)-Csand(f)surface(001)-4Iof orthorhombic CsPbI3.(g)Surface(001)-asym and(h)surface(110)-asym oforthorhombic CsPbBr3 with Pb,Bratomsand Cs,Bratomsat the different term inations.(i)Surface(110)of cubic CsPbI3.
Given these surfaceenergies,we are ready to discuss the stability of CsPb X3nanocrystalswith different surface energies and surface/bulk ratios of the number atoms.In terms ofone-dimensionalnanostructures—i.e.,nanow ires—we considered f ive cross-section shapes for the cubic phase,asshown in Figs.4(a)–4(d).Figures4(a)and 4(b)show two considered triangular prisms.The one shown in Fig.4(a)(0°-triangular prism)contains two(001)surfaces for right-angle sides and one(110)surface for the hypotenuse,which was experimentally found in a recent report,[46]while the other one isa 90°-rotated onehaving two(110)surfaces and one(001)surface.

Tab le2.Surfaceenergiesof CsPbI3.

Tab le3.Surface energiesof CsPbBr3.

Fig.4.Top views of 1D NWs.(a)–(e)Schematic models of CsPbI3 NWs:(a)triangular prism containing two Cubic(001)surfaces for rightangle sides and one Cubic(110)surface for the hypotenuse(0°-triangular prism);(b)triangular prism having two Cubic(110)surfaces and one Cubic(001)surface(90°-triangular prism);(c)quadrangular prism with four Cubic(001)side surfaces(0°-quadrangular prism);(d)quadrangular prism with four Cubic(110)side surfaces(0°-quadrangular prism);(e)rectangular prism with Orth(010)and Orth(001)-CsIas the side surfaces.The ratio of longer and shorter edges of the rectangular cross-section is 1.22 using a criterion ofmaxim izing the cross-section areaunderagiven circum ference.(f),(g)Schematicmodels of CsPbBr3 NWs:(f)quadrangular prism with Orth(001)-PbBr as all the side surfaces;(g)quadrangular prism with(110)and(001)as the side surfaces.
The(110)surface of the cubic phase is depicted in Fig.3(i)and its surface energy of 16.2 meV(Pb rich,I def icient)to 53.8meV(I rich,Pb def icient)is rather high.A straightforward strategy thus lies in avoiding the presence of this surface.There are also two quadrangular prisms under consideration.The one shown in Fig.4(c)(0°-quadrangular prism)has four(001)surfaces while the 90°-rotated one shown in Fig.4(d)is cleaved along(110)surfaces. Given the total energy of the cubic phase and all surface energies,we f ind that the 0°-quadrangular prism is themost stable shape for cubic CsPbI3NWs,which is highly consistent with the shapes found in experiment.[47]We,therefore,use the 0°-quadrangular prism in comparison of stability with the orthorhombic phase.The shape of NWs in the orthorhombic phase ismore complicated than that in the cubic phase.For simplicity,according to the experimental input,[47]we only considered the rectangular ones shown in Fig.4(e)with optimally selected surfaces to ensure the lowestsurface energies.For 2D nano-plates,we used themost stable surfaces of both phases,respectively—i.e.,Cubic(001)-asym and Orth(001)-CsI—for thesurfaceareaofnano-plates.Thus,the relativestability dependson the conf ined thicknessof the nano-plates.In termsof 0D nanoparticles,we only considered cubic nanoparticleswith the Cubic(001)-asym surface for the cubic phase and the Orth(010),Orth(001)-CsIand Orth(100)-3I surfaces for the orthorhombic phase.Since the case of CsPbBr3has experimental inputs,the cross-section of CsPbBr3nanow ires is considered in a square pattern,as shown in Figs.4(f)and 4(g).
Asmentioned earlier,theexactsurfaceenergy of the Cubic(001)surface is over estimated.Therefore,we consider two extremes of the(001)surface of the cubic phase,namely 9.6meV/˚A2and 0meV/˚A2.The exactsurface energy should be in between these two extremeswhile the former extreme corresponds to them inimum-size lim it(red curves in Fig.5)of a nanostructure and the zero surface energy stands for the maximum-size limit(blue curves).Figure 5 shows the phase diagrams for the cubic and orthorhombic phases as functions of temperature and size.The conf ined size is presented by a parameter R,which stands for the lengths of the right-angle side for triangles,the side for squares and the shorter sides of rectangles,as illustrated in Figs.4(a)and 4(c).Here,the ratio for the longer and shorteredgesof the rectangular crosssection(Fig.4(e))is estimated to be 1.22 using a criterion of maxim izing the cross-section area under a given circum ference.It explicitly shows in Fig.5 that if R is smaller than 3.0 nm(m inimum limit)to 10.0 nm(maximum limit),the cubic phase of CsPbI3becomes themost stable phase rather than the orthorhombic phase at room temperature.While the energetic difference between the two phases is smaller for CsPbBr3,the critical size for phase transitions is thus larger than thatof CsPbI3,namely,9.7 nm to 48.3 nm.For2D nanoplates,the critical thicknesses to stabilize the cubic phases are 1.3 nm to 4.8 nm for CsPbI3and 5.4 nm to 24.6 nm for CsPbBr3.While the critical thickness of CsPbI3is a bit too thin,that of CsPbBr3is highly feasible that could be practically adopted in potential applications.Nanoparticles are another form of nanostructures,which weremostly explored in experiments forboth solarcelland lightemissionapplications.It shows a relative high tolerance i.e.,7.8–18 nm for CsPbI3,which is consistentwith the quantum dot size observed with TEM(roughly 8–15 nm)and Rietveld ref inement(about 9–17 nm).[33]An even larger size of 14.0–71.9 nm is found in CsPbBr3.These valuesareaccessible in experiments,indicating the feasibility of this strategy of surface engineering for stabilizing the cubic phase of CsPb X3.

Fig.5.Size and temperature dependent phase diagrams of CsPbI3 and CsPbBr3.Phase diagrams of(a)0-dimensional,(b)1-dimensional,and(c)2-dimensional CsPbI3,and of(d)0-dimensional,(e)1-dimensional,and(f)2-dimensional CsPbBr3.Two extremesof the(001)surfaceof thecubicphasewereconsidered in thecalculations.The formerextremecorresponds to theminimumsize lim it(surface energies of 9.6 meV/˚A2 for CsPbI3 and 10.9 meV/˚A2 for CsPbBr3,red curves)of a nanostructure while the maximum-size limit(blue curves)isderived by assuming a zero surfaceenergy.
It is interesting that the critical sizes of structural phase transitions decrease with the increase of dimensions.This is straightforward to be understood that all these phase transitions are originated from energy competitions of bulk and surfaces of these two phases.The higher the dimension,the smaller the critical size.The numbers of exposed surfaces in 0D nanoparticles,1D nanow ires,and 2D nanoplates are 6,4 and 2,respectively,leading to the decreased surface/bulk ratio with respect to the increasing dimensions.As a result,CsPb X3nanoparticles in the cubic phase shall show the excellent stability at room temperature.Indeed,there are several very recent experiments reporting potential applications of CsPb X3quantum dots or nanow ires in solar cell and light emission.[48]Anothernoticeable phenomenon lies in the criticalsizesof phase transitions for CsPbBr3usually being larger than the corresponding CsPbI3counterpart,which could be,again,explained by the smallerenergy difference between the two phases of their bulk forms;i.e.,0.11 eV(CsPbBr3)versus0.29 eV(CsPbI3).The larger energy difference in CsPbI3means that itneedsmuchmore surface efforts to stabilize the cubic phase of CsPbI3than that of CsPbBr3.The phase diagramshere give the reference parameters for the stabilization of cubic CsPb X3in differentdimensions.
4.Conclusion
In summary,this work proposes a strategy that stabilizes themeta-stable cubic phase of CsPb X3at room temperature.Density functional theory calculationswere employed to illustrate the feasibility of the strategy by comparing surface and bulk energies of the cubic and orthorhombic phases with varied surface/bulk ratios.The predicted critical thickness of 2D CsPbI3nano-plates that could stabilize the cubic phase—i.e.,1.3–4.8 nm—is slightly too thin for lightabsorption while that of CsPbBr3—i.e.,5.4–24.6 nm—may be adopted in portable or f lexible display.However,themoderate sizesof the nanoparticle(7.8–71.9 nm)and nanow ire(3–48.3 nm)formsappearhighly prom ising in applicationsof solar cells,f lexible displays,among others.In lightof this,our results go one-step towards solving the long-standing stability issue of CsPb X3andmay promote practicalapplicationsof nanostructured CsPb X3.
杂志排行
Chinese Physics B的其它文章
- Computational study of inverse ferrite spinels
- Effectsof chem icalpressure on dilutedmagnetic sem iconductor(Ba,K)(Zn,M n)2As2*
- Particle–hole f luctuationsand possible superconductivity in dopedα-RuCl3*
- Raman scattering study ofmagnetic layered M PS3 crystals(M=M n,Fe,Ni)*
- Low tem perature Pmmm and C2/m phases in Sr2CuO3+δ high temperature superconductor*
- Crystallographic andmagnetic propertiesof van derWaals layered FePS3 crystal*