Optimized energy thresholds in a spectral computed tomography scan for contrast agent imaging
2019-04-01KaiXinHuangZhiDengXiaoFeiXuYuXiangXing
Kai-Xin Huang·Zhi Deng·Xiao-Fei Xu·Yu-Xiang Xing
Abstract Spectral computed tomography(CT)based on photon counting detectors(PCDs)is a well-researched topic in the field of X-ray imaging.When PCD is applied in a spectral CT system,the PCD energy thresholds must be carefully selected,especially for K-edge imaging,which is an important spectral CT application.This paper presents a threshold selection method that yields better-quality images in K-edge imaging.The main idea is to optimize the energy thresholds ray-by-ray according to the targeted component coefficients,followed by obtaining an overall optimal energy threshold by frequency voting.A low-dose pre-scan is used in practical implementations to estimate the line integrals of the component coefficients for the basis functions.The variance of the decomposed component coefficients is then minimized using the Cramer—Rao lower bound method with respect to the energy thresholds.The optimal energy thresholds are then used to take a full scan and gain better image reconstruction with less noise than would be given by a full scan using the non-optimal energy thresholds.Simulations and practical experiments on imaging iodine and gadolinium solutions,which are commonly used as contrast agents in medical applications,were used to validate the method.The noise was significantly reduced with the same dose relative to the non-optimal energy thresholds in both simulations and in practical experiments.
Keywords Spectral CT·Contrast agent imaging·Cramer—Rao lower bound ·Thresholds optimization ·K-edge
1 Introduction
X-ray CT imaging is an important tool in clinical diagnoses,non-destructive testing,security inspections,and other fields.X-ray attenuation is a function of the photon energy and the material properties,but traditional CT detectors cannot identify the photon energy[1].Therefore,traditional CT systems can only provide an average linear attenuation coefficient in the material for a polychromatic source.Generally,the higher-energy spectral components are less strongly attenuated,while the lower-energy spectral components are more strongly attenuated.This results in the beam-hardening effect,which produces shading and cupping artifacts in the CT reconstructions and is inevitable in traditional CT systems.
Spectral CT imaging can acquire signals for multiple energy spectra,so the energy-dependent attenuation can be fully utilized to identify different material properties to discriminate different materials.A current popular realization involves dual-energy imaging[2],which uses kVpswitching techniques with two sources running at different energies[3]and dual-layer detector approaches[4].Dualenergy imaging can effectively suppress beam-hardening artifacts and yield specific material information,such as the effective atomic number that could not be obtained from traditional CT imaging.
Spectral CT based on PCD has generated much interest in recent years.PCD uses different energy thresholds to identify the energy of each incident photon so that signals collected by PCD carry energy information.K-edge imaging[5,6]is one of the most important PCD applications.The K-edge energies are used as thresholds,where K-edge imaging is then used to identify and quantify high Z elements within a specimen,an animal,or a patient.Some high Z elements serve as contrast agents for diagnostic X-ray imaging,such as I,Gd,and Au solutions.The raw CT data are then analyzed with different energy bins to enable spectral CT to have a high signal-to-noise ratio(SNR)and spatial resolution.The multiple spectra are then used with material decomposition methods to discriminate between materials.Furthermore,it is also possible to reduce the radiation dose that is used in each scan[7].The common spectral CT reconstruction methods are pre-reconstruction,post-reconstruction,and ‘‘one-step''reconstruction[8,9].
The pre-reconstruction method decomposes the material information in the projection domain.Dual effect and material basis function techniques are commonly used for the decomposition.The analysis also requires K-edge material attenuation coefficients.The linear combination coefficients of the basis functions are calculated according to the raw projection data collected in different energy bins to reconstruct the spatial distribution of the basis functions.The physical model given by the pre-reconstruction algorithm is fairly accurate.Since a pair of ray paths is simultaneously measured using low and high energy bins,this method can be implemented using dual-source or high—low switching modes.The post-reconstruction method decomposes materials in the spatial domain and is mostly used in medical dual-energy CT[10].First,the CT images are reconstructed using the low and high energy bin information.Then,the material basis function distributions are obtained based on the reconstructions.This is easily implemented and is not limited by the system scanning method.However,beam-hardening artifacts can affect the image quality.The ‘‘one-step''method directly estimates the material reconstruction using the raw measured CT data in the low and high energy bins.Iterative techniques are then normally used for the ‘‘one-step''method,which makes the method more complex than the other two methods.
This work focuses on the pre-reconstruction method due to its robustness and usefulness using pairs of matched ray paths,which can be easily obtained in spectral CT.
The PCD signals are used to choose suitable energy thresholds and obtain high-quality images.Two empirical methods can be used to determine the energy thresholds.One method simply distributes the thresholds evenly over the entire spectrum.The other method averages the number of incident photons over all energy bins.This study uses Cramer—Rao lower bound(CRLB)theory to calculate the energy thresholds.CRLB theory,originally proposed by Cramer in 1945[11],provides a theoretical noise bound for unbiased estimates of random variables.In 1976,Alvarez and Macovski used CRLB with a dual-energy CT to analyze the noise in the basis function decomposition[2].In 2009,Rossel et al.utilized CRLB with spectral CT data to analyze the noise in the material decomposition results in the projection domain and in reconstructions in the spatial domain[12,13].They used CRLB to obtain an analytical expression for the lower bound of the decomposition noise.They then optimized the thresholds based on CRLB analysis in the projection domain using line integrals over the basis function coefficients in the special situation for a vertical ray path[14].Meng et al.[15]optimized the energy thresholds in the spatial domain using image subtraction.Since the line integrals of the decomposition coefficients for the scanned objects are unknown and could vary greatly in practice,this study proposes an energy threshold optimization method for K-edge imaging.The main idea is to first use a low-dose pre-scan to obtain the line integrals of the basis function coefficients.The line integral along a single ray path is then used to reduce the local variance of the basis function using CRLB theory.This yields a minimum variance threshold.Frequency voting is then used to calculate the overall optimal thresholds.Finally,a full scan is taken using the optimal energy thresholds in order to obtain a high-quality image.
2 Theory and methods
2.1 System model of a spectral CT
A key step in spectral CT imaging is to obtain an energy-independent component coefficient distribution for the scanned object.In a general model[16],the linear attenuation coefficient curve for a certain material is decomposed into a linear combination of several basis functions:

where φτ(E)represents the energy-dependent component inandrepresents the spatial distribution of the component coefficient at location r→corresponding to the τth basis function.
Therefore,the projection of linear attenuation coefficients in CT imaging can be formulated as:

By defining the line integral of the τth basis function as Aτ:

Equation(2)becomes:

Consider a spectral CT image obtained using a photon counting detector with NEindependent energy windows.Let ni(i=1,2,...,NE)denote the number of photons detected in the ith energy channel withas its mean value.Assuming Poisson statistics for the counting measurements,the probability is:

According to Beer's law:

where I0(E)denotes the spectrum of the X-ray source and Eiis the energy threshold.h(E′,E)denotes the detector response function. We also define H(i,E)=as the integrated detector response for the ith energy channel. We define the vector A= (A1,...,AΓ)T.Using the negative log-likelihood and ignoring the constant term,the objective function to be minimized is:

The function Φ(A1,...,AΓ) is nonlinear. The nimeasurements are used to calculate the line integrals A by minimizing Eq.(7)in the case of Γ≤NE:

Newton's method can be used to iteratively solve Eq.(8).According to Eqs.(5—7):

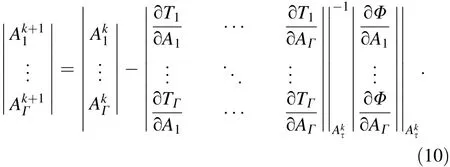
Therefore,the updating formula is:
2.2 Optimizing energy thresholds for spectral CT imaging
The line integral of decomposition coefficient Aτis further reconstructed to determine its spatial distribution)via commonly used CT reconstruction methods.Hence,the accuracy and noise of Aτwill propagate to),which will affect the output image quality.The key factors in Eq.(7)affecting the accuracy and noise of Aτare the energy thresholds Eiwhen I0(E)is fixed for the system.Hence,this study focuses on finding the optimal energy thresholds.
The variance is minimized to optimize the energy thresholds.According to references[12,17,18],there is a lower bound for the variance of the estimate:

where F is the Fisher information matrix of the function Φ(A1,...,AΓ)and [·]τ,τrepresents an element on the diagonal.
The Fisher information matrix with respect to Aτis calculated as:


Eqs.(12)and(13)can be simplified to:

The optimal energy thresholds are then:

However,there are three problems:
1. The line integral Aτis not known for practical scans.
2. There are a huge number of ray paths in CT images,and the optimal energy thresholds can differ for different paths.
3. The optimal energy thresholds can also differ for different basis components.
In light of these problems,the following method was developed to optimize contrast agent imaging in spectral CT images:
1. Pre-scan an object with an ultra-low dose.
3. Find the optimal energy thresholds for each ray for the basis function of interest,which are the contrast fractions in this task according to Eqs.(15)and(16)(the basis function of interest is the component of contrast agent in this paper).
4. Set the optimal energy thresholds as the thresholds with maximum frequency for the ray paths of interest.
5. Scan the object with a normal dose.
6.Decompose the material components and reconstruct the spatial distribution of the coefficients.
Since there is no closed form solution for the noise as a function of the energy thresholds,we can only optimize by threshold scan.
The pseudo-code for the decomposition procedure and the procedure used to find the optimal thresholds for every single ray path is as follows(Table 1).
3 Experimental studies
The method was validated using simulations and practical experiments on commonly used I and Gd solutions.These experiments used the photoelectric effect function,Compton effect function,and attenuation function for the contrast agent as the basis functions for component decomposition.

Table 1 The pseudo-code for the optimization method
3.1 Simulation experiments
The simulations used the phantoms shown in Fig.1.Data were collected in 360 views over 2π using the energy spectrum shown in Fig.2.This method can be extended to cases with other numbers of energy bins.We would like to focus on 4 energy bins because the advantage of using more than 4 energy bins is limited in our studies.The detector response function was assumed to be ideal,i.e.,H(i,E)=1.The distance from the source to the center of rotation is 48.5 cm,and the distance from the source to the detectors is 73.5 cm.The detector is 15.36 cm in width with 100 um bin size.The pixel size of the reconstruction image is 100 um.These geometric parameters are suitable for both simulation and practical experiments.

Fig.1 a Numerical phantom used for imaging Gd;b numerical phantom used for imaging I

Fig.2 Spectrum and energy thresholds for the Gd phantom.The dashed lines are the non-optimal thresholds.The solid lines are the optimal thresholds
3.1.1 Optimize energy thresholds for imaging the Gd contrast agent
As mentioned in Sect.2.2,a pre-scan of the phantom was performed using the non-optimized energy thresholds.Since the K-edge of Gd is 50 keV,one threshold was set to 50 keV.In the normal-dose case,I0was 2×10⁶.To yield reasonable comparisons,the normal dose was divided into two parts with 10%of the normal dose used for the prescan so that the pre-scan dose was 0.1I0=2×10⁵.The other 90%of the normal dose was used for imaging with the optimal thresholds.The pre-scan thresholds and the spectrum are shown in Fig.2.The simulations used E1=25 keV,E3=50 keV,and E5=100 keV,and the thresholds for E2 and E4 were determined for each ray.
Equations(8—10)were used to compute the line integrals of the decomposition coefficients for each basis function using the pre-scan data.The distribution of the line integral AGdis shown in Fig.3.
We could see that there are some line integrals of Gd smaller than 0 because of noise.In theory,zero values of AGdare expected for rays that avoid the contrast agent.These negative values are considered to result from noise.We set a threshold to pick AGdrelated to the contrast agent as:

Fig.3 The distribution for the line integral of Gd component

Therefore,only ray paths satisfying the condition AGd>Thr are taken into account for energy threshold optimization.This strategy was applied to all our simulations and practical experiments.
Then,the CRLB of the basis functions was calculated for Gd using Eqs.(11—15).We could then obtain the thresholds of E2 and E4,which responds to the minimum CRLB value for each ray path taken into account.The frequencies for the optimal thresholds of E2 and E4 for each path were taken into account,as shown in Fig.4.The maximum frequencies for E2 and E4 were 39 keV and 60 keV.The optimized thresholds are shown in Fig.2 for this imaging case.With these thresholds,the number of emitted photons in each energy bin from low to high was 4.3619×10⁵, 4.0593×10⁵, 4.0216×10⁵, and 5.2595×10⁵.These photon counts in each energy bin differ by about 30%.The phantom was then scanned with the optimal thresholds and an incident photon flux of 0.9I0=1.8×10⁶.The results are compared with a normal scan with a non-optimal energy threshold in Fig.5.Newton's method was used for decomposition with the FBP reconstruction for each basis function.The results show that the image quality is significantly improved in all the coefficient images.The results were validated quantitatively by calculating the standard deviation(SD)over the regions of interest(ROI)indicated in Fig.5.These ROIs were all circular regions containing a uniform material with the edge pixels excluded.The standard deviations are listed in Table 2,where ‘‘PE''denotes the basis component of the photoelectric effect function,and ‘‘Cmp''denotes the basis component of the Compton effect function.The results show that the decomposed images of the Gd contrast agent obtained with this method contain less noise,even though only they used only 90%of the dose of the non-optimal energy thresholds.The noise with the photoelectric effect and Compton effect functions are also lower than the nonoptimal-threshold case.

Fig.4 Frequency of the optimal values for E2 and E4 for the Gd phantom

Fig.5 Decomposed component images of the three basis functions.The left panel shows the non-optimal energy threshold case with 100%dose,and the right panel shows the optimal energy threshold image with 90%dose.a Component images of Gd(display window:[-0.015,0.015]).b Component image of the photoelectric effect(display window:[-6000,12,000]).c Component image of the Compton effect(display window:[-0.1,0.12])

Table 2 Noise of decomposed component image for every basis function

Fig.6 FORBILD head phantom with contrast agent added
We further tested our method on a more complex FORBILD head phantom[19].Four Gd solutions were inserted,as shown in Fig.6.All the percentages refer to mass fractions.The settings were the same as before.The pre-scan used a dose of 0.1I0=1×10⁵.The source spectrum with pre-scan thresholds is shown in Fig.7.E2 and E4 are optimized for each ray and the distributions of the resulting optimal values are shown in Fig.8.E2 and E4 were set to 39 keV and 60 keV(with maximum frequencies)by frequency voting.The decomposed component images for the non-optimal energy thresholds cases were reconstructed using data with a 100%dose,while the optimal energy thresholds cases used a 90%dose.The reconstruction results are shown in Fig.9.Standard deviations within the ROIs were again calculated to evaluate the reconstruction image quality(listed in Table 3).The results show that this method is much less noisy,even though only 90%of the dose was used to determine the non-optimal energy thresholds.
3.1.2 Optimized energy thresholds for imaging contrast agent I
In this section,contrast agent I was the target material;hence,I was used as a basis function.The phantom is shown in Fig.1b.Since the K-edge of I is 33 keV and the minimum threshold is 25 keV,the analysis did not use another threshold between those two limits,as was the case with Gd.The analysis fixed E1=25 keV,E2=33 keV,and E5=100 keV,and only E3 and E4 were optimized.The pre-scan thresholds are shown in Fig.10.The pre-scan dose was again 0.1I0=2×10⁵.The optimal thresholds were then computed for each ray.The results are shown in Fig.11.The optimal thresholds are 39 keV and 52 keV for E3 and E4,respectively.The number of emitted photons in the four energy bins is 2.1562×105,4.8548×105,2.0730×105,and 8.6094×10⁵,which is a rather unbalanced division of photon counts.A spectral CT scan was then performed with a dose of 0.9I0=1.8×10⁶using the optimized threshold shown in Fig.10.The result is compared with the non-optimal-threshold case with a dose of I0=2×10⁶.The reconstructed material component images shown in Fig.12 show visually lower noise levels in the reconstructions using these methods with 90%dose.The standard deviations are listed in Table 4.Similar to the Gd contrast agent imaging,the image quality with the decomposed coefficients is significantly improved,though not as much as in the Gd case.

Fig.7 Spectrum and energy thresholds for the FORBILD phantom.The dashed lines are the non-optimal thresholds.The solid lines are the optimal thresholds

Fig.8 The frequency of the optimal values for E2 and E4

Fig.9 Decomposed component images of the three basis functions for the FORBILD phantom.The left panel shows the non-optimal energy threshold case with 100%dose,and the right panel shows the optimal energy threshold result with 90%dose.a Component images of Gd(display window:[-0.03,0.1]).b Component image of the photoelectric effect(display window:[-20,000,90,000]).c Component image of the Compton effect(display window:[-0.08,0.38])

Table 3 Noise in the decomposed component images for each basis function with the FORBILD phantom

Fig.10 Spectrum and energy thresholds for the I phantom.The dashed lines indicate the non-optimal energy thresholds.The solid lines are the optimized energy thresholds
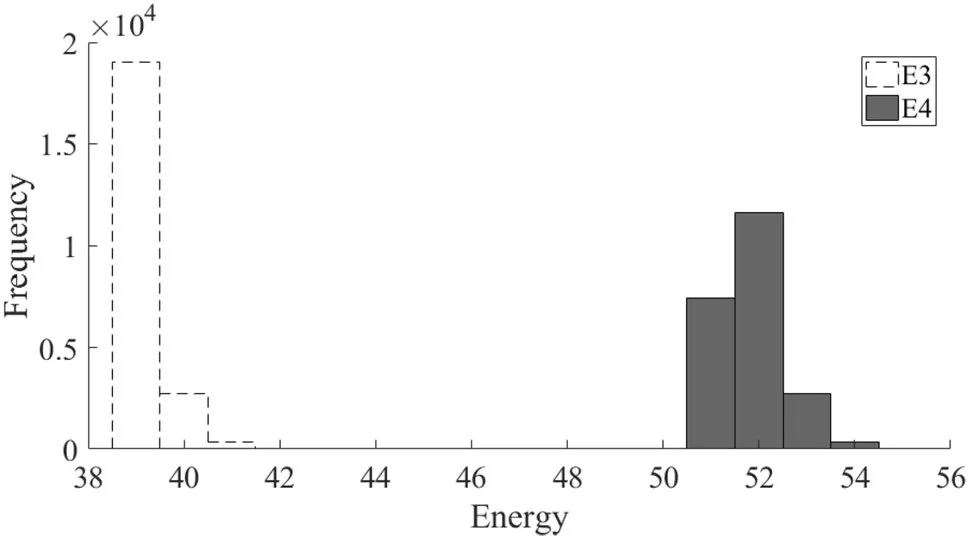
Fig.11 The frequency of the optimal value for E3 and E4 for the I phantom

Fig.12 Decomposed component images of each basis function for different energy thresholds.The left side shows the non-optimal energy thresholds with 100%(normal)dose,while the right side shows the optimal energy thresholds with 90%dose.a Component images for I(display window:[-0.008,0.011]).b Component images for the photoelectric effect(display window:[-5000,12,000]).c Component images for the Compton effect(display window:[-0.06,0.11])

Table 4 Standard deviation of the decomposed component images for each basis function
These three simulations show that energy threshold optimization is an important issue in spectral CT imaging.Moreover,the optimal energy thresholds vary greatly for different imaging tasks.Thus,real applications require case-by-case optimization of the energy thresholds.
3.2 Practical experiments
The energy threshold optimization method was further validated by imaging Gd and I solutions.All the solution percentages indicated here refer to mass fractions.
The measurements used an XCounter Flite X1 photon counting detector.Its energy response function h(E′,E)was calibrated with fluorescence signals using a hybrid model combining Monte Carlo predictions with a linear correction[20,21].The X-ray source was 100 kVp,and the current was 1 mA.The source spectrum was then measured using the pre-calibrated detector response function by a blank scan with threshold scanning[22]:

where Eiare the discretized thresholds with small steps.This equation was calculated numerically.
Since the detector response is calibrated to be a discretized function with step-size 1.8 keV,the resolution of the optimized energy threshold was no better than 1.8 keV.
The exposure time per view for the pre-scan was 0.33 second with data collected for 72 views over 2π during the pre-scan.The normal-dose imaging used a 1-s exposure time per view,with projections using 360 views over 2π.The optimal energy threshold scans with the reduced dose used projections with 360 views over 2π and 0.93 second exposure time per view.This ensures that the total pre-scan dose plus the optimal energy threshold scan were nearly equal to the dose used in normal imaging.The analyses used the same Newton's method decomposition and FBP reconstruction as in the simulations.
3.2.1 Optimized energy thresholds for the Gd contrast agent imaging
The measurements used the phantom shown in Fig.13.The materials that were placed in the phantom are listed in Table 5.
The measured data were analyzed using the photoelectric effect function,Compton effect function,and attenuation function of 50μm Gd as basis functions.The nonoptimal pre-scan energy thresholds shown in Fig.14 were used to optimize the energy thresholds for each ray.The optimal E2 and E4 frequencies are shown in Fig.15.

Fig.13 Phantom used in the measurements

Table 5 Materials in the phantom

Fig.14 Spectrum and thresholds for the Gd phantom.The dashed lines are the non-optimal energy thresholds used in the pre-scan.The solid lines are the optimal energy thresholds

Fig.15 Frequency of the optimal values for E2 and E4
The optimal energy thresholds shown in Fig.14 were then used to record reduced dose scans.The ring-artifact reduction(RAR)method was used during reconstruction due to strong non-uniformities in the detector response.The decomposition coefficient images are shown in Fig.16.The noise is significantly reduced,both with and without RAR.The improvement is further confirmed by the ROI standard deviations listed in Table 6.
As in the simulation study,the optimized energy thresholds significantly improve the image quality of the Gd-decomposed image,which is the optimization target.The image qualities with the photoelectric effect components and the Compton effect components are also slightly better than the images obtained with the non-optimized thresholds and with a normal dose.The gains due to energy threshold optimization with and without RAR are similar.Therefore,only the results with RAR from the other experiment will be shown.
3.2.2 Optimize energy thresholds for contrast agent I imaging
These measurements used the phantom shown in Fig.17 with the materials listed in Table 7.
The analyses used the photoelectric effect,Compton effect,and I mass attenuation functions as basis functions.The pre-scan thresholds and spectrum are shown in Fig.18.The energy thresholds E1,E2,and E5 were fixed,while only E3 and E4 were optimized as in the simulations.The optimized energy threshold frequencies are plotted in Fig.19 for the optimal threshold settings shown in Fig.18.The reconstructions from the optimal energy and non-optimal energy threshold scans are shown in Fig.20.The ROI standard deviations for the component images are listed in Table 8.The results show reduced component noise for the I contract agent.The results show that using the photoelectric and Compton effect basis functions also improves the images.
Thus,there is a clear upgrade of the image quality of decomposed I component.The image quality of the photoelectric effect and Compton effect components are also better than the non-optimized results.
3.3 In fluence from the accuracy of coefficient projections to optimal energy thresholds
The line integrals of the decomposition coefficients for the material basis functions could be noisy in the low-dose pre-scan so that we would obtain a noise-affected distribution for the ray-by-ray optimal energy thresholds.Frequency voting will find the location of the maximum frequency value to remove this noise effect.For demonstration,we compared the optimal energy thresholds resultsfrom a low-dose scan and a normal-dose scan for the simulation study of I imaging.The dose is 2e5 for the normal-dose situation and 2e4 for the low-dose situation.
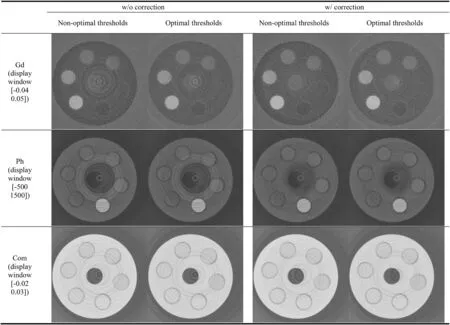
Fig.16 Reconstruction results of the decomposed components.The images in the left two columns are without RAR for the non-optimal and optimal thresholds.The images in the right two columns are shown with the RAR corrections.First row:images of the Gd contrast agent after threshold optimization.Second row:images of the photoelectric effect component.Third row:images of the Compton effect component.Images from the optimal-threshold scan have lower noise than images obtained from the non-optimal-threshold scan
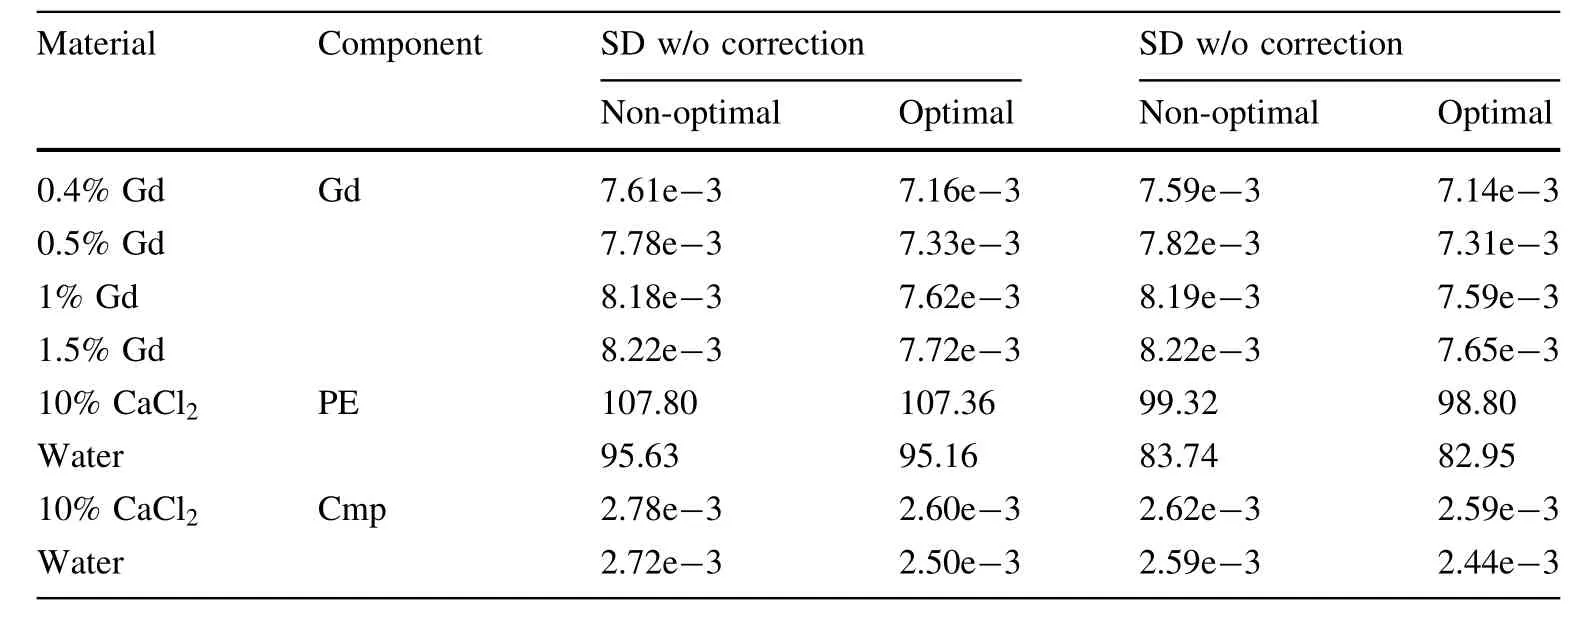
Table 6 Standard deviations of the decomposed component images for the various basis functions
The ray-by-ray optimal energy thresholds for E3 and E4 are shown in Figs.21 and 22,respectively.We can see that the optimal energy thresholds may be different in some ray paths due to the larger amount of noise in low-dose prescan.The location of the frequency maximum is the same for both E3 and E4.Hence,the frequency voting strategy can mostly remove the in fluence of noise from a low-dose scan.This tells us that a low-dose pre-scan is sufficient to find the comprehensive optimal energy thresholds.

Fig.17 Phantom used in the measurements

Table 7 The materials in the phantom

Fig.18 Spectrum and energy thresholds for the I phantom.The dashed lines indicates the non-optimal energy thresholds,and the solid lines indicate the optimal energy thresholds

Fig.19 Frequency of the optimal value for E3 and E4

Fig.20 Decomposed component images of the phantom measurements.The left column shows the non-optimal energy thresholds,while the right column shows the optimal energy thresholds.a Component images of I with display window[-0.0025,0.002].b Component images of the photoelectric effect with display window[-1000,3000].c Component images of the Compton effect with display window[-0.005,0.025]

Table 8 SD of decomposed component images

Fig.21 The normalized frequency of optimal energy threshold E3
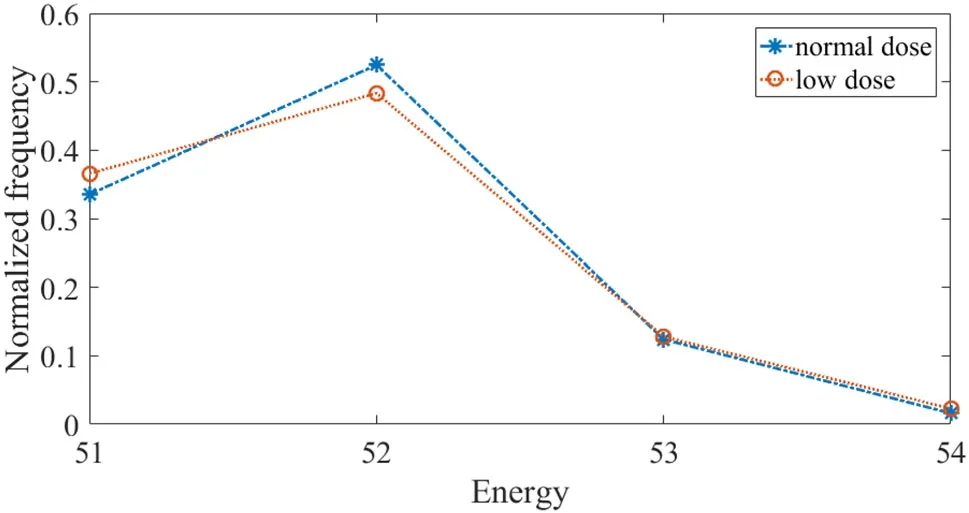
Fig.22 The normalized frequency of optimal energy threshold E4
4 Discussion and conclusion
This work presents a method for optimizing the energy thresholds in a spectral CT for contrast agent imaging.The optimization problem minimizes noise in the contrast agent components.The method is based on CRLB and basis function decomposition in the projection domain.The basic FBP reconstruction method is used to avoid bias in the spatial CT reconstruction.The optimization is customized for each scan using an ultra-low-dose pre-scan.Scans using the optimal thresholds then use slightly reduced doses so that the total dose is no higher than for a normal scan.The method was tested in simulations and practical experiments.
We notice that there would be an unavoidable error in the estimations of h(E′,E)and I0(E),which are required in our CRLB computation.This could affect our optimal thresholds and reconstructions.Hence,improvements in practical experiments could be affected by accuracy of the estimated h(E′,E)and I0(E)functions.The reconstructed image qualities are much better.The level of improvement is related to the distance between the optimal and nonoptimal energy thresholds.Non-target component images can also be improved by optimizing the energy threshold,though not as much as the targeted components.Thus,energy threshold optimization can improve the image quality,with task-oriented optimization yielding the best results.Moreover,we would like to point out that the optimal energy thresholds in our study do not form uniform photon counts among different energy windows,which is a common choice in the field.We observe a difference of more than 300%between photon counts in the optimal setting.We think this is because noise in the reconstructions is mainly affected by the detected signals,which are affected by the source spectrum,energy bin separation,and scanned object.Uniform incident photon counts for different energy bins do not necessarily yield an optimal noise distribution of the detected signals.Therefore,optimal thresholds are task dependent and could be very different from an even incident photon distribution in energy bins.We also performed tests on freeing the thresholds at K-edge points and optimizing these thresholds.Without exception,setting thresholds at K-edge points of the contrast agents gives us optimal results.Therefore,we can conclude that optimizing the two energy thresholds in our four energy windows case is sufficient to produce images with improved quality.
This study presents a method for optimizing the energy thresholds in multi-energy spectral CT.This method can be computationally expensive because it calculates the probability distribution of the optimal thresholds for all rays.A lookup table could be developed for the decomposition coefficients of various material compositions for the ray paths based on a large set of clinical data.Further work will consider practical implementations of this method.
杂志排行

Nuclear Science and Techniques的其它文章
- Higher-order approximate solutions of fractional stochastic point kinetics equations in nuclear reactor dynamics
- Radiological characterization of building materials used in Malaysia and assessment of external and internal doses
- Investigation of maximum proton energy for qualified groundbased evaluation of single-event effects in SRAM devices
- Neutronic analysis of silicon carbide cladding accident-tolerant fuel assemblies in pressurized water reactors
- Design and flow field analysis for visualization experiment facility of pebble bed based on molten salt reactor
- Quantitative energy-dispersive X-ray fluorescence analysis for unknown samples using full-spectrum least-squares regression