I3:A Self-organising Learning Workf low for Intuitive Integrative Interpretation of Complex Genetic Data
2019-03-07YunTanLuluJiangKankanWangHaiFang
Yun Tan ,Lulu Jiang ,Kankan Wang *,Hai Fang 3,*
1 State Key Laboratory of Medical Genomics and Shanghai Institute of Hematology,Ruijin Hospital,Shanghai Jiao Tong University School of Medicine,Shanghai 200025,China
2 Bristol Renal,School of Clinical Sciences,University of Bristol,Bristol BS1 3NY,UK
3 Wellcome Centre for Human Genetics,University of Oxford,Oxford OX3 7BN,UK
Abstract We propose a computational workf low(I3)for intuitive integrative interpretation of complex genetic data mainly building on the self-organising principle.We illustrate the use in interpreting genetics of gene expression and understanding genetic regulators of protein phenotypes,particularly in conjunction with information from human population genetics and/or evolutionary history of human genes.We reveal that loss-of-function intolerant genes tend to be depleted of tissue-sharing genetics of gene expression in brains,and if highly expressed,have broad effects on the protein phenotypes studied.We suggest that this workf low presents a general solution to the challengeof complex genetic data interpretation.I3 is available at http://suprahex.r-forge.r-project.org/I3.html.
KEYWORDS Self-organising;Human genetics;Interpretation;Evolution;Machine learning
Introduction
We know the exciting promise in machine learning applied to geneticsand genomics[1].Wealso know to datethere hasbeen relatively slow progressachieved by machinelearning,in terms of how to intuitively make sense of emerging genetic datasets.Now we are able to generate many new types of genetic datasets,for example,through genetic mapping of gene expression across tissues[2]and genetic screensfor protein phenotyperegulators[3,4].However,our ability to understand such datasets is very limited.The rate of data interpretation is much slower in particular when seeking to integrate with population-wide genetic information and species-wide evolutionary information.Population-wide genetic variants could be aggregated into a metric estimating the loss-of-function intolerance of a gene[5],while evolutionary history of human genes could be estimated by phylostratigraphy[6,7]def ining evolutionary age for a gene as our ancestor in which this gene was first appeared.Data interpretation should be also madeconsidering well-annotated knowledge on genes,usually in theform of signaling pathways such as from Reactome[8].One of the challenges is how to integrate all information accelerating interpretation,ideally achieved in a single workf low.
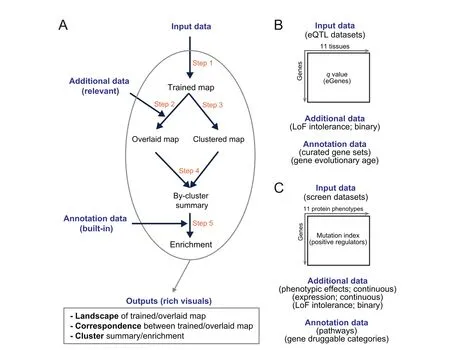
To address the challenge above,we propose a computational workf low that enables characterisation of input data and integration with additional(relevant)data for knowledge discovery,all achieved in an intuitive way(Figure 1A).This workf low benef its from three considerations.Firstly,we characterise input data using a self-organising learning algorithm[9].This may be most applicable for its unsupervised nature.As comparisons,supervised machine learning(such as deep learning[10])requires desired outcomes as part of learning that are usually not available for computational biology.Secondly,the self-organising ability is desirable for unbiased integration with additional datasets that can be diverse in data types(binary and continuous).Thirdly,data characterisation is constrained on a regularly shaped map.This is no trivial as the regular map is much easier for effective visualisations.Because of these considerations,one of the def ining features in our workf low is the map-centric interpretation that covers all steps of interpretations(overlaying/integration,clustering,enrichment,and other downstream analyses that are scalable to meet customised needs).
Our workf low was inspired by the previous work,that is,implementing the self-organising principle to interpret regulatory genomics[11],gene expression patterns[12,13],accessible chromatin[14],and DNA replication timing[15],to name but just a few.To further advocate this principle and also to demonstrate the value and applications of the proposed workf low,we interpreted two complex genetic datasets:one generated from multi-tissue expression quantitative trait loci(eQTL)mapping[2](Figure 1B),and the other from haploid mutagenesis screens for protein phenotypes[3,4](Figure 1C).We view this workf low as Intuitive Integrative Interpretation or‘I3’because it mimics how we human beings,at our disposal,gather together the knowledge available best explaining the data.

Figure 1 Overview of I3 enabling intuitive integrative interpretation
Methods
Detailed description of the I3 workf low
Step 1:self-organising input data constrained by the map shape
Weextended a self-organising algorithm to map shapestrained from input data,made availableas part of an R/Bioconductor package‘supraHex’[15].The design of a map shape considers the structure of input data;principle component analysis(PCA)helps to reveal what data point clouds look like(either the shape boundary or the number of density centers).We visualised the trained map as the landscape in 1D or 2D.The support for the 1D landscape was simply done by visualising the codebook matrix associated with the trained map.For example,the trained tissue map was visualised providing a tissue-specific view of all its eGenes,collectively forming tissue landscape.The support for the 2D landscape was achieved by using a 2D squaremap latticeto self-organise,for example,protein phenotypes,in a way that geometric location within this 2D lattice delineates the similarity between them.
Step 2:obtaining the overlaid map by overlaying additional data onto the trained map
The algorithm used for overlaying was described previously[15]but based on newly designed map shapes.The trained map overlaid with an additional(non-training)data resulted in an overlaid map that is associated with an overlaid codebook matrix.As described at Step 1,this overlaid codebook matrix was used for landscape visualisation.The correspondence between input data and additional data was measured as Pearson’s correlation coefficient using the codebook matrix associated with the trained/overlaid map.
Step 3:identification of gene clusters from the trained map
We generalised a region-growing algorithm[15]to partition the trained map into gene clusters,each of which is continuous over the map.
Step 4:by-cluster summary of the overlaid map
The summary was calculated based on the overlap map(obtained at Step 3)by averaging values over each continuous cluster(identified at Step 2).
Step 5:enrichment analysis of identified clusters
The enrichment analysis was based on f isher’s exact test.This type of analysis can be conveniently renamed according to the knowledge used.Based on f isher’s exact test(two-tails),we performed curated gene set analysis and evolutionary analysis to identify both enrichments and depletions for gene clusters.We curated gene sets,including the developmental disorder genes from Developmental Disorders Genotype-to-Phenotype(DDG2P;1724 genes mapped to EntrezGene;the same hereinafter)[16],ExAC LoF intolerance genes(3160 genes)[5],genes reported in the genome-wide association study(GWAS)Catalogue(5122 genes)[17],phenotype genes annotated using human phenotype ontology(HPO;3522 genes)[18],and Online Mendelian Inheritance in Man(OMIM)disease genes(4212 genes)[19].Evolutionary analysis for these gene clusters was based on 16 phylostrata,each representing a group of genes that appeared at a specific ancestor[6].These phylostrata are ordered by the evolutionary history:Cellular organisms(1715 genes),Eukaryota(4525 genes),Opisthokonta(276 genes),Metazoa(1912 genes),Eumetazoa(1152 genes),Bilateria(1090 genes),Chordata(308 genes),Euteleostomi(2693 genes),Amniota(532 genes),Mammalia(512 genes),Theria(580 genes),Eutheria(731 genes),Euarchontoglires(119 genes),Catarrhini(211 genes),Homininae(252 genes),and Homo sapiens(25 genes).Based on f isher’s exact test(on-tail),we performed pathway analysis and druggable analysis to identify enrichments only.Pathway analysis was performed using Reactome pathways[8],and druggable analysis using DGIdb druggable gene categories[20].
Datasets from human embryos,GTEx and haploid mutagenesis screens
We obtained human embryo transcriptome datasets involving 5441 differentially expressed genes/probesets and 6 successive developmental stages with three replicates for each stage[13].We obtained 7890 eGenes(qvalue<0.05)in brain subregions and the whole blood from GTEx(version 6p)[2].Positive regulators for 11 protein phenotypes(FDR<0.05;1321 genes in total)were obtained according to studies using a random mutagenesis-based haploid screen[3,4].All these datasets were used as input data for training.
Def inition of loss-of-function(LoF)intolerant genes
We obtained LoF intolerant genes from the Exome Aggregation Consortium[5],defined as genes having at least 90%probability of LoF intolerance.This resulted in a statusvector involving 17,568 genes,with 1 for LoF intolerance and 0 otherwise.This vector was used as additional data for overlaying.
Phenotypic effects and expression levels of regulators
For each regulator identified by a random mutagenesis-based haploid screen[3,4],we defined phenotypic effects as the number of phenotypes that this regulator was declared significant(FDR<0.05).Its expression level was calculated as median of RNA-seq data of 10 independent wild-type HAP1 cells[3].These continuous values were used as additional data for overlaying.
Results and discussion
Overview of intuitive integrative interpretation(I3)
I3is designed as a general and f lexible workf low(Figure 1A)enabling map-centric intuitive interpretation of input data,allowing for integration with additional(relevant)data and knowledge discovery with annotation(built-in)data.As a general workf low,it can be used to interpret any input data(a numeric matrix containing,for example,genes in rows and measures in columns).As a f lexible workf low,it can integrate any relevant additional data(also provided by the user)and provides built-in annotation data(such as evolution and pathways)for knowledge discovery.I3outputs rich visuals for intuitive interpretation,including landscape visualisation,correspondence between input and additional data,and identification of clusters and enrichments.
At the core ofI3is the self-organising learning.In the literature,a number of tools have been reported for similar purposes,includingSOM Toolbox[21],Cluster 3.0[22],and two R packages(kohonen[23]andsupraHex[15]).Amongst these,SOM Toolboxis widely used but requires the commercial license(MATLAB).Cluster 3.0supports the graphical user interface but suffers from output visualisation.Both packageskohonenandsupraHexare open source and similar in the use and visualisation.A major limitation of current toolsisthat all of them are limited in the choice of map shapes.All butsupra-Hexsupports the sheet-like map only.This is essential for modeling input data of diverse or unknown shapes.To illustratethis point,we used human embryo transcriptomedatasets[13]and compared the trained map of different shapes.This data involves six successive developmental stages.We already know there are two groups of genes,displaying gradually reduced or gradually increased expression patterns;suchprioriknowledge can be used to assess the performance.PCA revealed two highly dense regions/centres of genes;for this we devised a butterf ly-like map(Figure S1A).In doing so,we found that two groups of genes were nicely separated and mapped to each of two wings(Figure S1B).As comparisons,we also modeled the same data based on the sheet map and found that the separation boundary is less clear(Figure S1C).
I3consists of f ive steps(Figure 1A):training the map using the input data in a self-organising manner but constrained by the map shape(Step 1),obtaining the overlaid map by overlaying additional data onto the trained map(Step 2),identification of gene clusters from the trained map(Step 3),the bycluster summary of the overlaid map(Step 4),and enrichment analysis of identified clusters using annotation data(Step 5).In this study,without loss of generality we applied theI3workf low to interpret two complex genetic datasets.Figure 1B gives a summary of data used to interpret eQTL genes(eGenes)in brain tissues mainly regarding LoF intolerant genes and genes at different evolutionary ages,while Figure 1C interprets genetic regulators mainly regarding protein phenotypic effects,gene expression and LoF intolerance.
Interpreting genetics of gene expression in brains
The Genotype-Tissue Expression(GTEx)project identified genetic variants associated with expression of genes(eGenes)in a tissue-specific manner[2].Here we illustrate the power ofI3in interpreting eGenes found in 10 brain subregions(and the whole blood as comparisons)with respect to their selective pressure against mutations(Figure 2A).An eGene for a tissue was defined if its expression is significantly regulated by a variant,measured by the q value.A gene under selective pressure was defined if extremely intolerant to LoF mutations.
A diamond-shaped map models tissue-specific eGenes in brains
We prepared the input data matrix with an eGene(in rows)found in a tissue(in columns),in which we observed a diamond-like shape of distribution(Figure S2A).Based on this,we designed a diamond-shape map and trained it by the input data via the self-organising learning algorithm.We visualised the trained map as the tissue landscape(Figure 2B),identifying the similar maps between brain tissues that show sharp difference as compared to the one seen in the whole blood.We also designed a triangle-shape map for comparisons and observed the more constrained distribution for eGenes,suggesting that this shape is less effective in completely unfolding input data(Figure S2C).
Thetrained tissue map isoverlaid to producethe LoFintolerance map(Figure 2C)
By comparing the tissue landscape and the LoF intolerance map,we found that all brain tissues negatively correlated with LoF intolerance;this autocorrelation is a much stronger than that seen in the whole blood(Figure S2B).
The trained tissue map is divided into gene clusters for knowledge discovery
We obtained a total of 9 gene clusters(C1—C9)from the tissue landscape(Table S1),each covering continuous regions(Figure 2D)and summarised by the probability of containing LoF intolerant genes(Figure 2E).We observed that tissuespecific eGenes in C3—C5 had a high probability of containing LoF intolerant genes,and a low probability for tissue-sharing eGenes in C8—C9.Enrichment analysis using curated gene sets conf irmed this observation;we found that C3—C4 significantly enriched for LoF intolerant genes and C8—C9 significantly depleted of LoF intolerant genes(Figure 2F).We also observed enrichment for phenotype genes and disease genes in C8—C9,and developmental disorder genes enriched in C9 only.Notably,C9 contains eGenes shared by all brain tissues(not in the wholeblood),least under selective pressure.To fortify the above findings,we also performed evolutionary age analysis.We found a preference of genes in C2—C3 to be created at our ancestor Eumetazoa or earlier,and these genes are unlikely to be created at our ancestor Chordata or later(Figure2G).By contrast,wedid not observesuch evolutionary origin preference for genes in C7—C9.Based on the trained map in brains,we produced the map for other tissues(Figure S3A).For the clusters C8—C9 mostly depleted of LoF intolerant genes,wefound the majority of tissues haveeGenes.We also revealed that tissues(such as subcutaneous adipose,tibial artery,transformed f ibroblasts,muscular esophagus,lung,skeletal muscle,tibial nerve,skin and thyroid)had a much higher number of eGenes.Collectively,I3reveals that LoF intolerant genes are depleted of tissue-sharing genetics of expression(not just in brains but most of other tissues;such relationship is more consistent for brain-derived tissues),and there exists a preference in their evolutionary origin.Without selective pressure in population and/or in evolution seems to be prerequisite for a gene causing diseased phenotypes and even developmental disorders.
Integrative interpretation of genetic regulators of protein phenotypes

Figure 2 Genetics of gene expression in brain tissues

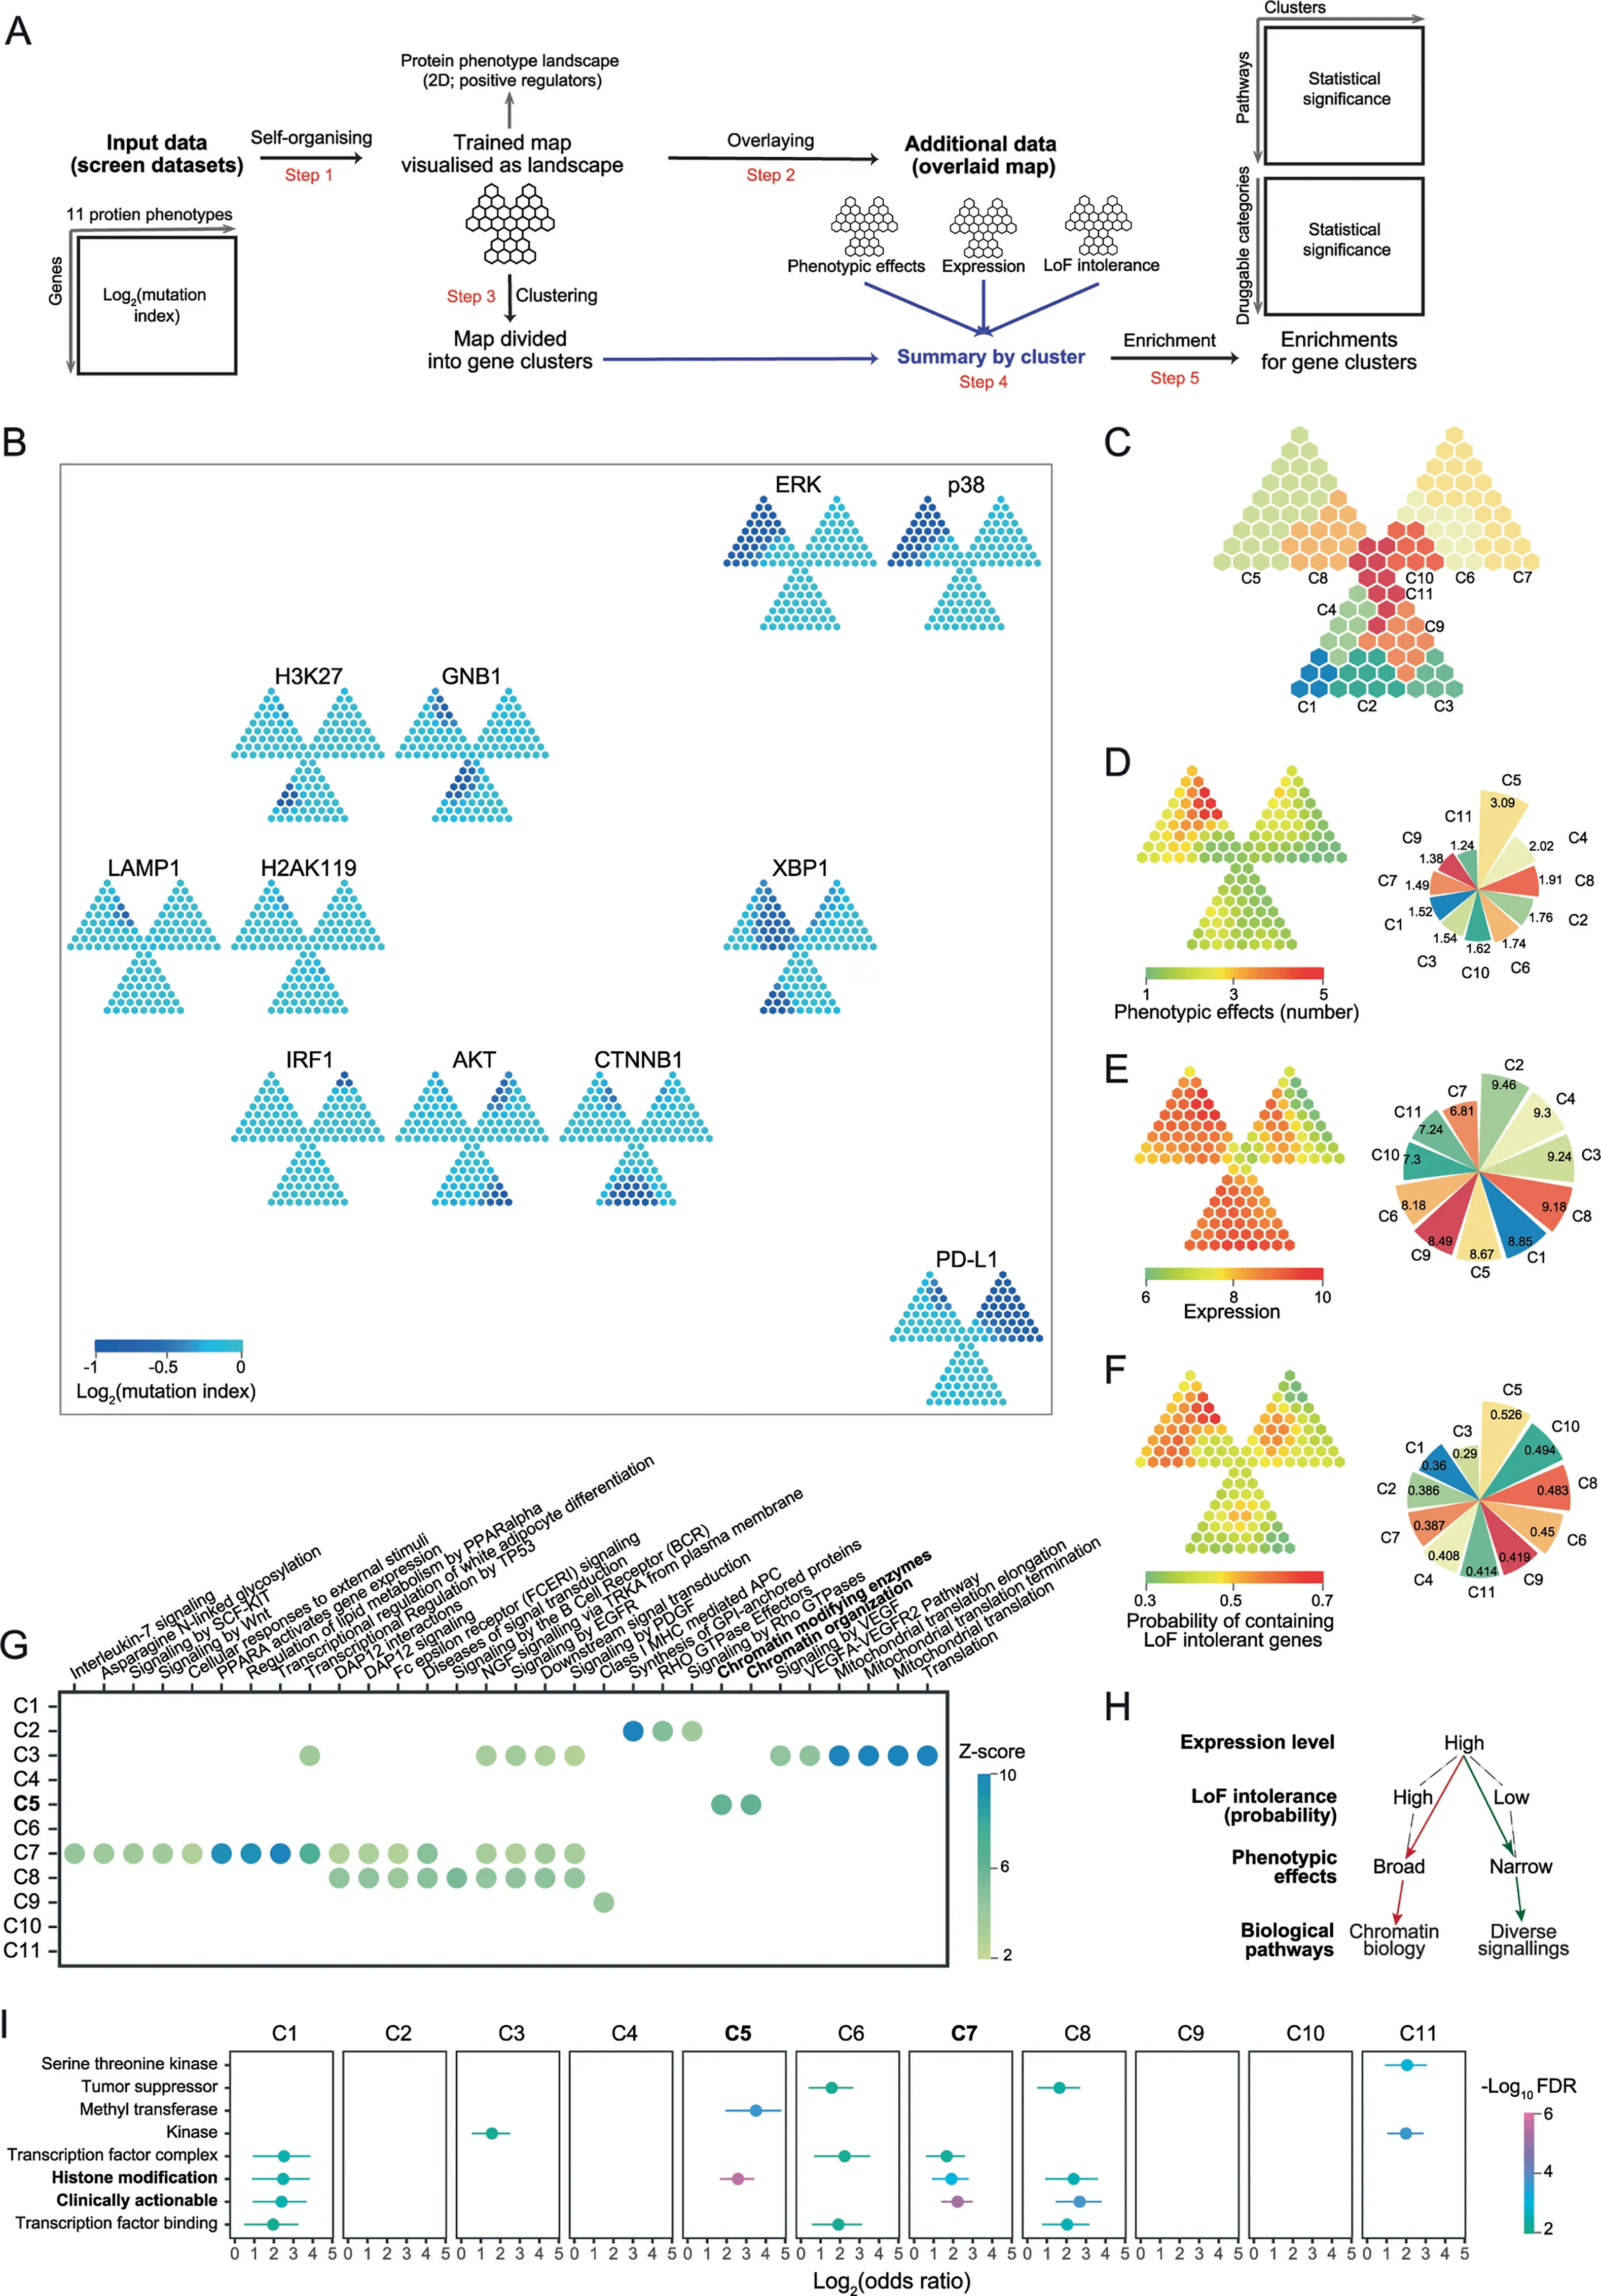
Figure 3 Genetic regulators of protein phenotypes
Haploid genetic screens are new techniques identifying genetic regulators of protein phenotypes by introducing random mutagenesis into haploid cells and linking such mutations to protein states as phenotypic readouts[3,4].We here demonstrate the utility ofI3in understanding positive genetic regulators with respect to three factors:phenotypic effects,expression and LoF intolerance based on a trefoil-shape map(Figure 3A and Figure S4).The 2D landscape of protein phenotypes reveals information on both phenotypes and regulators(Figure 3B).Phenotypes with the similar regulator prof ile(e.g.,phosphorylated ERK and p38)are placed together,and far away for phenotypes with a very different prof ile(i.e.,PD-L1).Phenotype-sharing regulators are mostly mapped onto the top-left leaf of the trefoil,more precisely,gene cluster 5(C5 in Figure 3C;Table S2).Indeed,regulators in C5 had broadest phenotypic effects(Figure 3D).The previousstudy showed that genes with high expression levelstend to be genetic regulators of protein phenotypes[3].To further explain this,we examined the relationship between expression levels and phenotypic effects.Weobserved that regulatorswith high expression(Figure 3E)could have both broad phenotypic effects(C5)and narrow effects(C1—C4 and C8).WithI3,we found that regulators in C5 had higher probability of containing LoF intolerant genes than those seen in C1—C4 and C8(Figure 3F).We also found enrichment of chromatin biology in C5(Figure 3G);this is consistent with the fact that ERK and p38(important players in MAPK cascades)have broad regulatory impacts in gene expression and thus strong regulation on chromatin-related genes[24].Interestingly,pathways(e.g.,signaling by EGFR)relevant to MAPK were not enriched in C5,implying the more complex genetic regulation involving these pathways than previously thought in the classical‘EGFR-EGF-RAS-RAF-MEK-ERK’axis.For clusters C2—C3 and C8,enrichment of diverse signallings was observed(Figure 3G).Taken together,I3reveals a putative model,that is,the LoF intolerance may act asa latent factor explaining the relationship between expression levels and phenotypic effects(Figure 3H).Beyond interpretation,we also explore the pharmaceutical use of genes identified by genetic screens,that is,to evaluate the druggability for each gene cluster.The top druggable gene category is‘histone modification’enriched in C5(BAZ1B,DOT1L,EED,EZH2,HCFC1,ING5,KAT7,KDM 2A,KMT2A,MECP2,PHF8,PRMT1,SETDB1,SIN3B,SUZ12,andUSP7),followed by‘clinically actionable’genes(APC,BAP1,BCL2L1,CD274,CREBBP,EWSR1,FBXW7,FLCN,GREM 1,IFNGR1,JAK1,JAK2,KDM 5C,NCOR1,NF2,NSD1,RB1,TSC1,andTSC2)in C7,a gene cluster unique to PD-L1(Figure 3I and Table S3).Given the broad phenotypic effects and high expression level in C5,we suggest those genes involved in histone modification should be given a high priority for follow-up in experiments.
Conclusion
TheI3workf low is implemented in the R running environment,an open source platform that is widely used,and thus can reach the wide audience.The workf low is designed in a non-linear and intuitive way(Figure 1)with the focus on the f lexibility rather than the easy-to-use interface;this is one of current limitations that should be overcome in the future,for example,by developing a web server to removethedependency on R.Another future effort is to automate the selection of the map shape or to explore other ways(beyond PCA)doing so;for example,in a less visual-aided way f ine-tuning the specific parameters.Nonetheless,we have demonstrated the value of this workf low.Interpreting genetics of gene expression reveals a lack of selective pressure for tissue-sharing eGenes in brains.Interpreting genetic regulators of protein phenotypes points to the importance of LoF intolerance in bridging expression levels and phenotypic effects.Both applications are achieved in relatively short runtime(the training f inished in seconds using one core on Mac OS X).To conclude,I3provides an integrated solution to complex genetic datasets for downstream interpretation and knowledge discovery.
Availability
I3is available at http://suprahex.r-forge.r-project.org/I3.html.
Authors’contributions
YT performed the analysis and revised the manuscript.LJ revised the manuscript.KW conceived the project,contributed to the interpretation and edited the manuscript.HF conceived theproject,performed theanalysisand drafted themanuscript.All authors read and approved the final manuscript.
Competing interests
The authors have declared no competing interests.
Acknowledgments
We thank anonymous reviewers for constructive comments.This work was supported by the National Natural Science Foundation of China(Grant No.31301041 awarded to HF,and Grant Nos.81530003 and 81770153 awarded to KW).
Supplementary material
Supplementary data to this article can be found online at https://doi.org/10.1016/j.gpb.2018.10.006.
杂志排行
Genomics,Proteomics & Bioinformatics的其它文章
- In Memory of Vladimir B.Bajic(1952—2019)
- Deep Learning Deciphers Protein—RNA Interaction
- DeepCPI:A Deep Learning-based Framework for Large-scale in silico Drug Screening
- Gclust:A Parallel Clustering Tool for Microbial Genomic Data
- CIRCexplorer3:A CLEAR Pipeline for Direct Comparison of Circular and Linear RNA Expression
- CircAST:Full-length Assembly and Quantification of Alternatively Spliced Isoformsin Circular RNAs
