Possibility of Socio-economic Attributes and ICT Application in Improving Quality of Farmers
2019-02-18,,,,,,
, , , , , ,
1. Agricultural Information Institute, Chinese Academy of Agricultural Sciences, Beijing 100093, China; 2. Department of Agricultural Extension and Communication, PMAS Arid Agricultural University, Rawalpindi 46000, Pakistan; 3. Institute of Apicultural Research, Chinese Academy of Agricultural Sciences, Beijing 100093, China; 4. Department of Agricultural Extension & Rural Development, University of Agricultural, Sargodha 40100, Pakistan
Abstract Evaluation on the diversified Information and Communication Technologies (ICTs) application along their association in socio-economic attributes can provide valuable insights about the trends of farmers towards improvement. Therefore, analytical research design and descriptive statistics were used to analyze the data collected from 400 respondents within different regions of Punjab Province in Pakistan. Based on the findings, it is recommended that government in collaboration with all stakeholders should launch regular, holistic and modern ICTs programs like applications of robo calls, SMS, etc. services at central level to ensure timely availability of agricultural information to improving the quality of young farmers. Furthermore, it is recommended to launch effective monitoring and evaluation mechanism of ICTs for agricultural development.
Key words Demography, Farmers, Information and Communication Technologies (ICTs), Information sources, Pakistan
1 Introduction
Agricultural sector has a major capacity in poverty reduction, ensuring food security, and is responsible for anticipated revolution by provision of sustainable livelihoods to the farming community and rural development through strengthening their economy[1-3]. The dilemma of information plays a central role in firming farmer’s daily decision making related to farmers initiative by enhancing their knowledge regarding latest technology and market information. In nearly every phase of the agricultural production and different situation, farmers take a number of particular decisions[4].
Information and communication technologies (ICTs) application is a revolutionary mode for the agricultural development, and it is a dynamic part of the economy. With the enhancement in communication technologies and its appliance, extension and rural advisory services are going to be more contingent on ICTs so as to flourish in more efficient, apposite and pioneering ways for delivery of agro-based advanced technologies to the end-users. Information and technologies-based extension and advisory services perform play an energetic role in provision of agricultural information and knowledge for farming community. Keeping in sight the consequence of ICTs in overall agricultural advancement, it is crucial to stimulate ICTs based agricultural information dissemination to enrich agricultural productivity on one hand and to deliver sustainable agricultural information provision mechanism on other hand[5-6].
ICTs are classified into three categories. (i) Very old ICTs: group of technologies which,have been used for several decades and include human interactions, printed materials (publications, newspapers, books, pictures, poster, theatreetc.), markets and plays. (ii) Old ICTs: including radio, television, telephone, audio and video cassettes, films and slides. (iii) Modern/ New ICTs: including one-on-one connections, mobile phone, internet, video conference and computer satellitesetc.[7]. Above all, modern ICTs services and applications-based technology transfer system have conceded around a fundamental shift in form of communication[8].
A very complex and critical procedure in sources of agricultural information is the application of information and communication technologies. It comprises numerous phases and dynamics at farmer’s level. Out of these aspects, socio-economic profile of farmers played a projecting position in application process. Numerous studies have been conducted to explore socio-economic issues influencing behavior of farming community concerning ICT based agricultural extension services, approaches and further social activities. Diversified demographic attributes have been thought to be influenced by intellectual, social and economic variation linked with behavior[9]. These aspects may furthermore be capable for different strategies to stimulate approval of ICT concerned agronomic practices between farmers for support in enhancing farm productivity and sustainability in agriculture[10]. In this concern, the present research was directed to investigate the association between socio-demographic profile and communication characteristics of the farmers with the extent of use of ICTs.
2 Materials and methods
Research methodology is mode of systematic and logical planning for conducting a particular research[11]. Moreover, it explicates the association among phenomena and understanding level of the scholar in study[12-15]. The methodology of the present research was established on descriptive survey. The "survey method" was used for data collection[16]. This type of method plays fundamental role in social research and provides information from sundry prospective[17]. This research is most appropriate for obtaining people’s perception on socio-economic facts. This method describes the features or comportment of a certain population in an organized and precise fashion[18].
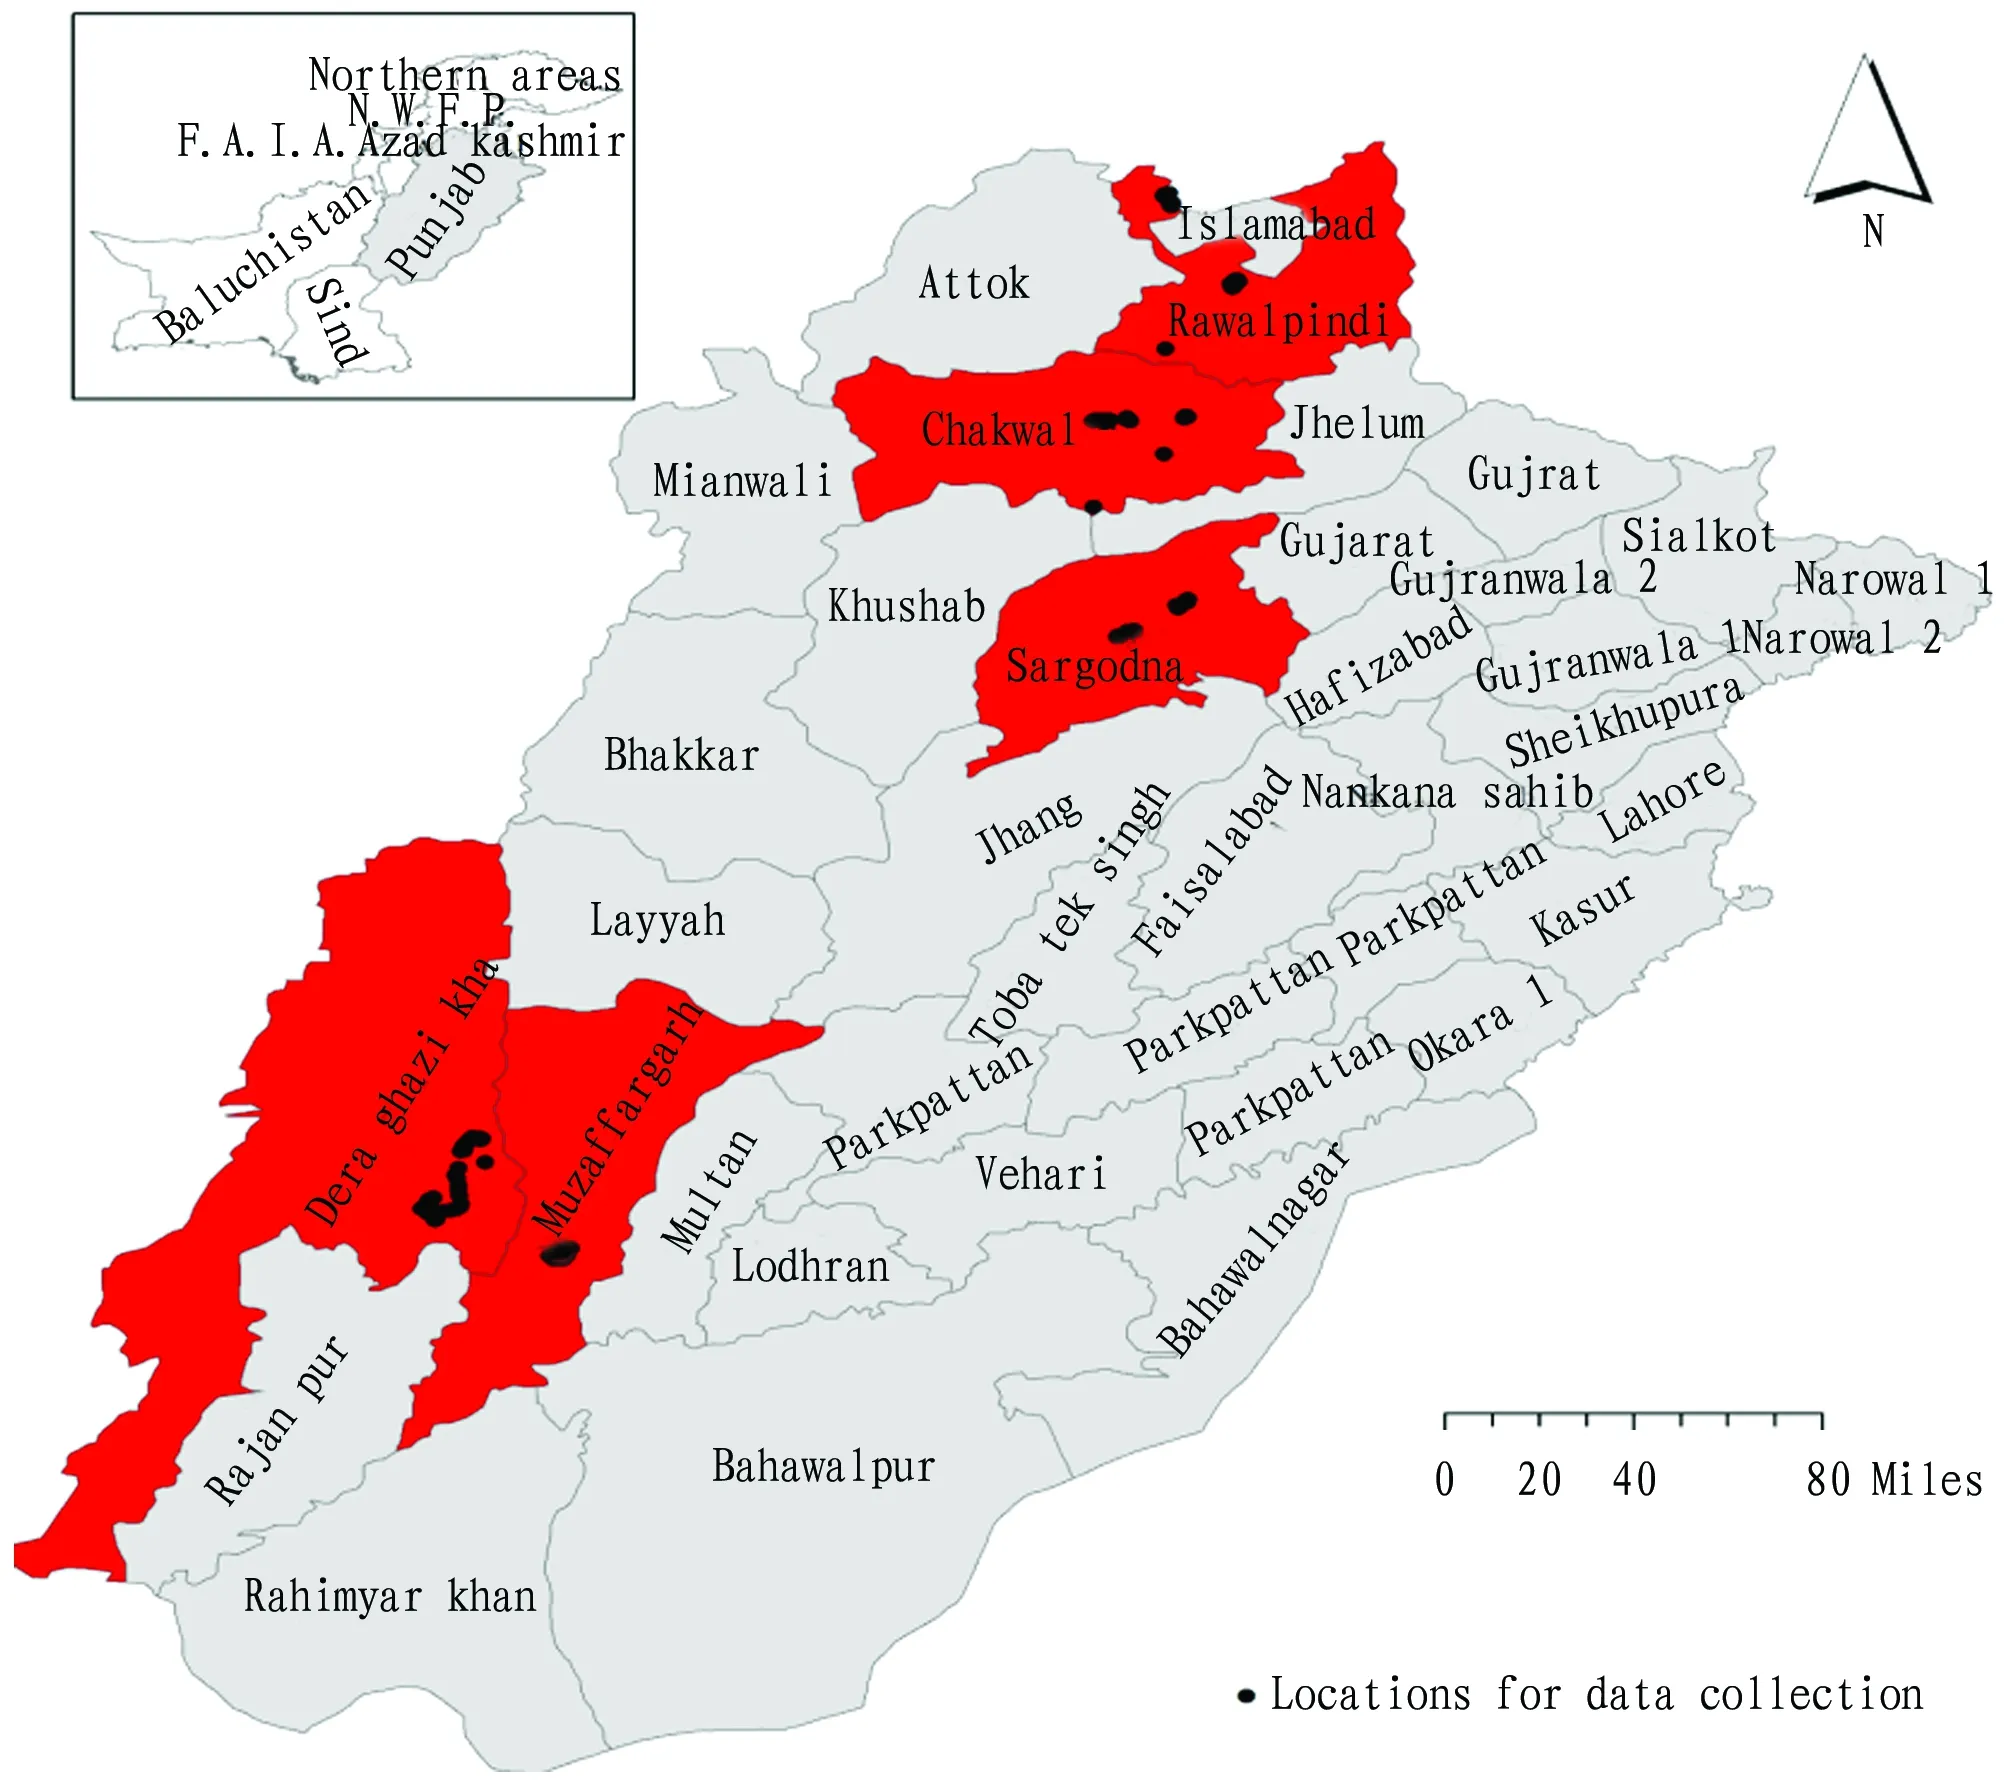
The target population for the research was rural farming community of Pakistan. Punjab Province was selected purposively as this province has major contribution in Pakistan’s agriculture also largest in population having more than 53% of country’s total population, second largest area by land having multiplicity of crops and livestock in various ecological regions[19]. There are 36 districts of Punjab Province, from which 5 districts, namely, Dera Ghazi Khan, Muzaffargarh, Sargodha, Chakwal and Rawalpindi were selected randomly for data collection (Fig. 1). From each selected district, 2 tehsils were selected by using simple random sampling technique; from each selected tehsil, 2 villages were selected randomly and from each village, 20 farmer households were selected by using simple random sampling technique. Hence a total of 400 farmer households were selected as a sample of the research study on random basis.

Note: red color area represents selected districts.
Fig. 1StudysiteofPunjabProvinceofPakistan
The present research was based on data collection through validated and pre-tested interview schedule. The most important step of the study was interviewing the respondents and accuracy of the data collection site. For this purpose, researcher interviewed all the respondents personally at their homes, farms or working place and took the coordinates of each data collection site (Fig. 1) by using device GPS version German eTarexR 201x. Although the interview schedule was prepared in English, considering the educational level of farmers, questions were asked in Saraiki, Punjabi, Potohari (local languages) and Urdu (national language) as well to get the required quality information with the maximum degree of accuracy.
Quantitative data was statistically analyzed by using computer software program Statistical Package for Social Sciences (SPSS). Descriptive statistics such as frequencies, percentages, Karl Pearson’s coefficient of correlation were used to analyze the data for meaningful interpretation.
3 Results and discussions
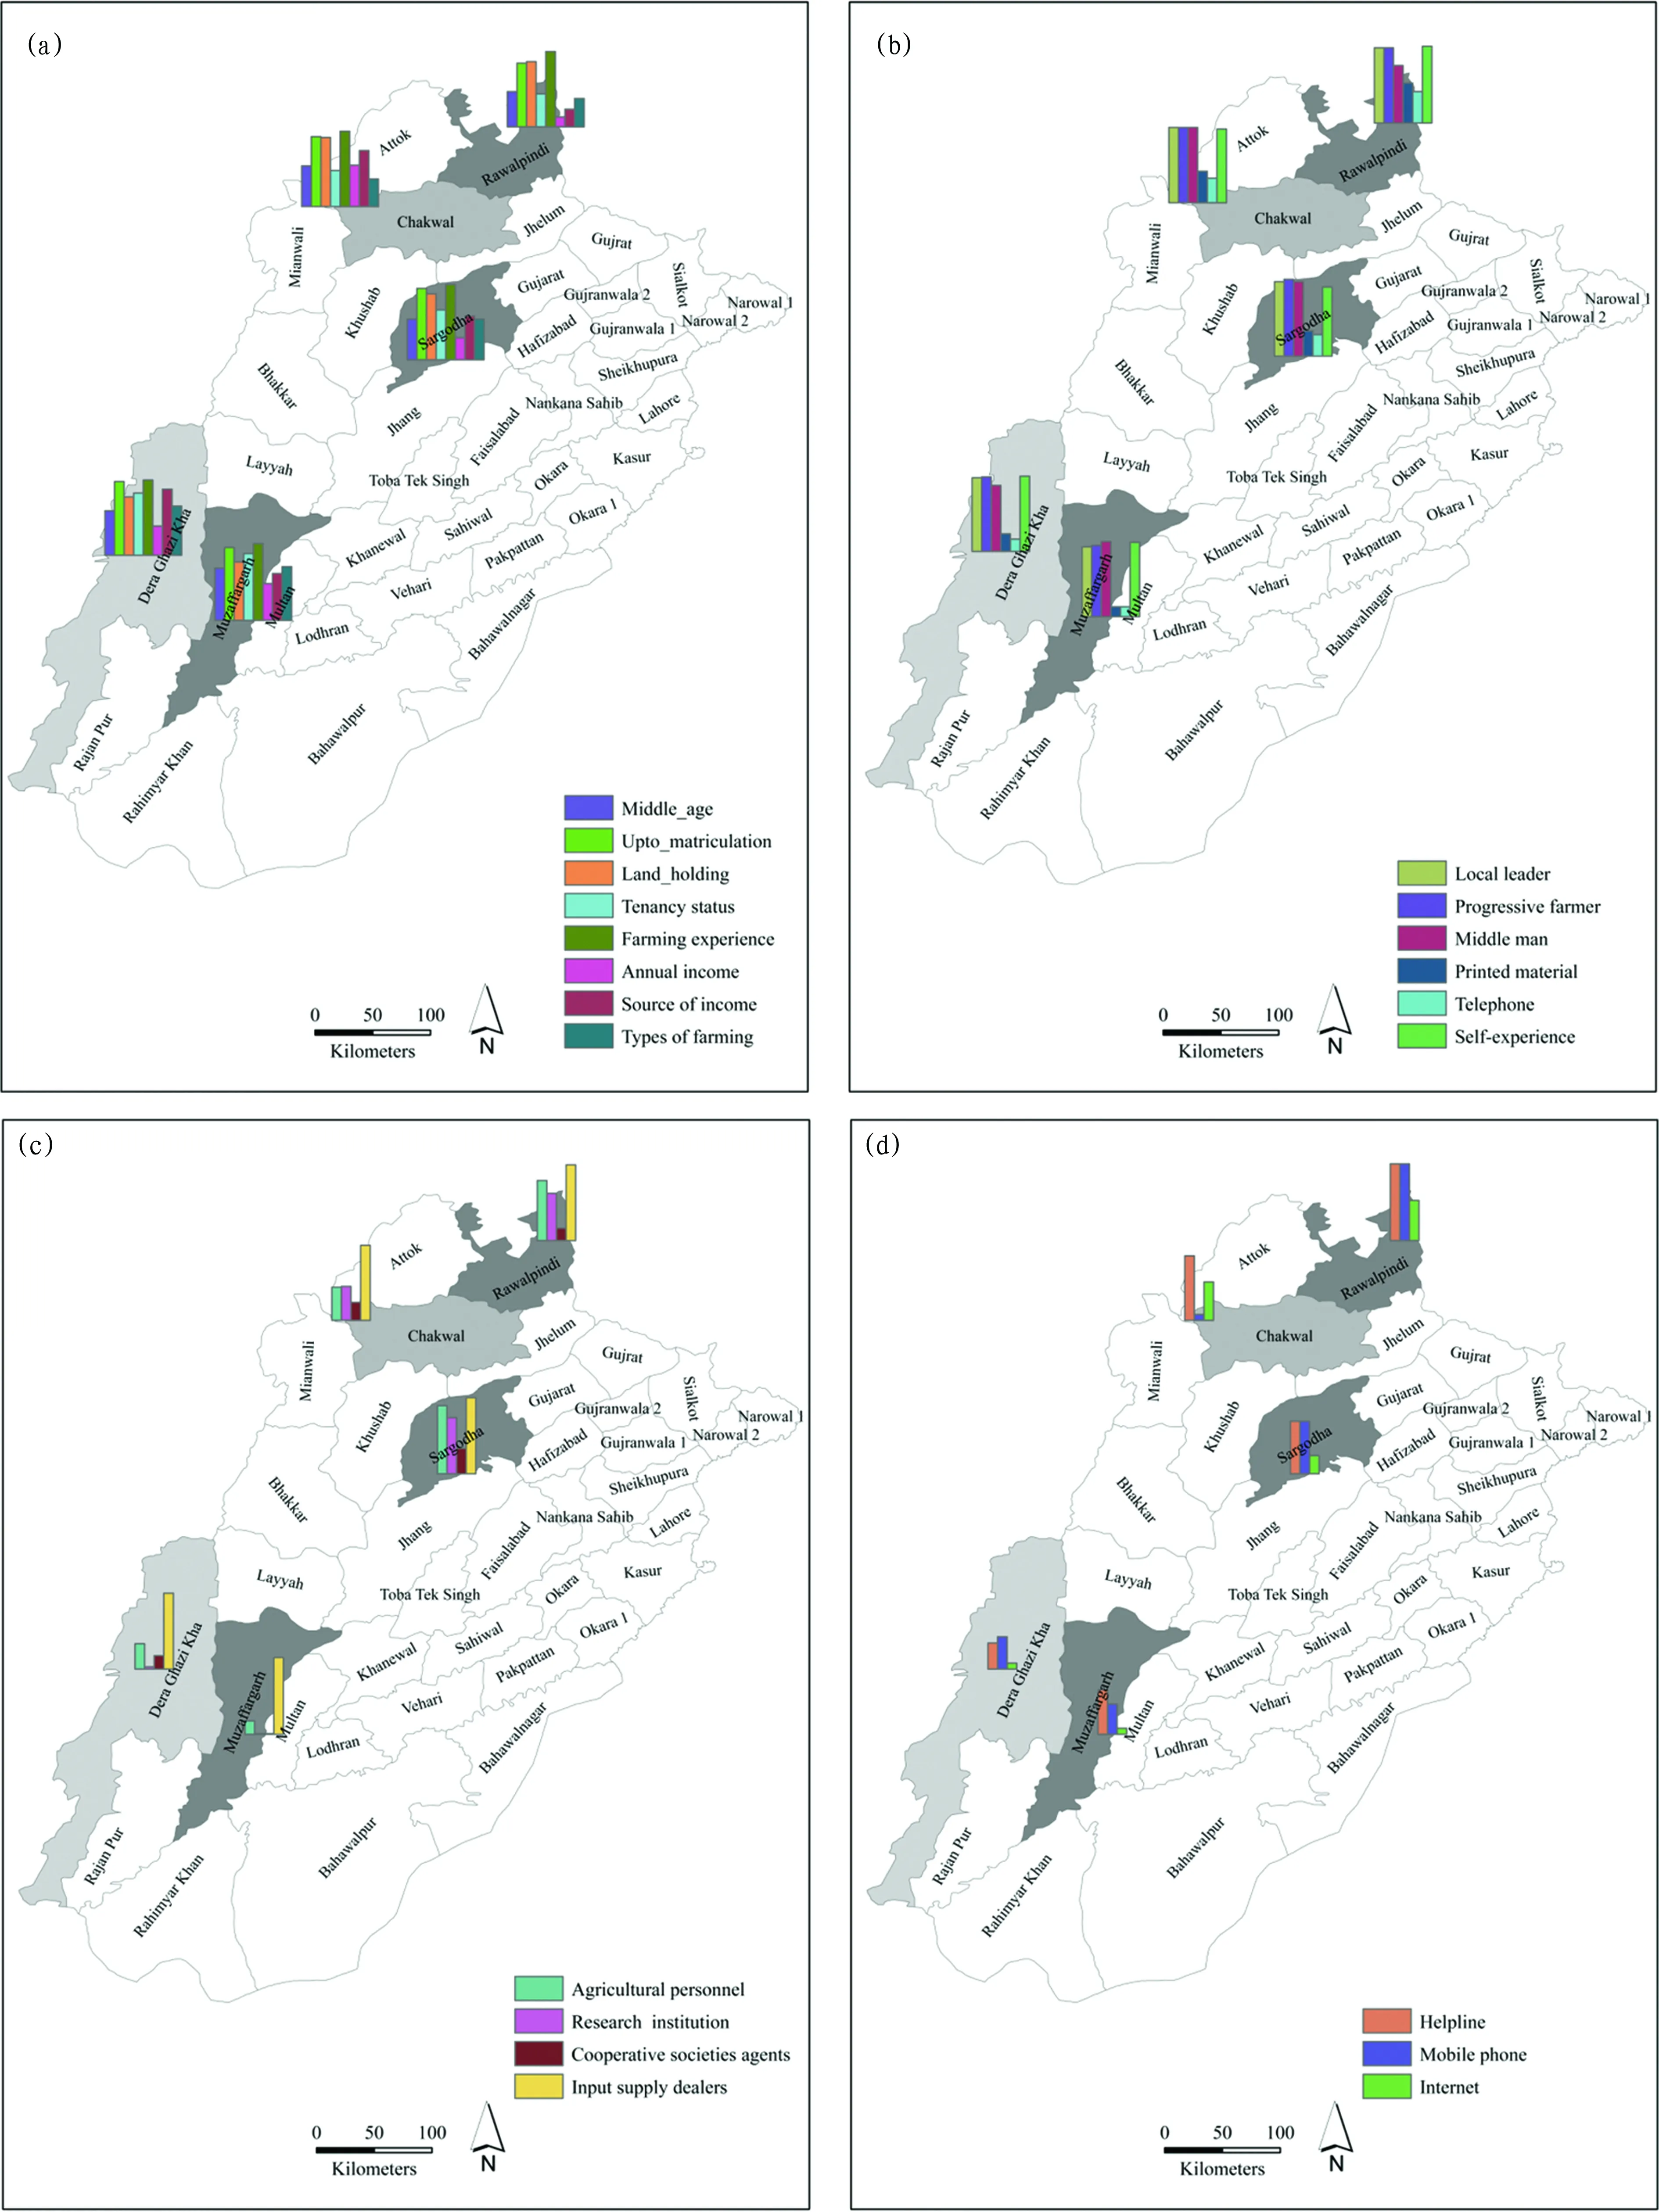
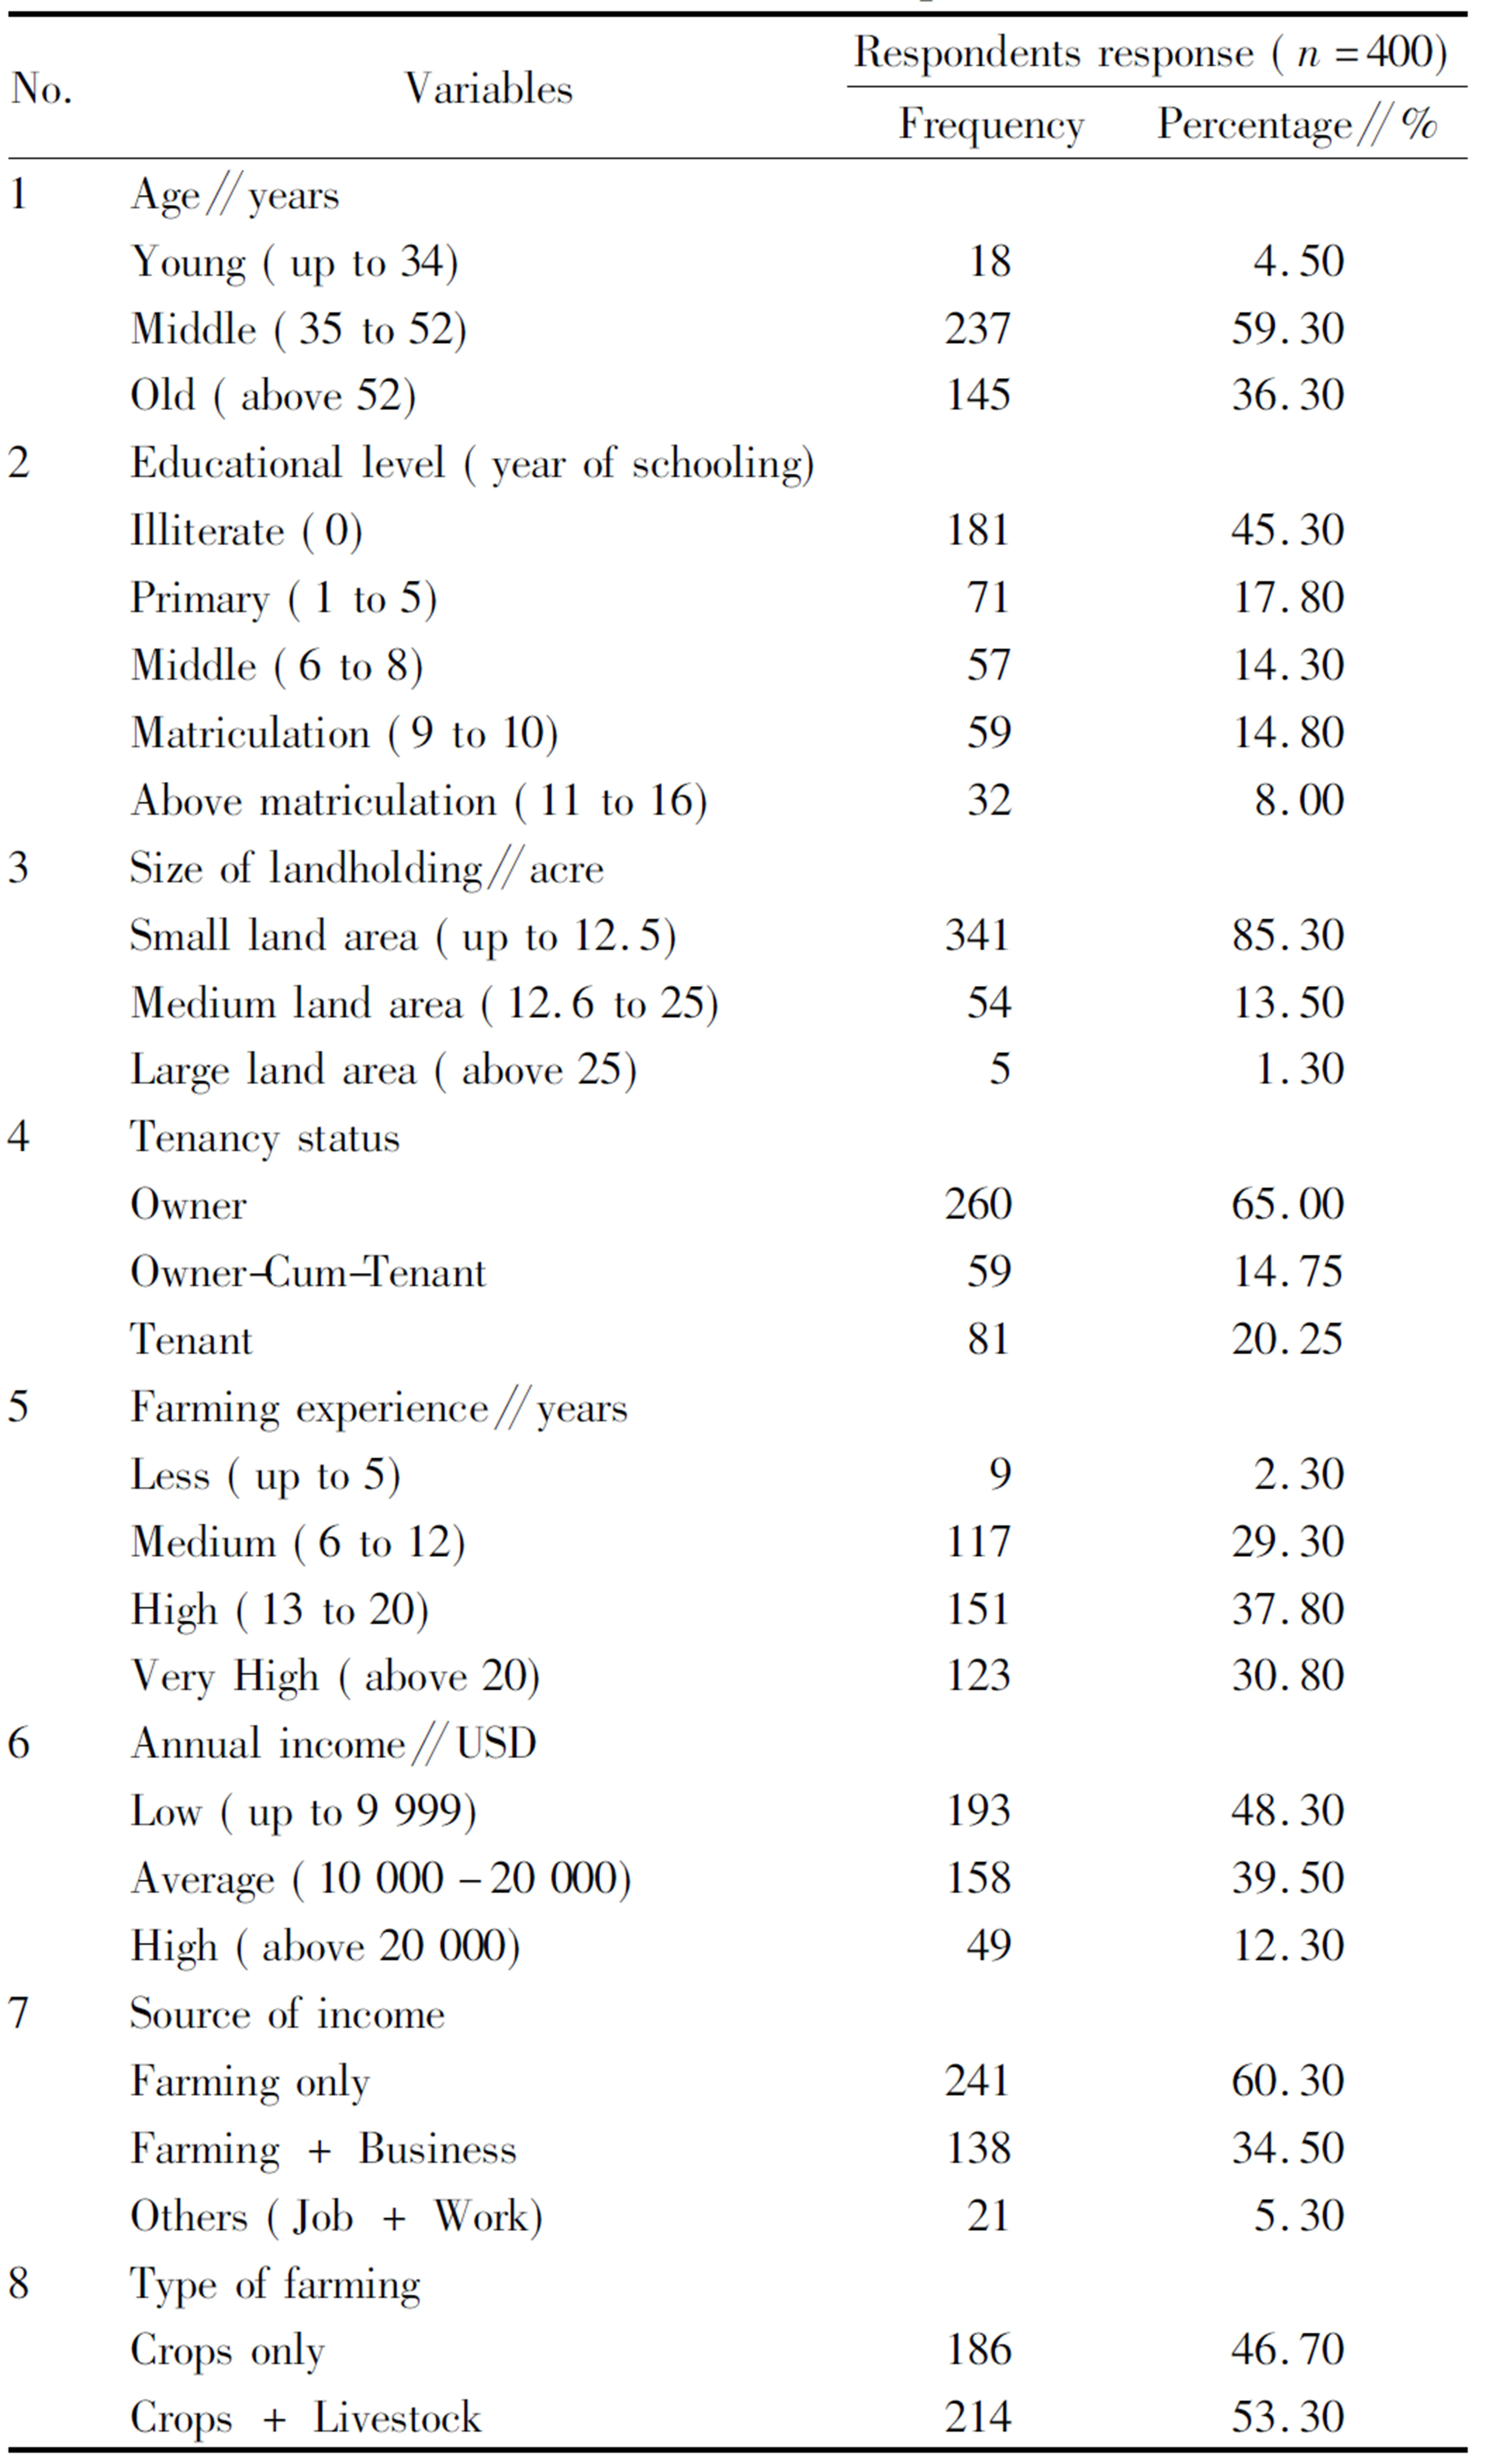
3.1Socio-economicprofileofthefarmersCollectively, the findings of the present study depicted that simple majority of the respondents belonged to the middle age and only 5% belonged to the young age category in Table 1. However, simple majority of farmers from four districts were middle age category except Rawalpindi where less than 50% belonged to same class in Fig. 2a. These results are in conformity with the report that majority of the respondents have its place to middle age category[20].
The current exploration revealed that less than half of the respondents were illiterate and among literate only 8% had educational level above matriculation collectively in Table 1. Whereas, slightly more than half of the respondents were reported with lower educational level from all districts in Fig. 2a. Amongst all demographic characteristics of the farmers, the information about their ages and educational levels are most important. Because these two attributes of the farmers play a very essential role in the application or rejection of innovation and attitude change[21].
In addition to the above attributes, other attributes obtained from the respondents included factors relating to their lands, tenancy status, farming experience, their incomes, sources of income as well as types of farming. The data auxiliary highlights that majority (85.3%) of the respondents had up to 12.5 acres land area and only five farmers (1.3%) within whole five districts showed to have > 25 acres land area in Table 1. Moreover, only within Chakwal district, 90% of the farmers have up to 12.5 acres in Figure 2a. This is contradictory with the report that 42.6% of the respondent had size of landholding up to 12.5 acres, followed by 23% of the respondents who owned above 15 acres of land[22].
The present overall outcomes further showed that simple majority (65%) of the respondents were owner. However, owner-cum-tenant and tenant were found less than 20% respectively. From district prospective majority of the respondents reported owner except Chakwal and Rawalpindi district where less than half have same category in Fig. 2a. These results are more or less similar to the findings of the study that simple majority (58.3%) of the respondents fell in owner cultivator category followed by 22.5% and 19.2% of the respondents who fell in owner-cum-tenant and tenant categories respectively[23].
According to research judgments as a whole very low percentage informed against farming experience up to 5 years. Whereas, overwhelming majority had vast farming experience in Table 1. Similar circumstance was shown in all 5 districts (Fig. 2a). Largely almost half (48.3%) of the respondents had low (up to 9 999 USD) annual income. From the others, nearly 10% had high (above 20 000 USD) annual income in Table 1. Nevertheless, only 30% of the respondents had their low annual income category reported by Rawalpindi district in Fig. 2a. The findings of the study are in contrast with the study that majority of the respondents belong to medium family income[20].
In poverty reduction and improving the living standard of the farming community, source of income plays a more significant role than farming contribution[24]. Non-farm sources have a significant relation with the effect of media information on the application of latest agricultural innovation concluded by the study[25]. Whereas, the present research generally indicates that the majority (60.3%) of the respondents had farming only as a source of income and the remaining 5.3% had farming (job + work) category in Table 1. However, from the district point of view only 22.5% reported farming category from all in Fig. 2a. These results are more or less similar tothat the findings of the study[26]that 48.6% of the respondents earn income from private-public services other than farming. Moreover, the present findings illuminate that more than half of the respondents had crop + livestock type of farming respectively on their land in general in Table 1 and more than 70% reported in Muzaffargarh district with the same type of farming in Fig. 2a.

Note: (a) demographic characteristics, (b) application of very old ICTs, (c) application of old ICTs, (d) application of modern ICTs.
Fig. 2Socio-economicprofileofthefarmersinthestudyareaofPakistan
Table1Socio-economicattributesoftherespondents

No.VariablesRespondents response (n=400)FrequencyPercentage∥%1Age∥yearsYoung (up to 34)184.50Middle (35 to 52)23759.30Old (above 52)14536.302Educational level (year of schooling)Illiterate (0)18145.30Primary (1 to 5)7117.80Middle (6 to 8)5714.30Matriculation (9 to 10)5914.80Above matriculation (11 to 16)328.003Size of landholding∥acreSmall land area (up to 12.5)34185.30Medium land area (12.6 to 25)5413.50Large land area (above 25)51.304Tenancy statusOwner26065.00Owner-Cum-Tenant5914.75Tenant8120.255Farming experience∥yearsLess (up to 5)92.30Medium (6 to 12)11729.30High (13 to 20)15137.80Very High (above 20)12330.806Annual income∥USDLow (up to 9 999)19348.30Average (10 000-20 000)15839.50High (above 20 000)4912.307Source of incomeFarming only24160.30Farming + Business13834.50Others (Job + Work)215.308Type of farmingCrops only18646.70Crops + Livestock21453.30
Source: field survey, 2017.
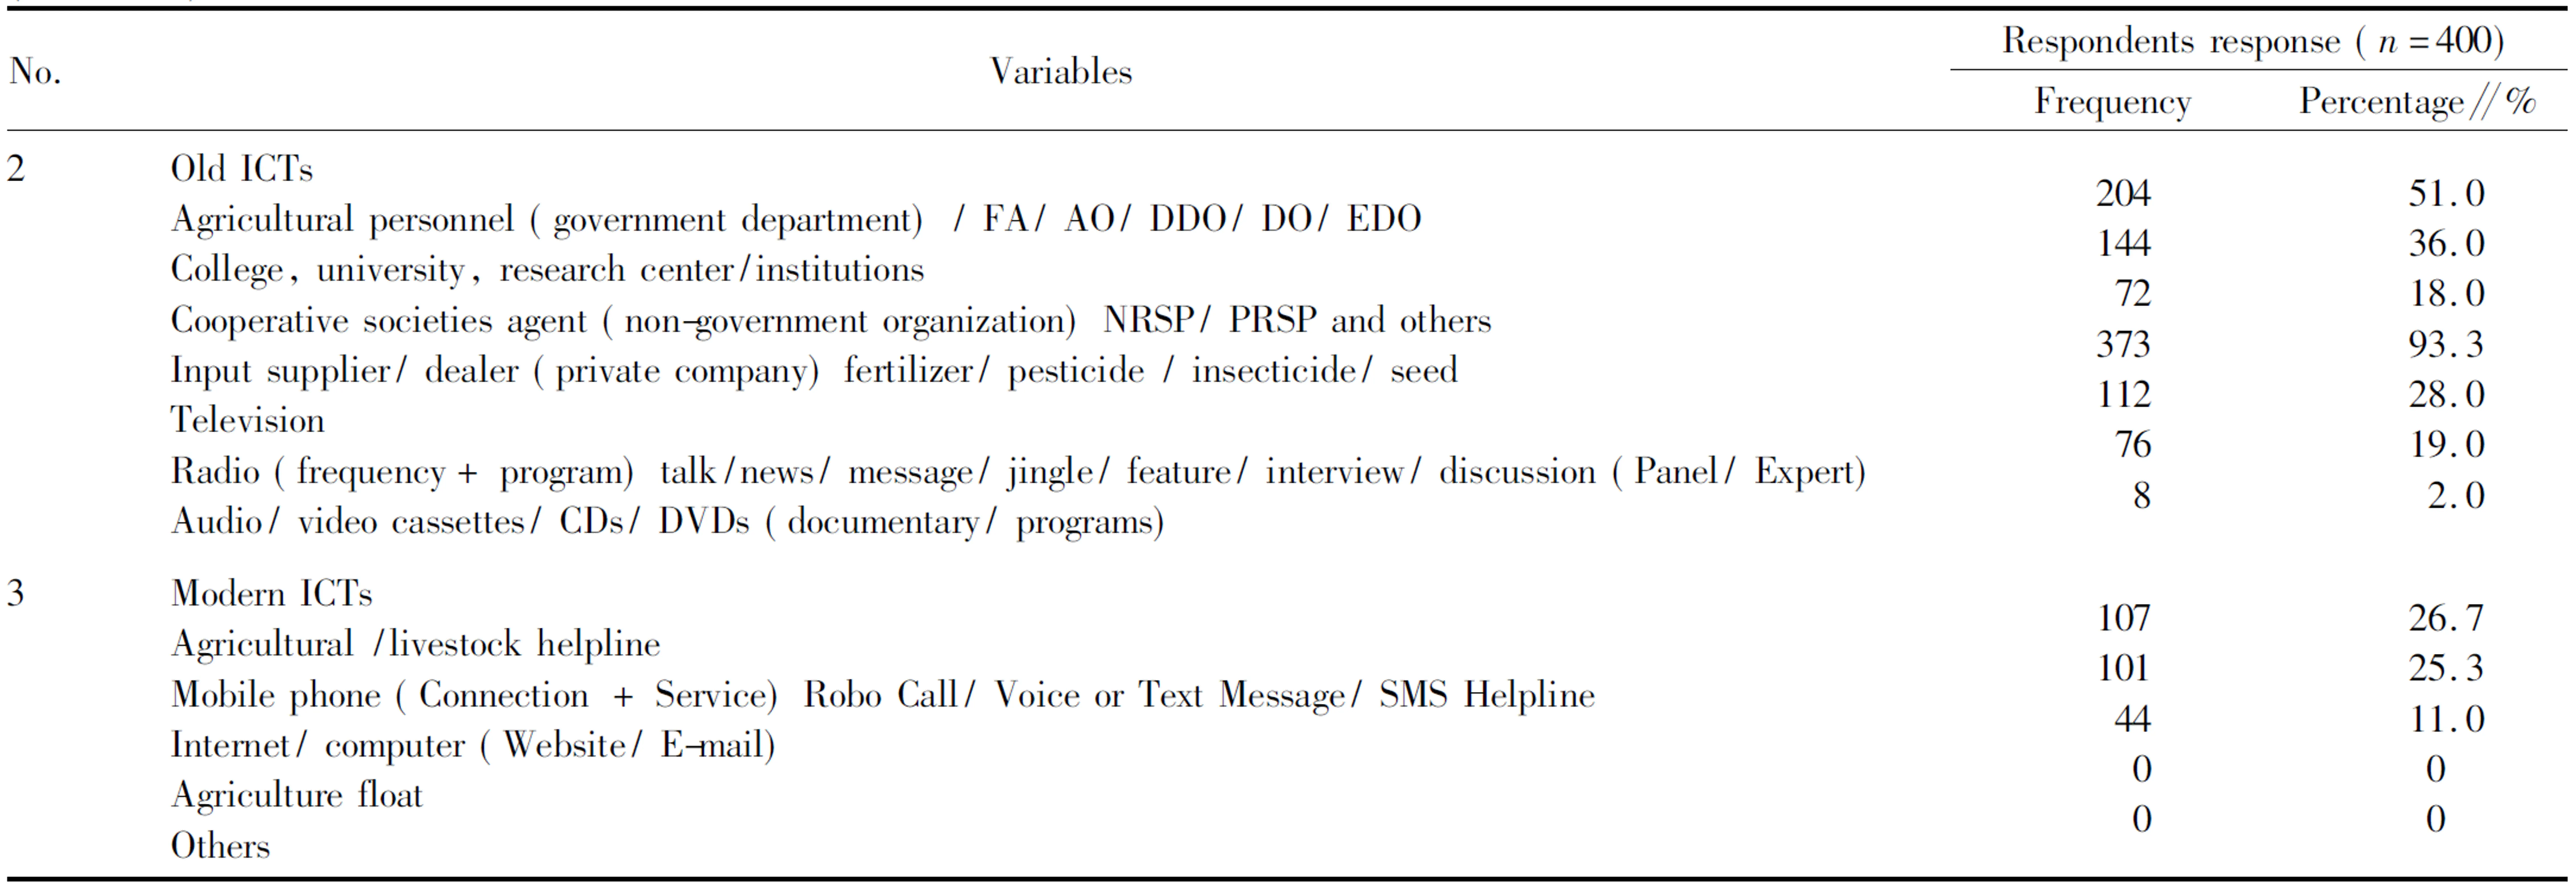
3.2ICTscharacteristicsoftherespondentsThe findings showed that generally overwhelming majority obtained information from very old ICTs of which only 32.5% and 26.5% of the respondent are printed material and telephone respectively in Table 2. However, less than 13% reported against printed material, wall chalking and telephone from Muzaffargarh district respectively and remaining districts shows overwhelming majority by the use of very old ICTs in Fig. 2b. The general outcomes regarding old ICTs reveal that overwhelming majority of the respondents were in link with the categories of input supplier/ dealer (private company) fertilizer/ pesticide / insecticide/ seed companies whereas only 2% from audio/video cassettes / DVDs (documentary/ programs) respectively. Furthermore, almost half reported against agricultural personnel from old ICTs in general in Table 2. Similar effects also reported in all district against input supplier/ dealer. However, negligible percentages reported against audio/video cassettes from all districts and same percentage in case of radio specifically in Dera Ghazi Khan and Muzaffargarh districts respectively in Fig. 2c.
Data shows collectively from modern ICTs 26.7%, 25.3% and 11% of the respondents reported as agricultural/ livestock helpline, mobile phone (connection + service) robo call/ voice or text message / SMS helpline, and internet / computer (Website/ E-mail) respectively in Table 2. Whereas, no respondent gave their response regarding agricultural float and any other categories. The highest percentage reported less than 40% of helpline and mobile phone from only Rawalpindi district respectively and negligible percentage informed against internet in Dera Ghazi Khan and Muzaffargarh districts in Fig. 2d.
3.3Relationshipbetweensocio-demographicprofileandcommunicationcharacteristicsoffarmerswiththeextentofICTsapplicationKarl Pearson’s coefficient of correlation is a bivariate measure of association (strength and weakness) of the relationship among two variables[14, 16, 27]. The relationship assessing between dependent and independent variables with the help of Kendall’s tau-b correlation[28-29]. This section focuses on one of the specific objectives of the research regarding the relationship between the demographic characteristics and use of (i) very old ICTs, (ii) old ICTs and (iii) modern ICTs respectively. The data collected as discussed in the present section regarding the demographic attributes and use of ICTs to determine the relationship between independent and dependent variables. The demographic attributes (like age, education, landholding, tenancy status, experience, annual income and sources of income) were regarded as independent variables. However, the dependent variables are divided into three categories as mentioned in Table 3.
Table2Characteristicsofrespondents’applicationofICTs

No.VariablesRespondents response (n=400)FrequencyPercentage∥%1Very old ICTsFamily member (family head/ grandfather/mother)Friend/ colleague/ relative/ neighborLocal leader (key informant)Progressive farmer / growerMiddle menPrinted material/ publication (newspaper/ magazine/ journal/handout/picture/diagram/Pena flex/chart)Walk chacklingTelephone (Government + Private)Self-experience38139738639136513023710639395.399.396.597.791.332.559.326.598.3
(To be continued)
(Continued)

No.VariablesRespondents response (n=400)FrequencyPercentage∥%2Old ICTsAgricultural personnel (government department) / FA/ AO/ DDO/ DO/ EDOCollege, university, research center/institutionsCooperative societies agent (non-government organization) NRSP/ PRSP and othersInput supplier/ dealer (private company) fertilizer/ pesticide / insecticide/ seedTelevisionRadio (frequency+ program) talk/news/ message/ jingle/ feature/ interview/ discussion (Panel/ Expert)Audio/ video cassettes/ CDs/ DVDs (documentary/ programs)2041447237311276851.036.018.093.328.019.02.03Modern ICTsAgricultural /livestock helplineMobile phone (Connection + Service) Robo Call/ Voice or Text Message/ SMS HelplineInternet/ computer (Website/ E-mail)Agriculture floatOthers107101440026.725.311.00 0
Source: Field Survey, 2017.
The present study found 100% significant positive relationship between all demographic attributes with modern ICTs whereas similar results in age and experience from very old ICTs of every category. From very old ICT, middle man, printed material, wall chackling, and telephone found also significant positive correlation with same percentages in demographic characteristics. The data reveal 57% non-significant relationship between very old and old ICTs with landholding. The results also depicted not different relationship of 72% and 86% from audio/video/CD/DVDs and cooperative societies/NGOs with demographic characteristics of old ICTs. However, 57% negative significant correlation reported in input supply dealers of old ICTs with demographic characteristics.
It may be inferred that middle age farmers were more inclined towards modern ICTs and radio as compared to younger people. On the other hand, the use of television decreased with the increase in age. The data also highlights that with the increase in education, use of TV also showed increasing trend. Same was reported in case of landholding and farmers’ annual income. Likewise, the use of modern ICTs appeared more in respondents where income sources were more.
Table3AssociationbetweendemographicattributesandICTs

DemographicattributesVery old ICTsFamilymemberFriend/relative/neighborLocalleader/keyinformantProgressiveFarmer/GrowerMiddleman PrintedmaterialWalkChacklingTelephone(Govt+Pvt.)Self-experienceOld ICTsAgri.personnelResearchcenter/institutionCooperativesocieties/NGOsInputsupplydealersTelevisionRadioAudio/Video/CD/DVDsModern ICTsAgri.HelplineMobilephoneInternet/computerAge0.510∗∗0.207∗∗0.453∗∗0.361∗∗0.465∗∗0.855∗∗0.641∗∗0.740∗∗0.381∗∗0.110∗0.228∗∗0.025-0.170∗∗0.0550.160∗∗0.0790.133∗∗0.145∗∗0.174∗∗Education0.201∗∗0.0780.171∗∗0.136∗∗0.279∗∗0.877∗∗0.746∗∗0.853∗∗0.120∗0.235∗∗0.385∗∗0.071-0.182∗∗0.134∗∗0.219∗∗0.0940.166∗∗0.191∗∗0.182∗∗Landholding0.0890.0350.0760.0610.124∗0.578∗∗0.332∗∗0.667∗∗0.0531.42∗∗0.339∗∗0.0730.0330.196∗∗0.0930.0770.182∗∗0.199∗∗0.179∗∗Tenancy status0.153∗∗0.0590.130∗∗0.104∗0.212∗∗0.920∗∗0.567∗∗0.901∗∗0.0910.175∗∗0.229∗∗-0.03-0.235∗∗0.125∗0.126∗0.101∗0.125∗0.144∗∗0.165∗∗Experience0.388∗∗0.206∗∗0.370∗∗0.360∗∗0.458∗∗0.816∗∗0.797∗∗0.745∗∗0.317∗∗0.236∗∗0.385∗∗0.064-0.178∗∗0.103∗0.263∗∗0.0910.178∗∗0.180∗∗0.176∗∗Annual income0.207∗∗0.0810.177∗∗0.141∗∗0.287∗∗0.742∗∗0.770∗∗0.716∗∗0.124∗0.272∗∗0.460∗∗0.112∗-0.0680.132∗∗0.253∗∗0.0750.160∗∗0.178∗∗0.195∗∗Income sources0.149∗∗0.0580.127∗0.101∗0.207∗∗0.758∗∗0.554∗∗0.714∗∗0.0890.0960.344∗∗0.094-0.0720.109∗0.176∗∗0.0710.220∗∗0.232∗∗0.201∗∗
Note:**denotes significant correlation at the level of 0.01 (2-tailed);*denotes significant correlation at the level of 0.05 (2-tailed).
The results are contradictory to the study that[30]a negative significant correlation between age and use of radio, also concluded that no significant relationship among income and use of radio[31]was found a significant positive correlation between demographic characteristics with the use of electronic media as agricultural information sources. The results also contradictory to the study that[32]depicted that age showed negative correlation with the use of multiple sources of ICTs. While, inline results in case of education and income highlight positive association with use of multiple sources.
4 Conclusions and recommendations
The study concluded that socio-demographic attributes and use of modern ICTs having strong positive relationship. Similar association subjected in the case of age, experience, education and annual income in very old ICTs. However, agricultural personnel and research center/institutions having positive significant relationship with demographic attributes in old ICTs. This showed that the clear-cut impact of socio-demographic profile with the extent of use of ICTs. It also seems that farmers due to educational status, experience, landholding, income, exposure and extension contact had acquired knowledge on various agricultural and other aspects.
Based on the findings of the study, government should launch regular ICTs program like applications robo calls, SMSetc. and modern ICTs services at central level to ensure timely availability of agricultural information to farmers. Moreover, all stakeholders should launch effective monitoring and evaluation mechanism of ICTs related agricultural technology transfer for effective agricultural development.
杂志排行
Asian Agricultural Research的其它文章
- Expression Regulation of Starch and Storage Protein Synthesis Related Genes in Rice Grains
- Analysis of Gene Expression Profiles of Rice Mutant SLR1 Based on Microarray Data
- Optimization of Fermentation Process of Carrot Juice by Probiotics and Analysis of Aroma Components
- Safety Assessment and Distribution Characteristics of Heavy Metal Pollutants in Livestock and Poultry Meat from Different Regions of China
- Cucumber Downy Mildew: Research Progress and Registered Fungicides
- Effects of Different Seedling Raising Substrates on Quality of Rice Seedlings
