New Trends in the World Economy and the Countermeasures for Development in the New Era
2019-02-15HeLiping
He Liping*
Abstract: In the context of “the world is undergoing great development, transformations,and adjustments,” the new trends in the world economy deserve more attention. This article gives a brief review of changes in international trade growth, current account balances, international investment flow, effective interest rates, and relative growth rates of both developed and developing economies. It argues that the slowdown in external demands will continue for a long time, that countries may attach more importance to external markets and competition will intensify. In the course of economic globalization, China needs to focus on developing its domestic markets, devote itself to creating favorable social and economic institutional conditions to increase efficiency and constantly progress in endogenetic technology, and explore an upgraded system for international multilateral trade and investment.
Keywords: international trade, international investment flow, effective interest rate
The report to the 19th National Congress of the Communist Party of China points out that, “The world is undergoing great development,transformations, and adjustments.” Economically, since the 2008 global financial crisis, the world has experienced some profound changes, which are closely related to the evolution of economic globalization. Influenced by such factors as the relative changes in economic sizes, the adjustments to economic policies and new technological advances of major powers, today’s world economy has entered a new era. Economic globalization characterized by active involvement of various countries in international trade and international investment is still continuing, but their ways of engaging in such activities are changing significantly and the economic globalization is being confronted by severe challenges. This paper explores these changes in international trade growth, current account balances, international investment flow,effective interest rate fluctuations, and relative growth rates of both developed and developing countries.
1. Slowdown in international trade growth
An important manifestation of the process of economic globalization is that international trade grows at a rate higher than a country’s gross domestic product (GDP). According to the statistics of the International Monetary Fund (IMF), looking at the period from 1980 to 2007, the global GDP grew at an average rate of 3.53%,while the total volume of world trade in goods and services (imports and exports) grew at an average rate of 6.09%. Looking at the period from 1991 to 2007, the global GDP grew at an average rate of 3.74% while the volume of international trade grew at an average rate of 6.96%. However, the ratio has reversed from 2008 until 2017 when global GDP grew at an average rate of 3.33%, while world trade grew at an average rate of 3.17%.
As shown in Figure 1, the growth rate of world trade (the volume of imports and exports of goods and services)in 2017 climbed to 4.16%, higher than that of global GDP at 3.62% in the same year. Such a pickup is primarily the result of the global economic recovery and a rebound in prices for international staple commodities in 2017. The global GDP in 2016 grew at a rate of 3.21%, significantly lower than that in 2017. Furthermore, the average crude oil price quoted by the world’s three biggest markets rose from US$ 42.84 per barrel in 2016 to US$ 50.28 per barrel in 2017, the average price index of food and beverages went up from 145.8 in 2016 to 149.1 in 2017 (100 in 2005), the price index of agricultural raw materials, including wood, cotton, wool and rubber, went up from 113.3 in 2016 to 115.6 in 2017 (100 in 2005), and the price index of metals, including copper, aluminum, iron ore, tin,nickel, lead and uranium, went up from 119.7 in 2016 to 144.5 in 2017 (100 in 2005). Overall, the average prices of international staple commodities have risen by at least 10% over the two years.
In general, a country’s demands for foreign goods and services are positively correlated with its economic growth, which means that during periods of economic recovery or accelerated economic growth, such demands will grow at a rate higher than that of the GDP. In the short term the global demand for staple commodities is also positively correlated with the price fluctuations, which means that when the price goes up,the actual demand is also tending upwards. The latter is primarily intended for stock adjustments to prevent increased expenditures due to a rise in expected prices.
However, there are several structural factors that weaken the correlation between economic growth and foreigntrade. First of all, automation, artificial intelligence (AI)and other technological advances not only have enabled the manufacturing industry to become more and more“lightweight,” but also have decreased the demand for unskilled labor, which compels domestic manufacturers to “remain” in their home countries with higher payroll costs rather than transfer production abroad. The industrial outsourcing which thrived in the 1990s and the first decade of the twenty-first century has already exhibited a downward trend thus, to some extent, slowing down the growth of international trade.
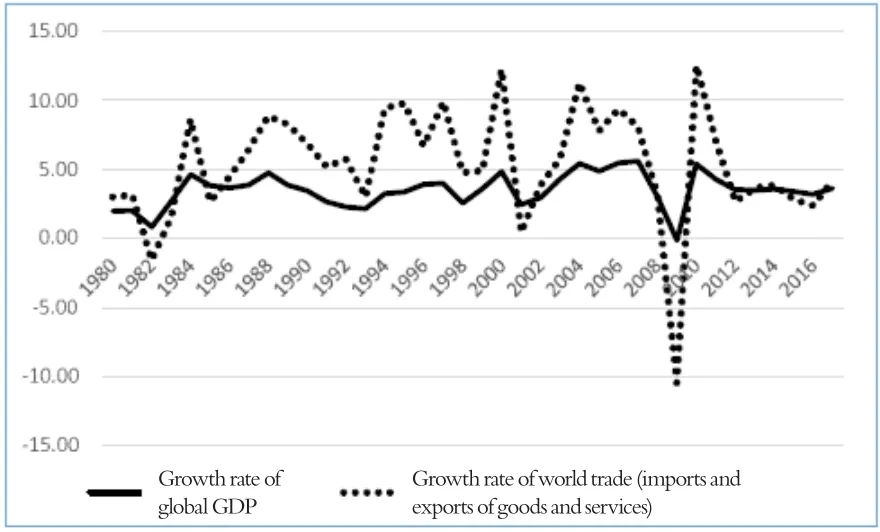
Figure 1 Growth Rates of Global GDP and World Trade(Goods & Services), 1980-2017
Second, some traditional major energy importers,including the United States, have cut their demand for imported energy because of their exploitation of domestic shale oil. Developed economies have also exercised restraints on their demands for imported energy,due to the development of energy saving technologies and the requirements for emissions reductions. For international energy markets, the major demand is from emerging economies, such as China and India. If these economies cannot maintain a growth rate as high as that in the 1990s and the first decade of the twentyfirst century, the prices of international staple commodities will tend to be more stable than before.
Moreover, it is necessary to take into consideration the trade policy changes of some leading powers and their influence on the growth tendency of international trade. Overall, some adjustments to trade policies are going on worldwide, and the immediate outlook is not optimistic. For the near future it will be hard for us to expect China’s growth rate of international trade to reach the 1990s through 2010 level (at 5.17%) if the overall growth rate of the world economy fails to exceed the average of those in the first decade of the twenty-first century (at 3.93%).
2. Gradual improvemet in global economic imbalances
Before the 2008 global financial crisis, the international community had extensive discussions about the“global economic imbalances” and measured several big economies for their current account (CA) imbalances to GDP ratios. In the United States, for example, the CA surplus to GDP ratio was 0.05% in 1991, while the CA deficit to GDP ratio reached -4.91% in 2007. China’s CA surplus to GDP ratio was up to 9.89% in 2007. After the crisis, a few major economies had a decline in their CA balances (imbalances) to GDP ratios. In 2016 and 2017 the U.S.’s CA deficit to GDP ratios dropped to the range of 2.38% - 2.42%, and China’s CA surplus to GDP ratios fell to the range of 1.4% - 1.7%.
As shown in Figure 2, since 2009, the U.S.’s CA balances to GDP ratios have fallen below 3% (equivalent to the levels of the 1980s or 1990s) and several other countries, such as Germany, Japan and the UK, have also had a tendency towards some “moderation” in their ratios.For a few years after the 2008 global financial crisis,Germany’s ratios climbed rapidly, with the CA surplus to GDP ratio up to 8.5% in 2015, which reflects the strong demand for German products from emerging market economies but with relatively weak demand at home. In addition, even though Japan’s CA surplus to GDP ratios have been at high levels in recent years (ranging from 3.1% to 3.8% over the period 2015 to 2018) such ratios are still lower than their historic levels in 1986 and 2007(exceeding 4%). The UK’s CA deficits reached a historic high level of -4.7% in 2014 and have fallen steadilystanding at -3.7% in 2017. The UK’s CA deficits are projected to fall further to -2.5% in 2022.
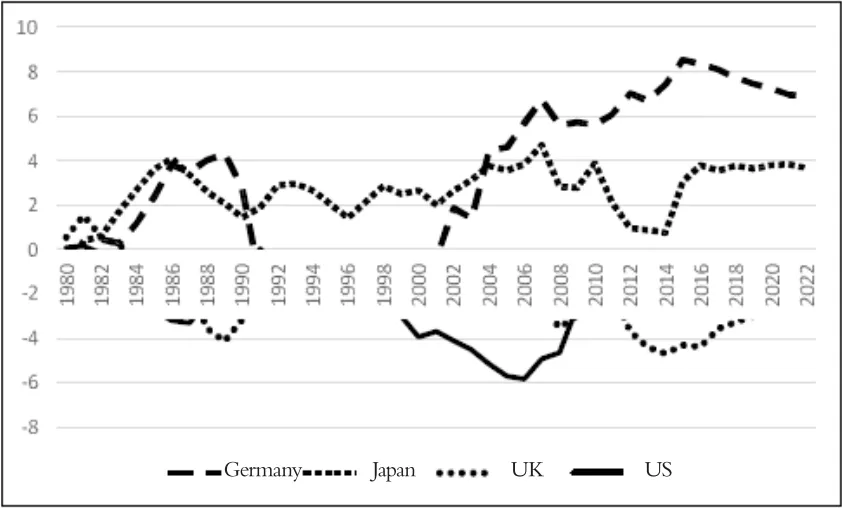
Figure 2 CA Balance/GDP Ratios of Major Developed Economies,1980-2022

Figure 3 CA Balance/GDP Ratios of Four Developing Economies,1980-2017
As shown in Figure 3, among the major developing countries, in addition to China, Brazil, India and Russia have a tendency towards “moderation” in their CA balance/GDP ratios. Brazil’s CA deficit to GDP ratio was -1.4% in 2017, lower than their -4.2% in 2014 and their historic high level of -4.3% in 1999. India’s CA deficit to GDP ratio was -1.4% in 2017, far lower than their -4.8% in 2012. It is worth noting that such declines appeared during relatively fast economic growth periods in India, which is basically the same as what happened in the second half of the 1990s and the first decade of the twenty-first century in China. It is due to the exports of large quantities of resources and the control of import trade that Russia has had a CA surplus for years. Russia’s CA balance/GDP ratio was 2.8% in 2017, still lower than 5.3% in 2015 or 10% when global oil prices were on the rise (10.3% in 2005).
The weakening of the CA imbalances of major economies implies that these countries have become less dependent on foreign capital markets in flow index terms, and, from another perspective, it also reveals the fact that the international capital markets have provided relatively weak support for a country’s trade growth.For big economies, they do not seem so keen on financing trade deficits with international capital or investing profits from trade surpluses in foreign markets.
3. Decelation in growth of international direct investments
According to UNCTAD statistics, in 2007, before the global financial crisis broke out, the global foreign direct investment (FDI) inflows had hit an all-time record of US$ 1.9 trillion, of which nearly US$ 1.3 trillion was from developed economies. Since then such inflows have seldom exceeded US$ 1.5 trillion, except US$ 1.9 trillion in 2015, the year with the maximum FDI inflows, when the developed economies reached merely US$ 1.1 trillion.
In order to exhibit the worldwide FDI fluctuations in a clearer way, I made a comparison between the data in Figure 4 and the relevant GDP data and display the results in Figure 5. During the period 1990 - 2000, the FDI inflows to GDP ratios rose from 0.87% to 4.02%, from 0.93% to 4.18% for developed countries, and from 0.68% to 3.33% for developing countries. Looking at the changes in these ratios, the “golden age” of economic globalization was in the 1990s. In the first decade of the twenty-first century, these ratio indicators first fell,then rose, and finally reached relatively high levels in 2007 (all exceeding 3% for developed and developing countries). In 2008 when the global financial crisis broke out, all the indicators dropped dramatically. Since then, these indicators have picked up to some extent, but even in 2015, the year with the highest FDI inflows,they have not recovered to their 2007 levels. The FDI global inflows to GDP ratio in 2016 was 2.23%, 2.24%for developed economies, and 2.21% for developing economies.
Looking at the FDI inflows to gross fixed capital formation (GFCF) ratios, recent years have seen a more noticeable downward trend in the importance of FDI. As shown in Figure 6, during the period 1990-2000, FDI inflows to GFCF ratios rose globally from 3.6% to 16.2% and from 3.7% to 17.2% for developed economies and from 3.2% to 13.1% for developing economies. Throughout this period, China’s FDI inflows to GFCF ratios went up from 3.6% in 1990 to 16.9% in 1994, and then went down to merely 10.1% in 2000 because of the acceleration of the capital formation of domestic fund sources.
In the first decade of the twenty-first century, both developed economies and developing economies, except China,experienced fluctuations in FDI inflows to GFCF ratios which peaked in 2007 (the year before the globalfinancial crisis). Since the crisis, such ratios have been in decline, indicating that the dependence of these countries on foreign direct investments has lessened, and the crossborder direct investment flows have decreased (at both relative and absolute levels). In 2014, such indicators lowered to 6.8% for the world, 6% for developed economies, and 7.4% for developing economies, which recovered to the level during the first half of the 1990s.

Figure 4 FDI Inflows, 1990 – 2016 (US$ 100 million)
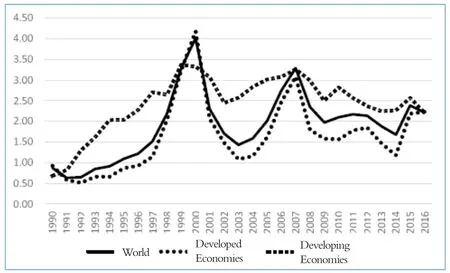
Figure 5 FDI Inflows to GDP Ratios, 1990-2016
It is noteworthy that although East Asian economies have grown at the highest rate in recent years, the importance of FDI inflows is also lessening. As shown in Figure 6, in 2016, FDI inflows to GFCF ratios of Southeast Asian economies fell to 4.8%, which is not only below the average level of developing countries, but is also back to the level of the early 1990s.
As a matter of fact, only a few emerging market economies, for example, China, have had a substantial increase in FDI outflows since the global financial crisis.In 2007, China’s FDI outflows amounted to merely US$25 billion, most of which flowed into countries with rich mineral resources. In 2015, however, China’s FDI outflows reached nearly US$ 150 billion, and since then China has become one of the world’s leading sources of FDI.
A worldwide moderation in direct investment flows reflects the influence of a slowdown in output growth and international trade growth. It also indicates that the opportunities for conventional direct investment among developed economies and between developed and developing countries are gradually vanishing.Additionally, a slower growth in cross-border direct investment flows implies that the return on investment(ROI) worldwide has diminished or has recently been at a low level.
4. Decrease in effective interest rates
As a rule, in financial markets, the effective interest rate (EIR) is calculated by subtracting the inflation rate of a country (CPI, PPI or GDP deflator) from the interbank offered rate or the rate of return on national debts. Estimations show that most developed economies have been at low levels of EIRs since the global financial crisis. This is due not only to zero and even negative interest rate policies adopted by local monetary authorities but more importantly to low inflation. The causes of such low inflation are various, for example a slowdown in the output growth rate, a fall in the ROI, an improvement in the labor market resilience,an increase in the supply capacity of international staple commodities, and a reduction in the demand of developed economies for conventional energy imports. New technological advances represented by the Internet and AI have created new business opportunities, but the decentralization of global markets and thepopularity of imitators have quickly diminished the centralized effect of returns from new technological advances, thus failing to improve the ROI in an effective and sustained way.

Figure 6 FDI Inflows to GFCF Ratios, 1990-2016
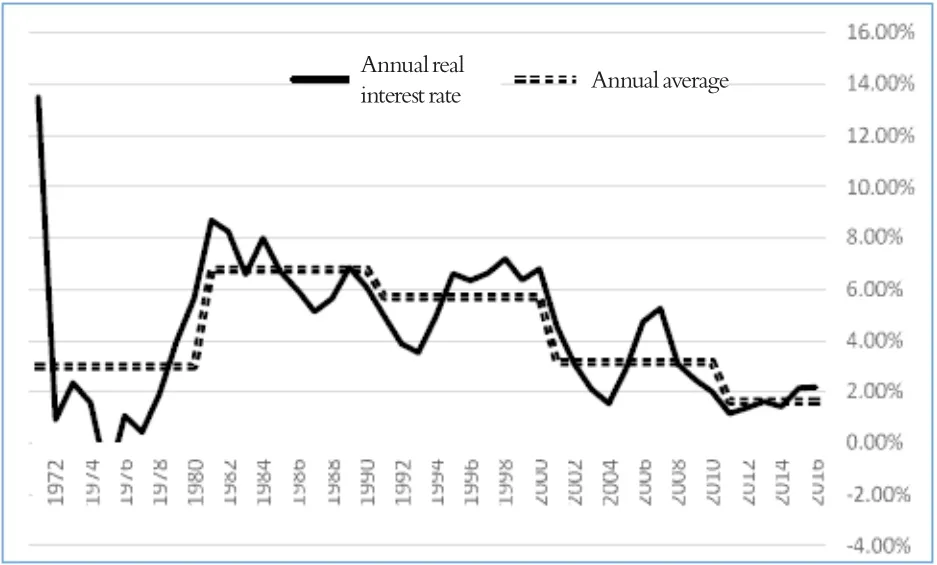
Figure 7 US Effective Interest Rates, 1971-2016
Figure 7 shows the U.S. effective interest rates from 1971 to 2016. Looking at the average of effective interest rates in the five periods, the one from 2011 to 2016 was at the lowest level,1.65%.The low level in U.S. effective interest rates in the 1970s was partially attributed to high inflation, whereas the low U.S. effective interest rates in the 2010s were accompanied by low inflation. The recent low effective interest rates evidently do not correlate with inflation and may be partially attributed to excessively low inflation or deflation.
The scenario mentioned above is not unique to the United States. Holston, Laubach, Williams et al.①Holston, Laubach, Williams et al., 2016measured the macroeconomic indicators of four economies; the U.S., Canada, the Eurozone and the UK, and determined that these economies have had a significant reduction in their trends of GDP growth and the natural rates of interest (denoting short-term effective interest rates without short-term disturbances)in the past 25 years. Jordà, Knoll, Kuvshinov,Schularick, Taylor et al.②Jordà, Knoll, Kuvshinov, Schularick, Taylor et al., 2017measured the rate of return on the risk assets (corporate bonds, stocks and real estate) and risk-free assets (government bonds) of 16 developed economies during the period 1870 to 2015, and found that a decline in the rate of return on risk-free assets in recent decades was similar to what happened between 1870 and the beginning of the First World War.
If we relate the decrease in effective interest rates to the slowdown in output and growth as well as the deceleration of cross-border direct investments, it is not hard to see that the global economy has indeed entered a new stage of profound adjustments after the rapid growth during the last two decades of the 20th century and the first decade of the 21st century. Technological innovation and application in the IT field have been accelerating but the ROI has been at a low level, which indicates that the world’s economy is most likely to maintain a moderate growth rate for quite a long time. It also means that the average growth rate of 3.74%, from the beginning of the 1990s to the 2008 global financial crisis, will be unlikely to occur again. It is one of the marks of the golden age of globalization, and one of the outcomes of the exogenous and endogenous expansion of the global market. The future economic growth of a country will rely increasingly on endogenous technological advances.
5. Trends towards the economic growth of developed and developing countries
Figure 8 presents the GDP growth rates in developed and developing countries during the period 1980-2017. To look at relative economic growth rates of two groups of economies: developed and developing, we have subdivided these 38 years into the following three periods:
Over the period 1980-2000, developed economies, in the aggregate, had an average growth rate of 3.01% while developing economies were at 3.57%. Given that the population growth rates of developing economies were higher than those of developed economies, their per capita GDP growth rates during this period were very likely to be similar.
During the period 2001-2007 the average GDP growth rate of developed economies fell to 2.43%, while those of developing economies had risen to 6.69%. Given that the population growth rates of developing economies were 1% to 2% higher than those of developed economies, the per capita GDP growth rates of developing economies would also be at least 2% greater than those of developed economies throughout these 8 years. During this period, developing economies were catching up with developed economies at a rapid pace and in the meantime were enjoying huge “dividends” from economic globalization.
In the few years after the global financial crisis, however, there were some changes in the relative economic growth of the two groups. During the period 2011-2017 developed economies were at an average GDP growth rate of 1.93% while developing economies were at 5.28%. A conservative estimate by the IMF for the period 2018-2022, the average GDP growth rate of developed economies will be 1.78%, while developing economies will be 4.98%. Among developing economies, such countries as India and Vietnam have had an economic growth rate of over 7% in recent years, but it will be difficult for them to return to this level. The possible causes of this phenomenon are that first, it is virtually impossible to maintain a large developing economy, with a population and economic size close to that of China in the 1990s, at a GDP growth rate of more than 8% for ten years or longer,and even emerging market economies and new leaders in economic growth, such as India and Vietnam, are unlikely to sustain a growth rate of more than 7% for consecutive years; also, some “middle-power” developing economies, for instance Brazil, Mexico, Argentina, Nigeria, Egypt, South Africa, Turkey, Iran and Saudi Arabia,have encountered various domestic political and economic problems in recent years, and some have even been involved in geopolitical conflicts leading to unstable economic growth. It is quite good that these economies have been able to sustain a steady growth of 4%-5% for several years; finally, since 2010 the international industrial transfer has gradually spread from China to other developing countries with a dense population and a low per capita income, for instance Bangladesh,Myanmar and Pakistan, but these countries have been constrained by a lack of infrastructure and other serious problems such as domestic social instability and regional confrontations. It is extremely difficult for them to achieve a growth rate of more than 4%.
More importantly, the industrial transfer in the form of industrial outsourcing on a global scale since the 1990s has brought enormous opportunities to emerging market economies, such as China. However, due to technologicalchanges and the adjustments in economic relations among developed economies, the driving force behind this transfer is very likely to diminish the marginal benefits to developing economies in the future. In developed countries, the euro zone has seen low growth for nearly ten years since the 2010 Greek debt crisis, and Japan has had a low growth rate for more than 20 years, since 1991. Thus, it is possible for these economies to achieve a GDP growth rate of 2% in the future through internal adjustments plus improvements in economic efficiency.

Figure 8 GDP Growth Rates for Developed and Developing Economies,1990-2022
6. Major adjustments to international economic and trade relations and China’s countermeasures
If the economic globalization since the 1990s is largely due to the opening up of internal markets, the industrial outsourcing and outflows of developed economies and the strong growth of global commodity demand, these factors will inevitably have weakened or changed. New technological advances and innovations are gradually rendering the manufacturing industry more and more “lightweight,” which has weakened the trend towards industrial outsourcing and outflow of developed economies and has also lowered the driving effect of such industrial outsourcing and outflows on those developing economies that receive industrial migration. Additionally, with the acceleration of energy self-sufficiency and the development of energy-saving technologies in developed economies, it is very likely that international trade, largely supported by energy products, will no longer grow at a rate which significantly exceeds the domestic economic growth rate.
Therefore, a relatively low growth in external demand will become a major new trend in the world economy for quite a long period of time. The growth of major economies will rely more on an expansion in internal demand, which not only means a slowdown in economic growth, but also exerts new influences on the adjustments of economic relations between countries. The deceleration of external demand and its relatively weakened driving effect on the growth of the world economy does not imply that external demand is no longer a matter of importance. On the contrary, in the context of a slowdown in external demand, every country may attach more importance to external markets and competition will intensify.
In fact, since the UK’s Brexit referendum in June 2016, especially since the U.S. President Donald Trump took office, the international community has seen a conspicuous wave of “deglobalization.” The socalled “deglobalization” reveals a fact that some countries are attempting to make major adjustments to their current economic and trade policies and the multilateral trade and alliance relations, so as to “retrieve” trade interests that had not been earned in the past. Along with the clamor for anti-globalization in the international community, major adjustments to trade policies and relations have objectively caused some disorder and instability to the world’s political and economic order.
The theme of the 2018 World Economic Forum in Davos was “Creating a Shared Future in a Fractured World,” which embodies the spirit of “building a community with a shared future for mankind” proposed by Chinese leaders, and also recognizes the serious and profound divergence of mainstream opinions in today’s world. “The global context has changed dramatically: geostrategic fissures have re-emerged on multiple fronts with wide-ranging political, economic and social consequences. Realpolitik is no longer just a relic of the Cold War. Economic prosperity and social cohesion are not one and the same. The global commons cannot protect or heal themselves.” The excerpt above from the introduction to the summary of the Forum holds an opinion very close to that expressed by Richard Haass, president of the Council on Foreign Relations, in his new book A World in Disarray: American Foreign Policy and the Crisis of the Old Order published in 2017.
In the early 1970s, owing to the turmoil of the Bretton Woods system, the surge in international oil prices, the trade frictions between the U.S., Europe and Japan and the geopolitical conflicts, the world economy at that time was plunged into multiple shocks. There has been a debate in the academic community about how to view the lessons from the 1930s Great Depression. A scholar who had done extensive research on the history of the world economy expressed his views: The most important root cause of the world economic disorder is a lack of leadership. In his words, “The Great Depression was so wide, so deep and so long because the international economic system was rendered unstable by British inability and United States unwillingness to assume responsibility for stabilizing it.”
The world economy in the late 2010s appears to be better than that in the early 1930s or the early 1970s.The global financial crisis at the end of the first decade of the twenty-first century was much more intense and influential than the world economic crisis before, but even so, thanks to international mechanisms, for instance the G20, the world economy has successfully avoided the recurrence of long-term severe depressions. In a sense, the key to preventing the severe bleakness of the world economy lies in whether such mechanisms as the G20 can continue to play a firm guiding role. The current President of United States, Donald Trump, is seeking adjustments to bilateral and multilateral economic and trade relations. To some extent, he has abandoned the initiative and constructive leadership in multilateral trade relations and is inclined to exercise the “power of veto.” In this case economic globalization will certainly face increasing uncertainties, and the possibility of a new division reappears in the global economy and society, and its prospects are also unpredictable.
The countermeasures China should take include: first, focus on developing the domestic market instead of relying too much on external demands to drive the domestic economy; second, create more favorable social and economic institutional conditions for increased efficiency and constant progress in endogenetic technology,continuously improve the domestic market environment, reduce market distortions, strengthen IPR protections,and effectively enhance market fairness and efficiency; third, proactively explore an upgraded system of international multilateral trade and investment, establish positive interactions with the international community that supports globalization, and contribute “Chinese Wisdom” for the smooth development of future globalization.
(Translator: Tong Zhiqiang; Editor: Xu Huilan)
This paper has been translated and reprinted with the permission of Jiangsu Social Sciences, No. 3, 2018.
