改性UCT工艺处理糖蜜废水中营养物去除的补救措施
2018-12-25DeviMuhtariana莉雅张伊帆李永峰
Devi Muhtariana(莉雅),张伊帆,郝 鑫,李永峰
(东北林业大学 林学院,哈尔滨 150040)
1 Introduction
Nowadays, facing more and more strictly requirement on effluent standard, traditional process hardly fulfill satisfactory result owing to its inherent shortage. With step into the society which has the characteristics of energy conservation and emission reduction, it is imperative that to achieve higher treatment performance with less energy consumption. However, the municipal wastewater with low ratio of C∶N are still leading to deterioration in nutrient removal which due to the fact that the PAOs and OHOs can obtain enough biodegradable carbon source. (Zhu et al., 2008).


The objective of study 1.obtaining optimizing performance for nutrient removal with proper ratio of step-feed.2 to evaluate the deterioration in nutrient removal caused by low ratio of C∶N. 3 using the certain methods to remedy the whole nutrient removal efficiency on the foundation of low C∶N.
2 material and method
2.1 Experimental set up and operation
The pilot-scale plant has total volume of 50.6 L and composed of an anaerobic zone followed by a succession of identical couple of anoxic zone and aerobic zone. First chamber is anaerobic zone (5 L) is for phosphorus release, denitrification and denitrifying phosphorus uptakes takes place in the three anoxic chamber (4.9 L) while nitrification and aerobic phosphorus uptakes are happening in the three aerobic chamber (10.3 L).Specifically, secondary settler has working volume of 26 L for sludge separation. The raw wastewater are divided into three parts distribute to anaerobic chamber, to the second and to the third anoxic chamber, its distribution ratios are set to certain ratio controlled by peristaltic pump. The mean influent flow rate is 150 L/d which lead to HRT of 8 h. According to previous study (E. Vaiopoulou et al, 2007; Peng et al, 2011;), it is suggested that set 8-10 h SRT to control sludge wastage base on real situation. The sludge recycle ratio is set to 0.65 and air is supplied by bubble diffuser at bottom of three aerobic chambers. The DO probes are fixed in the three aerobic zones in order to control DO concentration. In order to create complete anaerobic/anoxic environment and mix suspended biomass well, four overhead stirrers are placed in the anaerobic and three anoxic chambers respectively.
2.2 Wastewater and sludge
This research was utilized synthesis wastewater. The synthetic domestic wastewater was used as the experimental influent. It was basically composed of a carbon source (glucose), macro nutrients (N and P), an alkalinity control (NaHCO3) and a microelement solution. The composition contained (L-1) 127.4 mg glucose, 121.3 mg NH4Cl, 133.5 mg NaHCO3, 13.4-20.6 mg KH2PO4, microelement solution (0.12 mg MnCl2-4H2O, 0.001 1 mg ZnCl2-2H2O, 0.013 mg CuCl2-2H2O, 3.4 mg MgSO4-7H2O, 0.53 mg FeCl3-6H2O, 0.79 mg CaCl2-2H2O). The influent characteristics are shown in Table 1.
The reactor was seeded with sludge collected from secondary clarified of the Wenchang full scale WWTP in Harbin, which is operate anoxic-aerobic process for nutrient removal, the value MLSS was ranged from 3 000 mg/L to 4 000 mg/L. After 40 days of sludge acclamation, the sludge was put into reactor for operating one year.
2.3 Analytical methods
2.4 Calculation of NAR and FNA concentration
The nitrite accumulation ratio (NAR) was calculated as follows
FNA concentration was calculated by using the formula (Anthonisen et al., 1976)
WhereKa=e-2 300/(273+℃)

1-Feed tank; 2-pump; 3-anaerobic zones; 4 6 8-anoxic zones; 5 7 9-aerobic zones; 10-settler; 11-effluent tank; 12-sludge return; 13 internal return; 14-air pump.Fig.1 Diagram of the modified UCT process.

Table 1 Operational period for modified UCT in steady state
3 Result and discussion
3.1 Nutrient removal in certain ratio
In the modified UCT reactor, the PAOs bacterium can achieve PHA synthesis and phosphorus release in the anaerobic environment simultaneously, low biodegradation carbon source would deceased the phosphorus release and PHA synthesis which further deteriorated aerobic phosphorus uptakes.
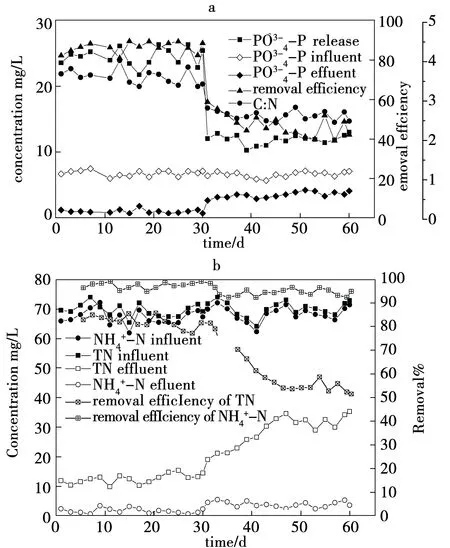
Fig.2 Variation of removal efficiency and corresponding ratio of C:N during operation (a). Variation of NH4-N+ and TN during operation (b).
Fig 2a (0-30 d) demonstrates the phosphorus concentration in influent and effluent as well as removal efficiency in phase 1 with 0.35∶0.35∶0.3 ratio of step feed. In phase 1, the average C∶N ratio was arrival at 3.56 which define as enough carbon source for nutrient removal. Obviously, too much carbon source was contributed to excess phosphorus release which reached to mean 24.5 mg/L. It is known that the efficiency of phosphorus removal has positive correlate with excess phosphorus released (kuba T et al.). The phosphorus concentration in influent was remained stable, ranging from 5.9 mg/L to 7.48 mg/L, the phosphorus concentration in effluent was dramatically reduced to in the range of 0.68 mg/L-1.76 mg/L, the corresponding phosphorus removal efficiency fluctuated between 81.05% and 89.56%. Owing to sequence anoxic-aerobic environment improve the capability of DNPAOs to achieve phosphorus uptakes as well as denitrification, the average anoxic phosphorus removal in the system was increase from 3.45±0.15 mg P/g·vss·h to 4.05±0.27 mg/P·vss·h. The higher phosphorus removal performance was achieved in the reactor which mainly attributed to introducing the returned sludge into the anoxic 1 tank instead of anaerobic tank. As a result, the effect of nitrate on phosphorus release was reduced substantially.
As Fig 2b(0-30 d) illustrated, the average TN concentration in influent was 64.05 mg/L to 73.88 mg/L and NH4-N+was 61.88 mg/L to 72.1 mg/L, respectively. The whole NH4-N+removal efficiency was remained stable at 97.3% which lead to effluent NH4-N+reduced to 1.75 mg/L caused by nitrification completely. In this study, by combining traditional denitrification with denitrifying phosphorus removal with using nitrate as electron acceptor would improve whole nitrogen removal (kuba). The TN removal efficiency was reached to 81.8% and effluent TN concentration was arrival at 12.6 mg/L. Furthermore, denitrificcation in the three anoxic zone were remained range from 0.62±0.15 mg N/g·vss·h to 2.05±0.25 mg N/g·vss·h.
3.2 effect of low C:N on nutrient removal
As shown in Fig 2 (30 d-60 d), owing to the cause of decreasing COD concentration, the C∶N ratio was decreased from averagely 3.56 to 2.58. The decreased carbon source inevitably would deteriorate whole nutrient removal performance. Less carbon source was inhibited phosphorus release and reduced PHA synthesis. Therefore, the mean phosphorus release concentration in anaerobic zone was obtained 11.9 mg/L and only 44.9% phosphorus removal efficiency was achieved. In day 49, the effluent TP was reached at maximum 4.19 mg/L which indicated that whole ability of PAOs was witnessed a horrible circumstance. The PAOs with less PHA stored was merely contributed to 2.31±0.12 mg P/g·vss·h removal in anoxic zone (Fig 3). In the mean time, the DNPAOs were proved weaken performance in denitrifying phosphorus removal.

Fig.3 The profiles of and NO3-N removal in the reactor.
State of NH4-N+removal had shown much difference in the period of phrase 2 which due to the fact that completely nitrification, therefore, it could not change the whole NH4-N+removal. Denitrification which depended on carbon source witnessed substantially decreased, mean TN effluent soared to concentration of 30.7 mg/L and TN removal efficiency reached at around 55.1%. Less carbon source seriously weaken the combined function of OHOs and DNPAOs which lead to TN removal of approximately 0.64±0.15 mg N/g·vss·h in anoxic zone9 (Fig 3). Although the UCT with step-feed method could greatly alleviate the deterioration of whole biological nutrient removal performance caused by few change in carbon source, unfortunately, the proper carbon source could support metabolism in bacterium and play a necessary role in the BNR performance, respectively.
3.3 SND mechanism in modified UCT
The Fig 3(a, b and c ) was shown that the water quality change of day 15, day 45 and day 75, representing TN, NH4-N+, NO3-N and NO2-N concentration in the every zone, The TN and NH4-N+concentration in influent were approximately 67.7 mg/L and 66.3 mg/L, respectively. On day 15, owing to enough carbon sources greatly support activity of OHOs and DNPAOs, the TN concentration decreased from 69.7 mg/L in influent to 20.43 mg/L in TN effluent. TN removal in anoxic zone 1 was ascribed to enhanced denitrifying phosphorus removal. TN removal performance in the anoxic zone 2 was almost the same as that of the anoxic zone 1. The effluent NH4-N+ concentration were as low as 0.97 which mainly due to completely nitrification. The effluent NO3-N concentration was accounted for majority of TN concentration.
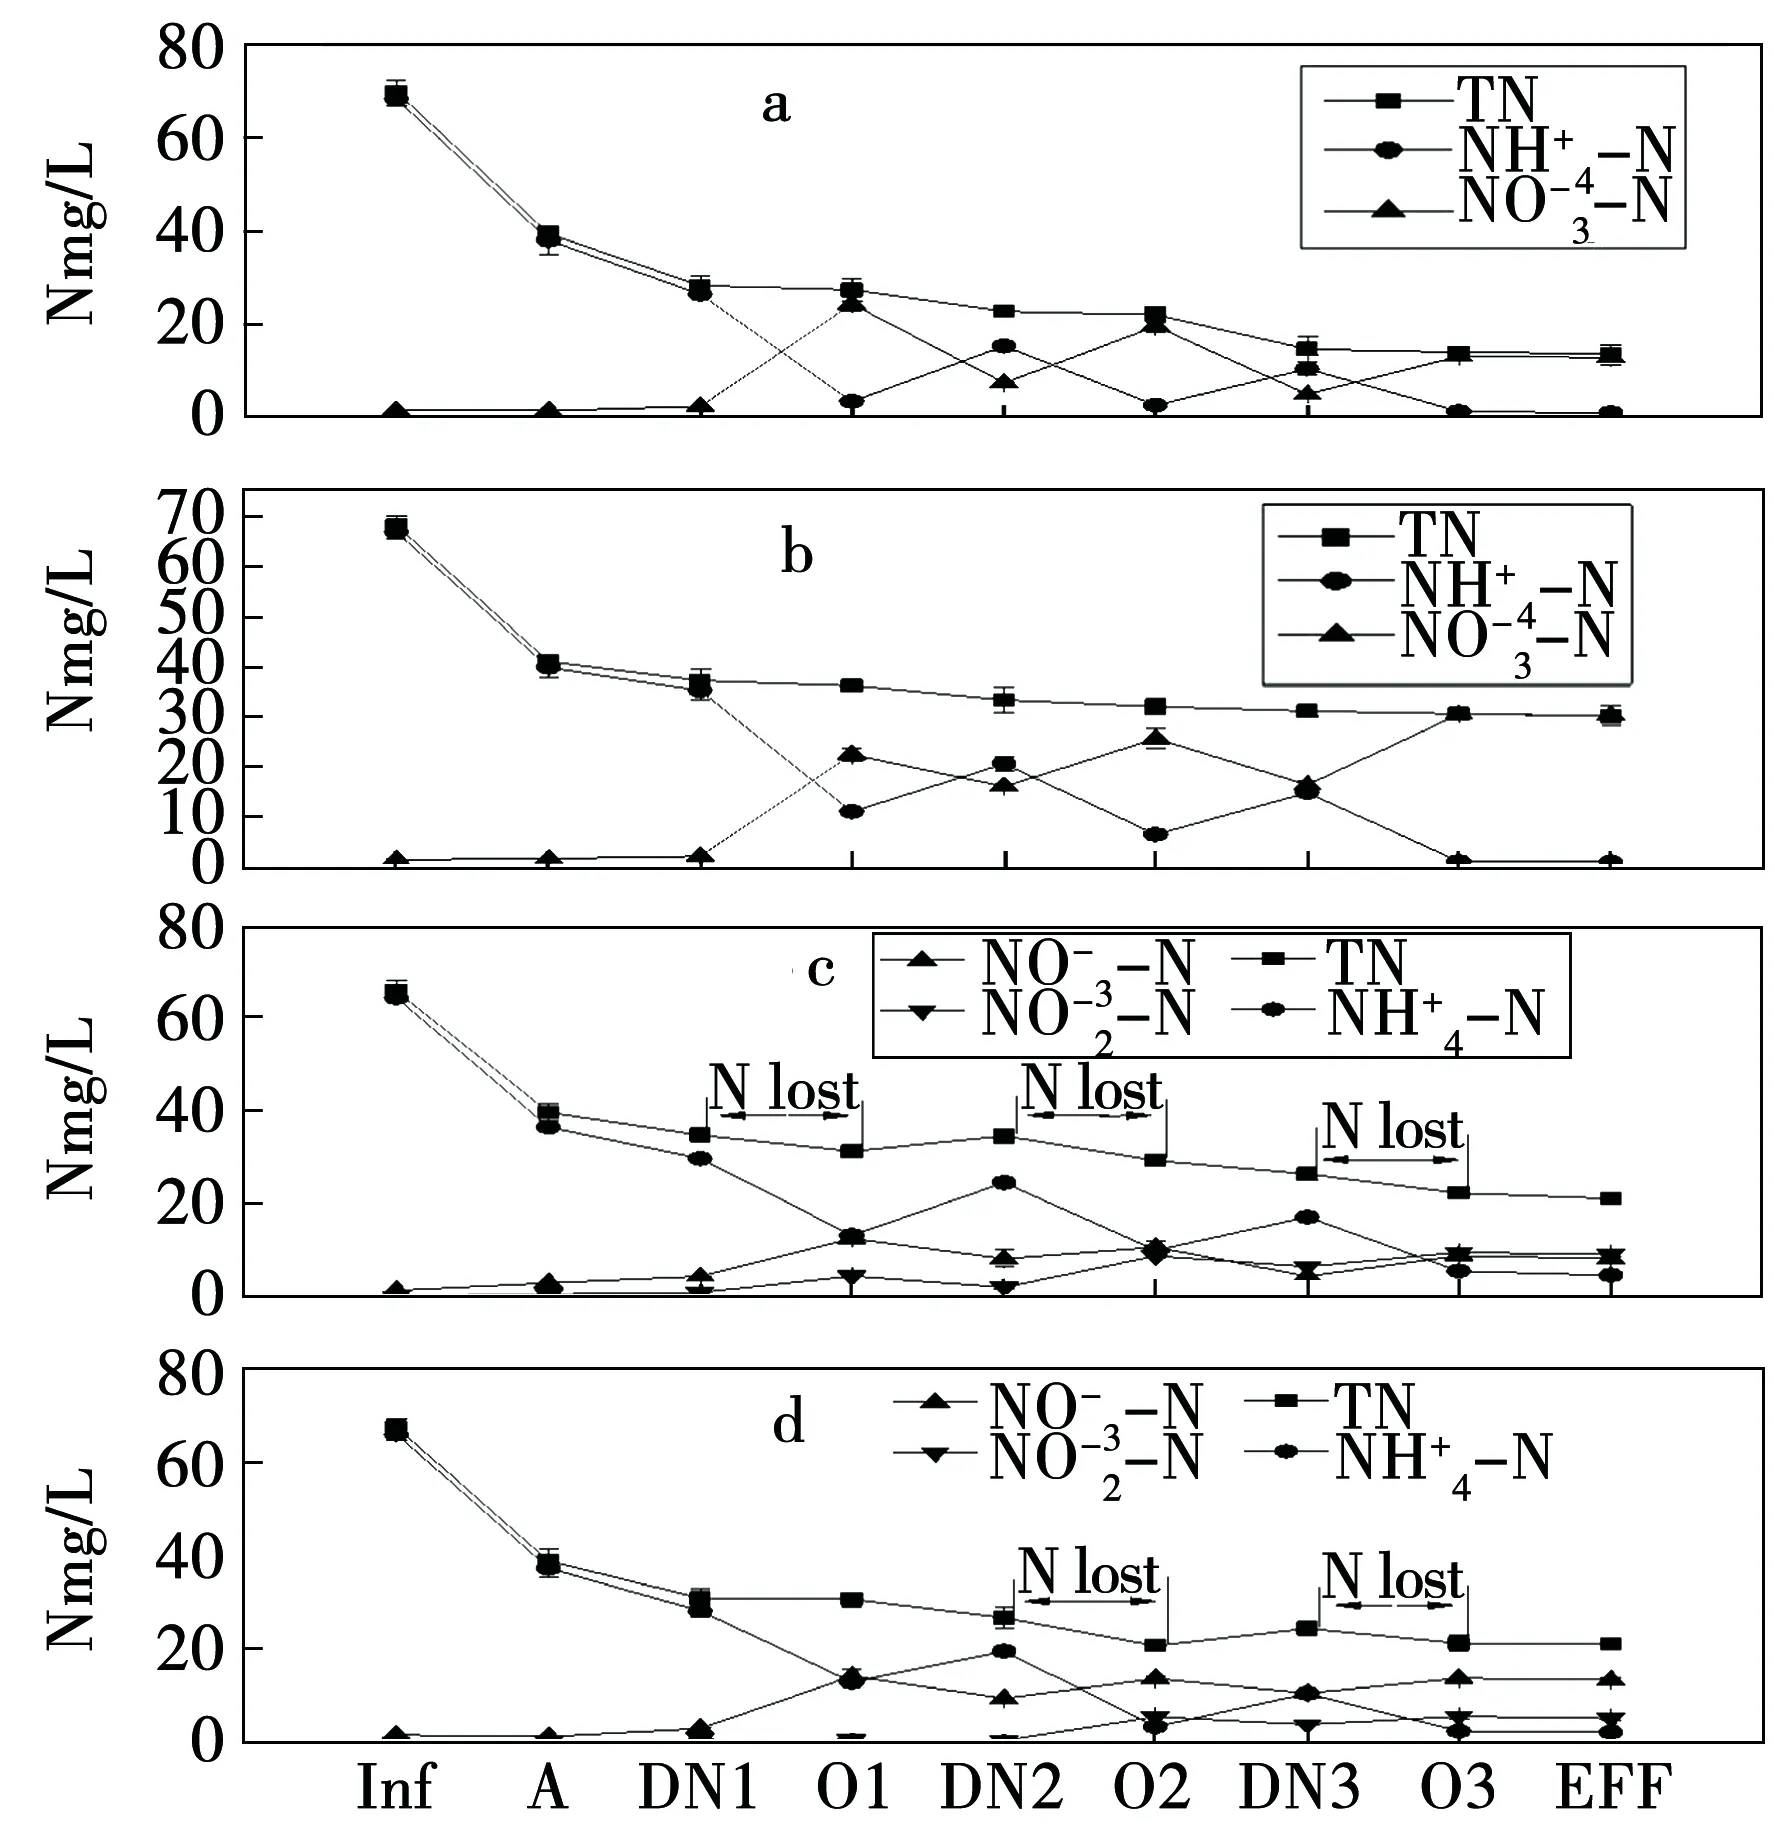
(inf: influent; A: effluent of the anaerobic zone; DN1, DN2, and DN3: effluent of the first ,the second and the third anoxic zone; N1,N2 and N3: effluent of the first, the second and the third aerobic zone; Eff: effluent )Fig.4 Profiles of nitrogen in different zones on 15d(a), 45d(b), 75d(c), 105d(d)
On day 58, TN removal witnessed a gentle drop which due to the low biodegradable carbon source. Specifically, less carbon source was reduced the capacity of first anoxic zone which lead to the whole rate of TN remove drop to 54.5%. State of NH4-N+removal which obtained in the day 58 had similar trench with day 15 and effluent NH4-N+ concentration was reached to around 0.78 mg/L.
Common explanation for SND is attributing to high concentration of MLSS in the low DO environment, the centre of sludge flocs create anoxic micro-environment due to the fact that oxygen limitation. As a result, the NO3-N created by nitrification can quickly transform into N2by denitrification in the anoxic micro-environment (Zhu et al 2007). In order to solve poor performance in TN removal caused by severely carbon deficiency, by stimulating the SND process to alleviate deterioration of whole BNR and improving nitrogen removal, respectively. On day 75, The average removal efficiency of NH4-N+reached 91.2±0.35%, owing to shifting DO in aerobic1, aerobic 2 and aerobic zone 3 to 0.7-1.0 mg/L, the corresponding NO2-N accumulation was reached at 6.06 mg/L ,8.62 mg/L and 9.49 mg/L, respectively, which accounted for 62% ,56.4% ,and 58 % of NAR to corresponding aerobic zone NO-x effluent. As Fig 4c mentioned, the consumption of NH4-N+concentration was more than formation of NO-x concentration from post two anoxic zone to next two aerobic, it indicated the SND phenomenon was successfully occurred. As a result, the SND phenomenon was undertaken part of TN removal which further reduced burden of OHOs for removing TN and lead to efficiency of TN removal exceed by 63%.
3.4 Issue a modified method to improve whole phosphorus removal after the SND
The SND could be seen as the alternative strategy to reduce whole carbon and DO consumption in term of TN removing. However, single method of nitrogen removal won’t change deteriorating circumstance in phosphorus removal. In this study, a modified method combined the SND ideas was proposed to improve TN and phosphorus removal simultaneously. After occurrence of the SND which lead to carbon source reduce dramatically, ratio of carbon source into the anoxic zone 2 and 3 should be changed. As the Fig 5 shown, by shifting 0.35∶0.3∶0.3 ratio of step-feed to 0.45∶0.35∶0.2 ratio of step-feed after day 90, the circumstance of less carbon source in the anaerobic zone was greatly supplemented. Consequently, the PAOs could use more easily biodegradable organics to achieve more PHA synthesis and phosphorus release, respectively, owing to PAOs has experienced about a month of less carbon source, the recovery of ability of phosphorus release would taken a while. In the day 100, the phosphorus release was gradually increased to 20.0 mg/L, the reactor obtained maximum phosphorus removal rate of 71.3%, which spent approximately 25 days to recovery the ability of removing phosphorus. However, the following removal rate of TP was fluctuated between 66.35% and 70.2% which due to previous shock of less carbon source. Noticeable, even though average ratio of C∶N was 2.63 which shown no much difference to previous period of lacking enough carbon source, the corresponding removal rate of TP was averagely 61.3%, it proved the removal efficiency of TP was improved around 136.5%.

Fig.5 Profiles of removal efficiency after SND and changing in ratio of step-feed
By changing previous 0.35∶0.35∶0.3 ratio of step-feed to 0.45∶0.35∶0.2 ratio of step-feed was further altered the activity of microorganism, in the other word, the ratio in the three phrase modified UCT with step-feed was gradually drop would take full advantage of former denitrification capacity in former two anoxic zones and reduce effect of carbon source on nitrification in last two aerobic zones. The variations of TN, NH4-N+, NO3-N and NO2-N alone the reactor were different (Fig4d). Partial nitrification occurred by the low DO was further reduced owing to increasing the DO concentration in aerobic zone 1 in case of sludge bulking. On day 90, the influent TN was drop from 67.4 mg/L to 22.9 mg/L in TN effluent which lead to the remove rate of TN was arrived at 68.34%. Exception for aerobic zone 1, the amounts of NH4-N+oxidized distinctly surpassed the amounts of NO-x in last two aerobic zones. The NAR aerobic effluent in the aerobic zone1 and aerobic were reached at 42.1% and 48.9%, respectively, with respect to the short-cut nitrification and denitrification, by switching the DO concentration to 0.7-1.0 mg/L in the last two aerobic zones could not wash out the NOB. The SND efficiency increased to which compared the former experiments (0.7-1.0 mg/L DO in three sequences of aerobic zone with 0.35∶0.35∶0.3 ratio of step-feed), Some studies suggested that SND was driven by stored poly-b-hydroxybutyrate (PHB) and the percentage of nitrogen removed via SND increased at lower DO concentrations (Third et al., 2003b). However, to avoid too much nitrite accumulation was taken beneficial to the whole phosphorus removal and to achieve the harmony between nitrogen and phosphorus removal.
3.5 Effect of nitrite accumulation on aerobic phosphorus removal
FNA, as protonated form of nitrite has been found caused severely inhibition on EBPR. Specifically, the high concentration of FNA caused by nitrite accumulation can slow down, or even completely cease microbial activities and reconstruct microbial community structure (Pijuan et al., 2010). Aerobic phosphorus uptakes in aerobic zone2 was shown in Fig 6, at the period of day 70 to day 75, the aerobic phosphorus uptakes rate was stabilized at 1.75 mg/g·vss·d. However, the aerobic phosphorus uptakes rate was witnessed a sharp drop which arrived at 0.97 mg/g·vss·d while the corresponding FNA concentration was increased to 0.000 82 mg/L. The results obtained was accordance with the result reported by Saito et al. (2004), which indicated a severe inhibition on aerobic P-uptake by an enriched PAO culture was observed at FNA concentration as low as.

Fig.6 The variation of aerobic phosphorus removal in aerobic zone 2 in the different FNA concentration
0.000 5 mg/L. even though the FNA concentration was recovery to 0.00045 mg/L on day 90, the aerobic P-uptake was fluctuated between 0.88 mg/g·vss·d and 0.96 mg/g·vss·d which due to the fact that the certain enzymes involved in the metabolic process were severely inhibited previously (Zhou et al,. 2011). During the period of day 90 to day 100, the aerobic P-uptake rate was increased from 0.88 mg/g·vss·d to 1.28 mg/g·vss·d, it taken approximately 15 days to recovery former phosphorus uptake ability of PAOs.
3.6 Sludge settling property
The sludge settling condition was shown in Fig 7, it should be noted that the characteristics of three sequences of anoxic-oxic zones in modified was contributed to reducing the possibility of sludge bulking. The advantage was dependent on its special arrangement, which anoxic zone can be a high load anoxic selector for oxic zone. The filamentous bacteria were predominant population in oxic zones while the filamentous bacteria would get population selection after entering into the anoxic zone follow the influent. As a result, the filamentous bacteria got washed out of system. Basing on above-mentioned reasons, the average SVI was fluctuated from 65.32 to 73.56 at former 30 days. Even though low C∶N would destroy the good settling of sludge which increase possibility of filamentous outcompete to other bacterial, the whole SVI was remained as low as 88.6 thanks to the configuration of reactor. From day 67 to day 91, owing to double effect of low C:N and low DO on reactor which lead to the SVI upsurge to maximum 115.6., also the following SVI was remain at around 112.5. Noticeable, the cause of sludge bulking was ascribed to low DO an ratio of C∶N which lead to optimizing the environment for filamentous bacteria. After shifting DO concentration to 2 mg/L in first oxic zone for fear of further serious sludge bulking, the SVI was recovery to approximately 94.6. Even though the whole SVI was exceeded by 92, the good sludge settling was still achieved.

Fig.7 The variation of SVI during the operation period.
4 Conclusions
The synthesized wastewater used as a influent for pilot scale modified UCT, the reactor with 35%∶35%∶30% ratio of step-feed could achieve the most optimizing performance in TP, TN and NH4-N+removal, which reached at 89.56%, 81.8% and 97.3% respectively. After reducing the concentration of COD which lead to the deterioration of nutrient removal, the removing of TN and TP were witnessed a drastic drop, specifically, the TN and TP effluent were upsurge to 30.7 mg/L and 4.19 mg/L. SND as a attractive technology which can improve the whole nitrogen removal efficiency was applied in this study by shifting the DO concentration from 2.0 mg/L to 0.7-1.0 mg/L in the three aerobic zones, the TN removal efficiency were increase to maximum 64.2% following NAR in every aerobic zone were exceed by 58% .For the purpose of not influencing the PAOs metabolism by high nitrite accumulation and good sludge settling, it is appropriate that by changing the ratio of step-feed from 0.35∶0.35∶0.3 to 0.45∶0.35∶0.2 and shifting the DO concentration in first aerobic zone to 2 mg/L. As a result, the TP removal was increased to averagely 61.3% which attributed to more biodegradable carbon source into anaerobic zone. The SND process was weakened thanks to reducing the whole aeration, by contrast, the TN removal efficiency was exceed by 67% owing to the activity of DNPAO was stimulated.