Progress in Chinese Antarctic geodetic remote sensing
2018-12-20DongchenWANGZeminZHANGShengkai
E Dongchen, WANG Zemin & ZHANG Shengkai
Chinese Antarctic Center of Surveying and Mapping, Wuhan University, Wuhan 430079, China
Abstract This paper summarizes the progress of the Chinese Antarctic expedition in geodetic remote sensing. It describes the systems for continuous satellite navigation and positioning, and the tide gauges that have been established at the Zhongshan and Great Wall stations in Antarctica. Advances in the investigation of plate motion, the gravity field, and sea level change as well as the application of GPS in atmospheric studies are reported. Details of the movements of ice sheets and glaciers, distributions of blue ice and ice crevasses, and mass balance studies based on remote sensing techniques are presented. The use of field, satellite,and photogrammetric data to produce topographic maps is described. Finally, the prospects for further Antarctic surveying and mapping are discussed. In the near future, we will establish a high-precision geodetic datum in the Chinese Antarctic expedition areas, monitor changes of Antarctic snow and ice, and develop a platform for sharing Antarctic resource and environment information.
Keywords Antarctica, geodesy, remote sensing, GIS
1 Introduction*
Antarctic geodetic remote sensing is of fundamental importance for the Chinese Antarctic expedition. It is the integration of modern geodesy, remote sensing, GIS, and other related disciplines, e.g., glaciology, oceanography,geology, and environmental sciences. It aims to study Antarctic plate motion, describe surface topographic characteristics, monitor the processes of ice–snow–ocean dynamics, and build a digital polar framework using spatial data and information.
In the past three decades, considerable efforts have been made by Chinese Antarctic surveyors. In the 1980s,geodetic and height datums were established in Chinese Antarctic expedition areas using traditional measurement methods. Subsequently, with the development of GPS techniques, stations for continuous GPS measurements were established. In the 2000s, ice flow velocities and changes in ice shelves and sea ice concentration/extent were monitored using multisource remote sensing data. In addition, digital elevation models (DEMs) were produced for the Antarctic ice sheet using satellite altimetry data, and mass balance studies were undertaken using satellite altimetry and gravimetry. In this paper, the scientific achievements of a series of Chinese Antarctic geodetic, remote sensing, and GIS activities are outlined.
2 Early Chinese geodetic work in Antarctica
Since the first Chinese National Antarctic Research Expedition (CHINARE) in 1984, geodesists have taken part in all subsequent Chinese Antarctic expeditions. Their work has included coordinate system establishment, Antarctic plate motion monitoring, and field surveying for the production of topographic maps.
During the 1st CHINARE, the Great Wall Station was built on the King George Islands, West Antarctica (E et al.,1985). The datum parameters were determined by the TRANSIT system, which is also known as NAVSAT (Navy Navigation Satellite System). The WGS72 reference ellipsoid was adopted and the coordinates of the Great Wall Station are 62°12′59″S, 58°57′52″W. The orientation of the meridian was measured using traditional astrogeodetic surveying and gyroscopes, and the coordinate system of the Great Wall Station was thereby established. Based on the geodetic datum, the distance and the azimuth from the Great Wall Station to Beijing were calculated. The same method was used to build the geodetic system for the Larsemann Hills during the establishment of the Zhongshan Station(Chen et al., 1995). This work laid the foundation for later geodetic studies in the Antarctic.
In 1986, a crustal deformation monitoring network was built in the vicinity of the Fildes Strait fault zone, West Antarctica (Chen et al., 1998). In 1996, the Great Wall and Zhongshan stations were involved in the Scientific Committee on Antarctic Research (SCAR) GPS Campaigns.In 1998, a three-dimension deformation monitoring network was rebuilt for the Fildes Strait fault zone using GPS technology.
In 1984, surveying for the first Chinese Antarctic map(the Great Wall Station map) was undertaken and the surface features around the station were named. Surveying for topographic maps of various scales was performed at the establishment of the Zhongshan, Kunlun, and Taishan stations. These topographic maps were used for station introduction and field research. Marine charts of bathymetry were produced for the Great Wall and Zhongshan stations in 1997 and 1999, respectively. Topographic maps of the core areas of the Grove Mountains were surveyed using the differential GPS method.
3 Antarctic geodetic datum establishment
3.1 Antarctic geodetic control network and GNSS observation
A major task in the field of geodesy is to study both the shape and the motion of the Earth. In the early years,regional geodetic datums of the Great Wall and Zhongshan stations were established using traditional ground traverse surveying techniques. However, following the development of space geodesy, the geodetic datums for the Chinese Antarctic expedition areas were united with the world geodetic system.
In the early 1990s, the development of GPS technology led to its widespread use in the Antarctic. To build a three-dimensional high-accuracy Antarctic geodetic datum under the International Terrestrial Reference Frame, the SCAR Epoch GPS Campaigns were undertaken. In 1996, the Chinese Great Wall and Zhongshan stations were involved in further GPS campaigns. Stations using Leica receivers for continuous GPS measurements were established at the Great Wall(GRW1) and Zhongshan (ZHON) stations in 1997 and 2008, respectively (Figure 1; E et al., 1999).Subsequently, geodetic control networks were established in sequence at the Great Wall and Zhongshan stations,Grove Mountains, and Dome A.
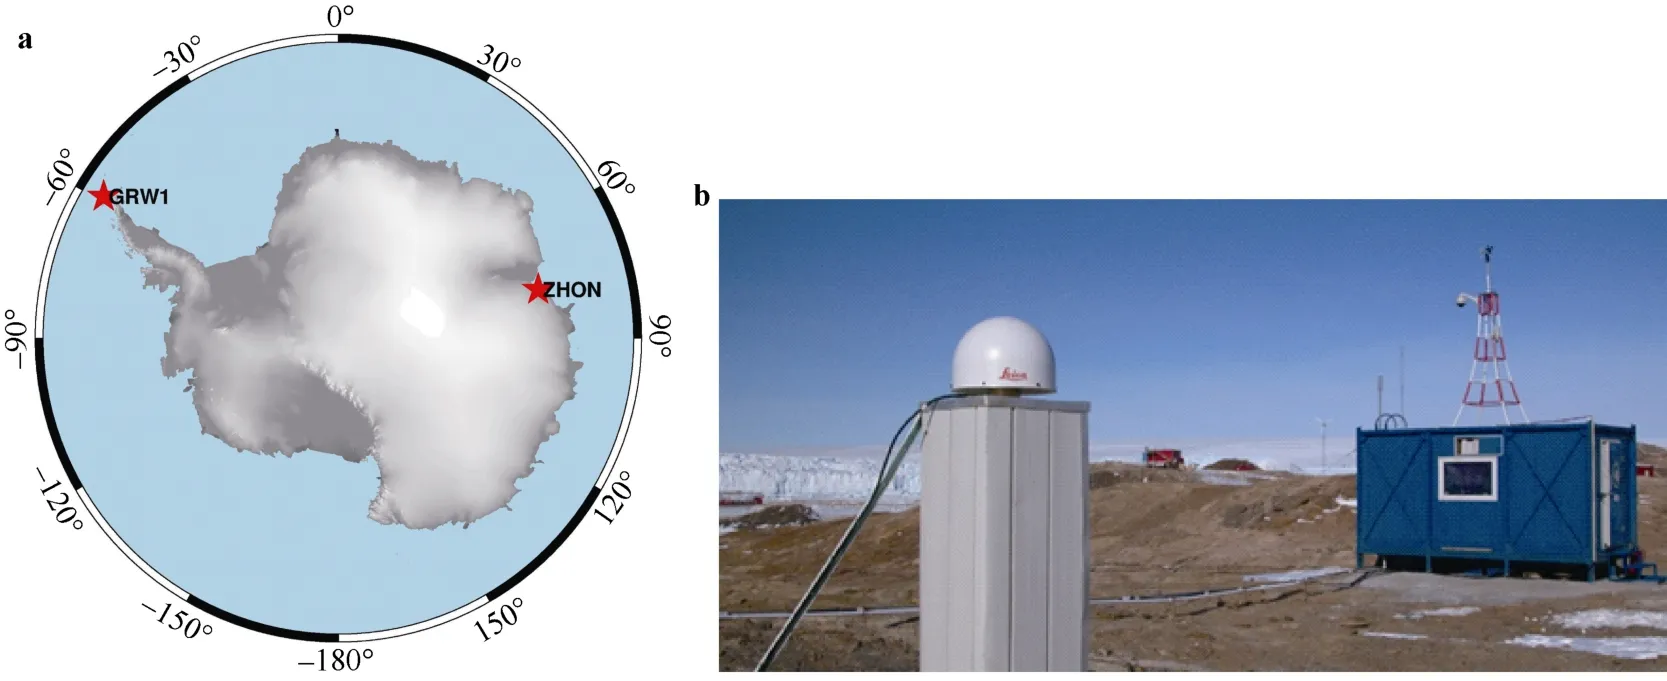
Figure 1 Locations of stations for continuous GPS measurements (a) and the GPS station (ZHON) at Zhongshan Station (b).
3.2 Height datum and tide gauges
Tide gauges in Antarctic are used to determine the height datum and mean sea level, provide tidal forecasts, monitor sea level, and provide calibration for satellite altimetry.With SCAR guidance, more than 20 permanent tide gauges have been installed in Antarctica.
Using a tide staff, height datums were determined for the Great Wall Station area and the Larsemann Hills in 1984 and 1989, respectively. In 1999, through cooperation between China and Australia, an auto pressure tide gauge was deployed at Zhongshan Station. In 2009, a new tide gauge was installed at Zhongshan Station using Norwegian Aanderaa equipment. In addition to relative sea level, this gauge also provides real-time data including pressure, water temperature, and conductivity. In 2011, another pressure tide gauge was commissioned at the Great Wall Station.Figure 2 shows an example of the data derived from the tide gauges at the Zhongshan and Great Wall stations. The accuracy of the sea level observed by the tide gauge at Zhongshan Station is better than 3 mm. The zero calibration undertaken at Zhongshan Station suggests the importance of a stable tide gauge sensor. The vertical offset within the gauge system appears generated by ocean currents, which must be removed from the sea level change. It suggests that tide gauge installation should be completed under water by a diving team rather than simply from a boat, which is definitely much more difficult in Antarctica. The harmonic constants of 170 tidal constituents at Zhongshan Station were obtained using the classical harmonic analysis method(E et al., 2013). The results showed that the tidal type at Zhongshan Station is an irregular diurnal tide. A tide table for Prydz Bay has been produced to provide tide forecasts for the operations of the R/V Xuelong.
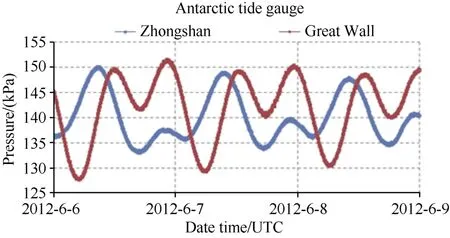
Figure 2 An example of tide gauge data.
3.3 Gravity datum and geoid
The geoid is the equipotential surface that would coincide exactly with the mean ocean surface of the Earth. In Antarctica, the representatives of some countries routinely substitute a mean sea level derived from a tide gauge for the geoid to build their local height systems. Because the datum in each of the height systems corresponds to a different equipotential surface, there are height differences among the various height systems. It is now very desirable to unite the various height systems used in the Antarctic and a high-resolution geoid for Antarctica is needed.
In the late 1980s, international connection measurements of gravity datum points at the Great Wall Station were undertaken using LaCoste & Romberg Model G gravimeters. The values of the gravity datum point and accuracy obtained at the Great Wall Station were 982208.682 and ±0.021 mgal, respectively. During the 2004/05 austral summer season, the 21st CHINARE carried out absolute gravity measurement using an FG5 absolute gravimeter at the Great Wall Station (E et al., 2007). The precision of this measurement was within ±3 × 10⁻⁸m·s−2.At the same time, the vertical and horizontal gradients of gravity were measured. Relative gravity measurements were performed using LaCoste & Romberg superconducting gravimeters at seven sites within the Great Wall Station area. Their precision was within ±10 × 10−8m·s−2and the scale factor was determined precisely. Thus, the gravity datum for Great Wall Station was established.During the austral summer of 2008/09, the 25th CHINARE established a high-precision gravity base network over the Zhongshan Station area and the Larsemann Hills in Antarctica using A-10 portable absolute gravimeters and LaCoste & Romberg Model G relative gravimeters (E et al.,2011). The network comprised three absolute gravity sites and ten relative gravity points. The accuracy of the absolute and relative gravimetry was better than 7.5×10⁻⁸and 20×10−8m·s−2, respectively. During the austral summer of 2012/2013, the 29th CHINARE undertook extended relative gravity measurements using ZLS relative gravimeters at four sites at Zhongshan Station, for which the precision was better than 11.9×10⁻⁸m·s−2.
A geoid model for the transect from Zhongshan Station to Dome A was constructed by combining the EGM2008 model and tide data from Zhongshan Station (Figure 3). The absolute gravity measurements provide fundamental data both for the validation and calibration of satellite gravity missions such as the Challenging Minisatellite Payload(CHAMP), Gravity Recovery and Climate Experiment(GRACE), and Gravity field and steady-state Ocean Circulation Explorer projects (GOCE), and for the establishment of a high-accuracy geoid model in the Antarctic.
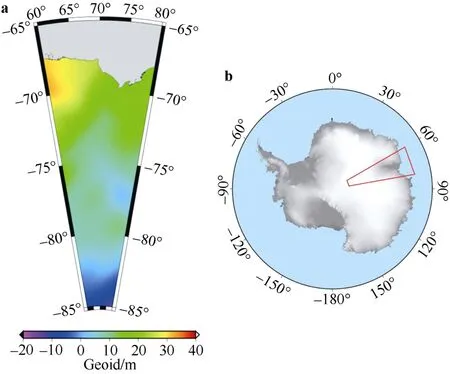
Figure 3 Geoid model for the transect from Zhongshan Station to Dome A (a) and the geographical extent of the transect (b).
4 Antarctic crustal and ice sheet movement studies
4.1 Crustal movement studies
Since 1995, the SCAR Antarctic crustal movement campaign has been conducted annually (Dietrich et al.,2001). The SCAR campaign data from 1997–2004 and some continuous GPS data from stations in Antarctica have been analyzed using GAMIT/GLOBK software (Jiang et al.,2009; King, 2002). This data analysis has involved two major procedures. The first procedure used GAMIT software to estimate parameters such as station position and orbital trajectory on a daily basis for a given 24-h interval from the union of three datasets: (1) campaign stations, (2)GPS stations in Antarctica, and (3) International GNSS Service (IGS) stations around Antarctica. In the second procedure, the daily solutions were combined with data from global GPS subnetworks, which were provided by the Scripps Institution of Oceanography, using the GLOBK software in a “regional stabilization” approach to estimate the positions and velocities. The position of the rotation pole (58.69°N, 128.29°W) and its rate (0.224 (°)·Ma−1)derived from SCAR GPS data are significantly different from the NNR-NUVEL-1A estimations or from some GPS results for the Antarctic tectonic plate. As for the relative angular motion between Antarctica and Australia, the differences between the results given in this paper and some other models are better, i.e., all differences for the rotation rate are <0.01 (°)·Ma−1and for the rotation pole are <4°.The horizontal motions of the SCAR stations and some IGS stations in Antarctica are shown in Figure 4. The GPS results provide a new and precise model of Antarctic plate motion.

Figure 4 Horizontal motions of the SCAR stations and some IGS stations in Antarctica and adjacent regions.
4.2 Monitoring of Antarctic ice sheet movement
4.2.1 Monitoring of Amery Ice Shelf movement
The Amery Ice Shelf (AIS) is one of the three largest ice shelves in Antarctic. The variations of the AIS are sensitive to both global climate change and mean sea level variation.A Leica 530 dual-frequency GPS receiver was installed in the frontal zone of the AIS and it provided continuous GPS observations at 10-s intervals over a 5-d period (Figures 5 and 6). The observation campaign was restricted to this period from 22 December 2003 to 27 December 2003 because of storage and logistics limitations (Zhang and E,2005). The surface ice flow velocity of the observed point was derived from PPP as 2.25 m·d−1toward the northeast with an azimuth of 42.8°.
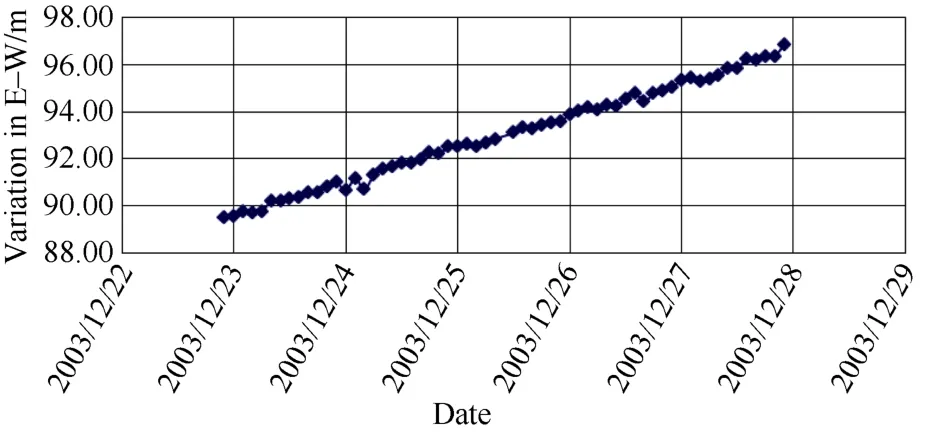
Figure 5 Surface ice movement in the frontal part of the AIS along the east–west.
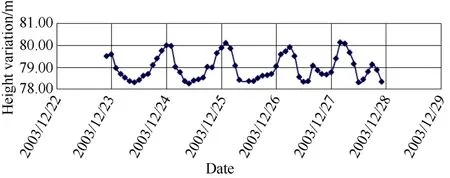
Figure 6 Height variation in the frontal part of the AIS where vertical ice shelf movement is tidal.
4.2.2 Ice velocity along the transect from Zhongshan Station to Dome A
Within the framework of the International Trans-Antarctic Scientific Expedition, the CHINARE has concentrated on the traverse route between Zhongshan Station and Dome A during the austral summer of 1996/97. Along the traverse route, GPS sites were established at approximately 50-km intervals. The ice velocities derived from repeated GPS measurements are shown in Figure 7 (Zhang et al., 2008).The horizontal surface ice velocities were found to increase from the summit of the ice sheet to the coast. In the Dome A area, the velocities were found to be <10 m·a−1; in the plateau area, the velocities ranged from 8 to 24 m·a−1, and they reached about 98.2 m·a−1at a site (LT980) near the coast. The flow directions were found roughly perpendicular to the surface elevation contours of the ice sheet, i.e., primarily toward the Lambert Glacier basin. The measurements were found in reasonable agreement with Australian measurements obtained from the lower section of the CHINARE traverse, where the two datasets overlap(Kiernan et al., 2001).
5 Remote sensing of Antarctic ice and snow environment
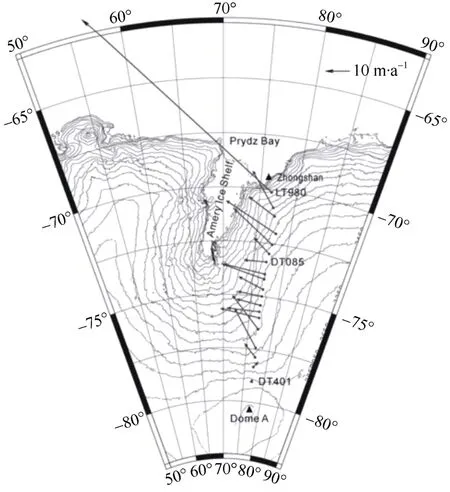
Figure 7 Vector map of surface ice flow along the traverse from Zhongshan Station to Dome A.
Over the previous 50 years, Earth observation techniques have developed rapidly and they can now provide data with multi-spatial and multi-temporal resolutions quickly and accurately. These new techniques provide abundant data and information that cannot be obtained from terrestrially based surveys and thus, they promote understanding of the Antarctic (Stocker et al., 2013; Shepherd et al., 2012).Chinese scientists have used remote sensing and aerial photogrammetry techniques to map and study the dynamic processes of the Antarctic.
5.1 Aerial photogrammetry mapping in Antarctica
In the early 1990s, a small-format aerial photographic technique was developed to produce a topographic map of the Larsemann Hills at 1:10000 scale (Figure 8). A helicopter was deployed as the levitation platform, and an ordinary non-metric camera was used to provide aerial mapping based on small frames. The method proved successful and the work won the State Scientific and Technological Progress Award (the Second Prize). In 2005,a color digital image of the Larsemann Hills was acquired using an ordinary digital camera onboard a helicopter(Figure 9). Based on the image, 171 maps with scales of
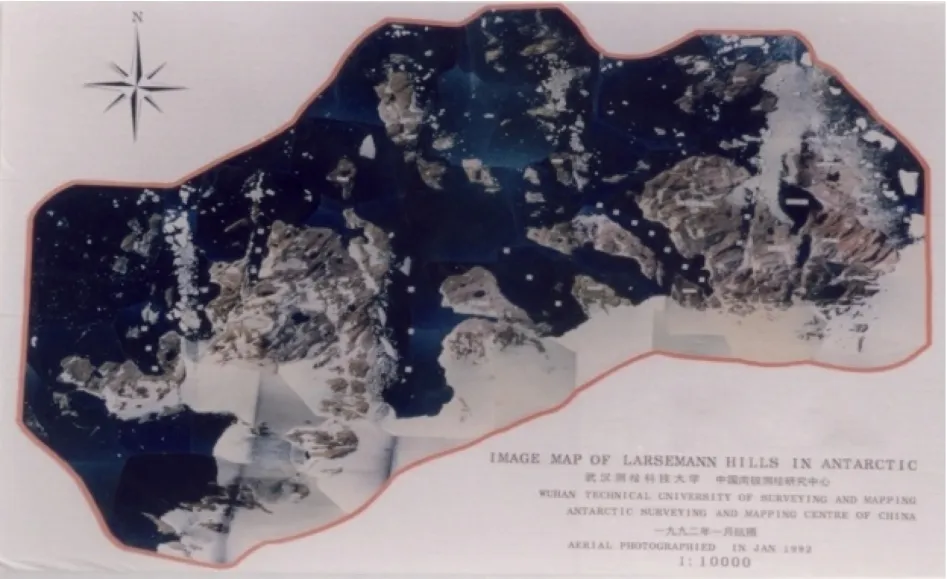
Figure 8 Topographic map of the Larsemann Hills.
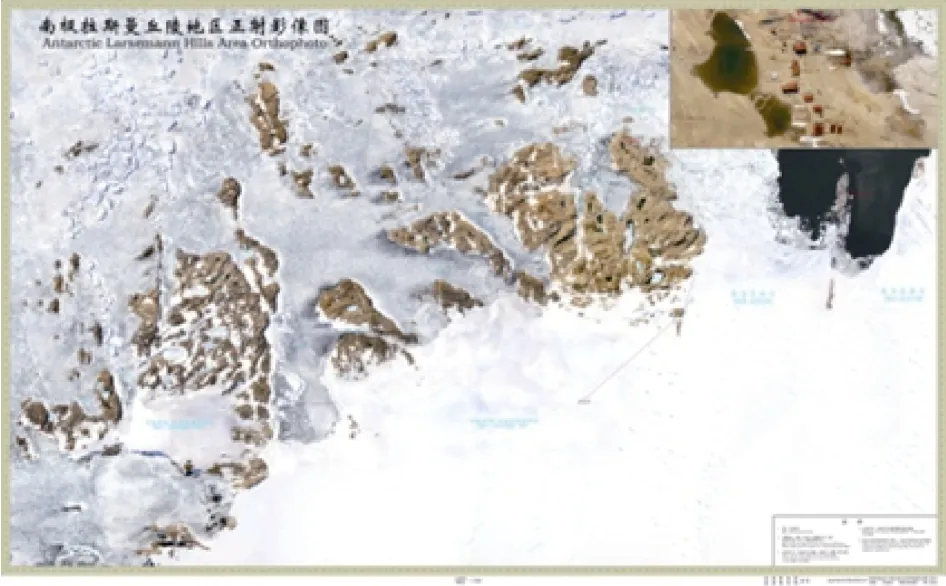
Figure 9 Orthoimage map of the Larsemann Hills.
5.2 Satellite remote sensing mapping and analysis of special ice feature
In the 1980s, multiband satellite remote sensing data were used to fulfill the urgent need for ice feature mapping in remote areas of Antarctica. A relationship between intensity information on the ice surface in the infrared band and altitude was discovered, which was applied to establish an elevation inversion model (Sun et al., 1996).
In 1998, digital satellite image mapping without ground control points was conducted on the ice sheet. This provided satellite imagery of the Grove Mountains with plane positioning accuracy better than 200 m. The different spectral signatures of blue ice, surface snow, and bare rock were employed to extract and map areas of blue ice, which were considered to represent areas with high concentrations of meteorites (Sun et al., 2001).
Interferometric Synthetic Aperture Radar (InSAR)technology was combined with optical stereo and satellite altimetry data to generate high accuracy DEMs for the Grove Mountains core area (Figure 10; E et al., 2004; Zhou et al., 2004) and the Prydz Bay–AIS–Dome A transect.Crevasse detection is important in Antarctic scientific research expeditions for safety reasons but it is also meaningful for ice flow monitoring. A gray level co-occurrence matrix was used to recognize crevasse texture based on images of the Grove Mountains acquired by the SPOT platform. A series of MODIS and Landsat images was used to track seasonal and interannual variations of blue ice extent in the Grove Mountains area.Based on comparison of the edge lines of blue ice, it was established that blue ice coverage has extended toward the east. Moreover, the sensitivity of blue ice areas in relation to changes of climate and shortwave radiation was also revealed. The Grove Mountains has been found a productive area in the search for meteorites in Antarctica.Based on the different spectral characteristics and coherence of snow, blue ice, and bare rocks, areas of blue ice have been extracted from optical images and coherence maps.Following field collections of meteorites and analyses of optical images, moraines have also been identified as sites of meteorite concentration in the Grove Mountains area.Theories regarding meteorite concentration should be analyzed further by considering ice flow dynamics, the mountain blocking effect, katabatic winds, and ice ablation.Moreover, to strengthen the visualization and to improve network sharing of valuable meteorite data, desktop software based on ArcObjects and web software based on ArcIMS have been developed. The desktop software has also facilitated further analysis of meteorite concentration mechanisms in the Grove Mountains area (Zhou et al.,2011).
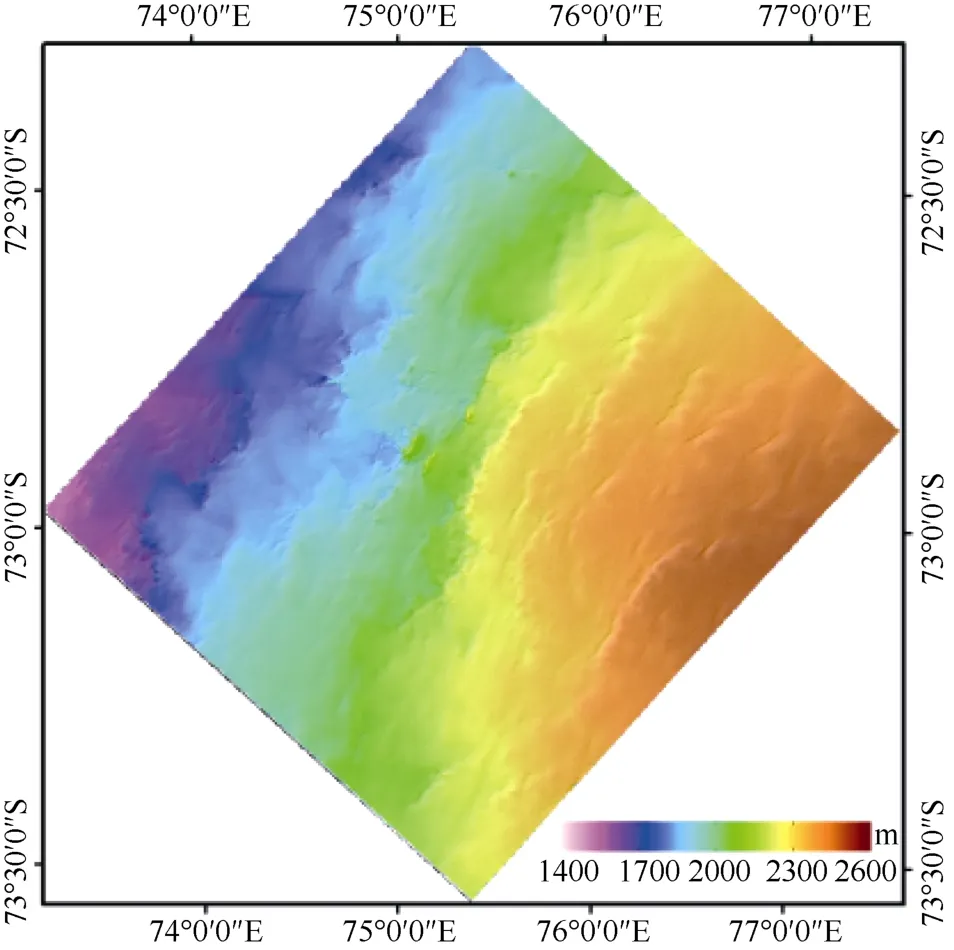
Figure 10 InSAR DEM of the Grove Mountains area.
A revised Landsat image mosaic of Antarctica (LIMA)has been created using the 1073 original Landsat-7 ETM+multiband LIMA collection available from the United States Geological Survey. A comparative statistical analysis among 12 sample regions indicated that the new mosaic has enhanced visual qualities, greater information entropy, and improved information content for land cover classification relative to the original. In addition, a map of blue ice areas was created using algorithms with thresholds based on band ratio and reflectance for ETM+ data and thresholds based on snow grain size for the MOA dataset.
5.3 Ice velocity derivation based on multisource remote sensing data
The flow velocity of a glacier surface is a key input parameter for the calculation of mass balance. SAR interferometry, feature, and offset tracking techniques can be used to determine ice flow velocities. The average ice velocities of both the Polar Record Glacier and the Dalk Glacier were calculated based on multitemporal satellite images and their contribution to sea level was calculated.The ice velocities of the Lambert Glacier–AIS were calculated from a Landsat 7 ETM+ image and an ASTER image using the tracking method.
During the fourth Chinese expedition to the Grove Mountains (2005/2006), 11 corner reflectors were installed by representatives of both Wuhan University and Beijing Normal University, which were intended to help long-term differential InSAR (DInSAR) ice flow measurements(Cheng et al., 2007). Ice flow velocities of both the Polar Record Glacier and the Dalk Glacier were determined using SAR interferometry, feature tracking, and GPS data.Seasonal and interannual ice velocity changes of the Polar Record Glacier were studied using data from the ERS-1/2,ENVISAT, and PALSAR platforms via DInSAR and intensity tracking (Zhou et al., 2014). The InSAR technique was refined using a combination of two interferograms to produce accurate measurements of ice flow velocities. The refined technique was tested on the Grove Mountains area.Ice flow velocities from the baseline combination method were found in reasonable agreement with those measured by short-baseline interferograms (Figure 11).
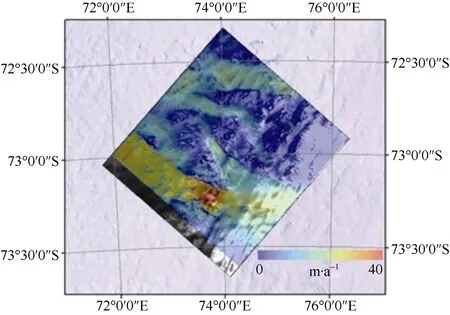
Figure 11 Map of ice flow velocity in the Grove Mountains.
5.4 Sea ice and ice shelf change monitoring based on multisource remote sensing data
The seasonal melting/freezing and the variety of surface temperature of sea ice near the Zhongshan Station were investigated using MODIS data (Figure 12). In consideration of the special Antarctic environment, a new method for sea ice extraction using 0.86 and 1.24 µm MODIS bands has been proposed. The new method was used to obtain the monthly sea ice extent around Antarctica,and monitoring of the change of Antarctic sea ice during 2002–2010 was executed via combination with AMSR-E data. An algorithm was developed to obtain sea ice concentration from altimeter waveforms, and the results were found consistent with those derived using the SSMR and SSM/I instruments.
Changes in the coastline and 18 of the main ice shelves in the Antarctic have been studied based on optical and microwave data, and dynamic Antarctic coastline data from 2002 to early 2011 have been obtained. Using ASAR data from the ENVISAT platform, which has overflown the entire coastline of Antarctica 40 times, the location, type,and time of occurrence of iceberg calving events were established. Moreover, statistical analysis has been conducted on the temporal and spatial variation data with respect to the calving frequency and calving area of Antarctic ice shelves from August 2005 to August 2011.
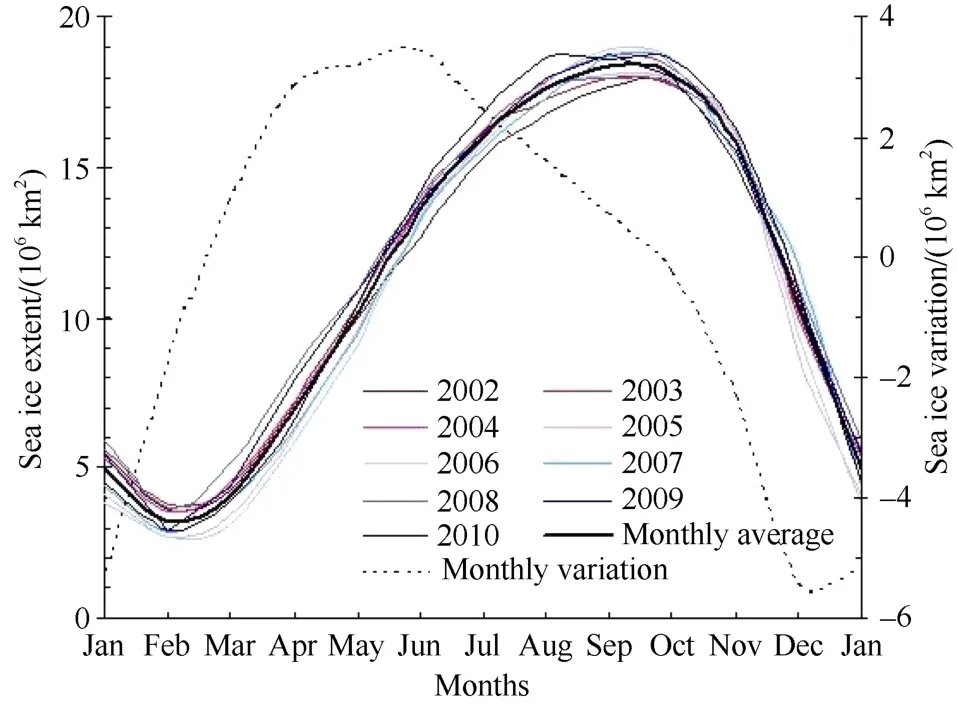
Figure 12 Seasonal change in Antarctic sea ice from 2002–2010.
5.5 Study of Antarctic ice sheet elevation and elevation change based on satellite altimetry
Several DEMs have been developed for the Antarctic ice sheet using satellite altimetry data. For example, a DEM for Dome A was generated using ICESat altimetry data (E et al.,2009a). A 200-m DEM for the Larsemann Hills was generated based on CryoSat-2 data and ground-based elevation points from China, India, and Australia, and by combining ERS-1 and ICESat data, an Antarctic DEM for north of 86°S was generated (Wang et al., 2013). A new 1-km DEM of Antarctica was produced by applying the Kriging method to CryoSat-2 data, which has accuracy of about 0.73 ± 8.398 m (Figure 13; Li et al., 2017).
Satellite altimetry data have also been used for mass balance studies in Antarctica. The rates of change of elevation in the Lambert–Amery system were evaluated using ICESat data acquired during 2003–2007 using a crossover analysis method, and the interannual variability of elevation in subregions was obtained (Shen et al., 2011).The spatial distribution of elevation change along the transect from Zhongshan Station to Dome A was estimated using ENVISAT data based on crossover analysis. A method has been proposed for the detection of surface crevasses in an ice shelf using elevation data derived from ICESat data. This method was tested on the AIS and the results showed that elevation data measured using a satellite laser could be used to extract precise information regarding the position and depth of crevasses on the surface of a polar ice shelf. The surface elevation change of the Antarctic ice sheet was calculated based on ICESat data using a repeat track method, and the mass balance was estimated using an ice density model (Figure 14; Li et al., 2016).
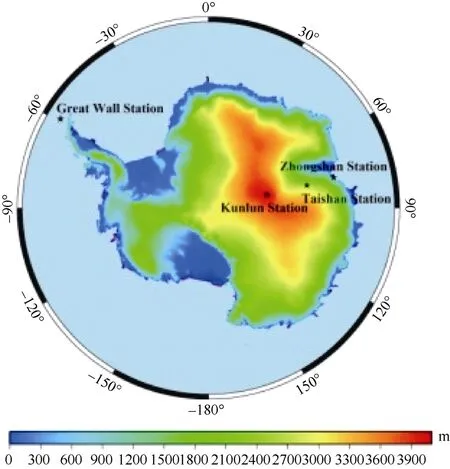
Figure 13 New DEM of Antarctica derived from CryoSat-2 data.

Figure 14 Spatial distribution of Antarctic ice sheet mass balance from ICESat (Li et al., 2016).
5.6 Studies of Antarctic mass balance based on satellite gravimetry
The Antarctic equivalent-water-height time series and its interannual trend on a 1° × 1° grid have been inferred(Figure 15; E et al., 2009b). It was found that the Amundsen Sea Embayment in West Antarctica has a substantial negative rate, the Antarctic Peninsula has a smaller negative rate, and Enderby Land in East Antarctica has a positive rate. The 5-year (from July 2002 to September 2007)equivalent-water-volume variation trends in Antarctica, East Antarctica, and West Antarctica have been determined as−78±37, −3±46, and −75±50 km3·a−1, and the corresponding contributions to sea level change are 0.21 ± 0.1,0.008 ± 0.127, and 0.2 ± 0.14 mm·a−1, respectively. The Post Glacial Rebound model remains the key factor in the study of the Antarctic ice sheet in the GRACE project.

Figure 15 Spatial distribution of Antarctic ice sheet mass balance from the GRACE project. A stands for the Amundsen area,B stands for the Antarctic Peninsula, C stands for the Enderby Land.
5.7 Polar space physics studies
A computerized ionospheric tomography model for the Antarctic has been generated based on GNSS data from the IGS, POLNET, and the Chinese Antarctic Center of Surveying and Mapping. Based on this model, the electron density and total electron content (TEC) have been calculated(Meng et al., 2010). Ground-based GPS data have been used to extract the TEC over West Antarctica, which revealed the Weddell Sea Anomaly (WSA). The WSA was found more obvious in periods of high solar activity. The coverage includes the Weddell Sea, Bellingshausen Sea, and the southern tip of South America, and the anomalies were found to appear at the same time, reflecting short-term wide-extent characteristics. In late spring and early summer, daily double peaks were found to appear. The TEC at noon in summer is lower than in late spring and early summer. Using GPS observations from permanent GPS stations, Zhongshan Station, and IGS stations in Antarctica, highly accurate calculations were performed for ionosphere TEC in the polar area during 2000–2006, and the TEC above GPS stations located at the polar cap, polar cap edge, and in and out of the auroral zone were analyzed comparatively.
The precipitable water vapor (PWV) at the Great Wall and Zhongshan stations was calculated using a ground-based GPS technique, and the results of the GPS/PWV were found consistent with radiosonde/PWV (Cheng et al., 2002). The characteristics of the weather at the Great Wall and Zhongshan stations can be extracted from the above analyses.For example, it was found that the PWV series from the Great Wall Station usually increased rapidly to 20 mm with precipitation occurring over a 3–4-h period. Conversely, the PWV series from Zhongshan Station usually showed small and slow changes, which means there are fewer opportunities to observe precipitation at Zhongshan Station. These results were found to agree well with in situ meteorological observations. Using Constellation Observing System for Meteorology, Ionosphere, and Climate (COSMIC)occultation data from 2011, the atmospheric temperature profiles in Antarctica were inversed, and the tropopause parameters (temperature and altitude) were extracted (Figure 16; Qu et al., 2014). The spatial and temporal Antarctic tropopause variations were analyzed quantitatively. In Antarctica, the temperature lapse rate tropopause is more accurate than the coldest point tropopause, and the occultation method is the same as for ozonesondes and radiosondes. The Antarctic tropopause shows one wave structure with contrary phase, a temperature range from 200 to 230 K, and height from 9 to 11 km. The Antarctic tropopause disappears in winter and spring, and an inversion layer occurs in summer and autumn. The tropopause temperature in winter and spring shows a significant gradient feature. In terms of latitude, the temperature is low near the pole and higher in areas around. In terms of longitude, the temperature is the lowest in West Antarctica.
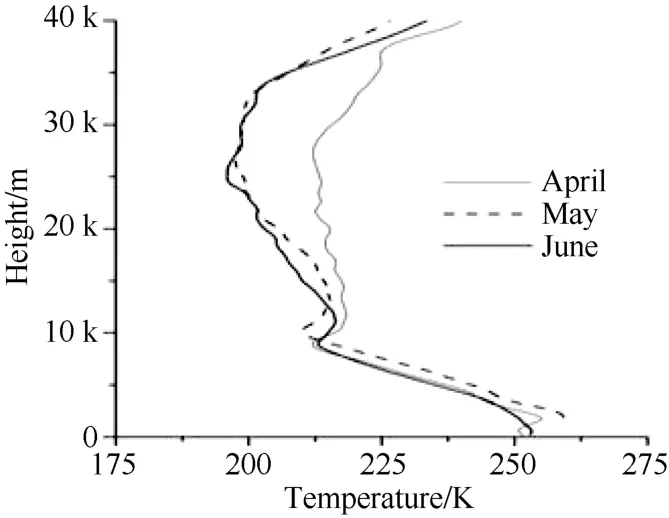
Figure 16 Atmospheric temperature profiles for the Great Wall Station.
6 Prospects
After three decades’ hard work, a basic geodetic datum has been built for the Chinese Antarctic expedition areas;however, a more accurate geodetic reference system should be established using the most advanced techniques of modern surveying, mapping, and remote sensing.
Antarctic snow and ice monitoring is long-term work,and a modern integrated technical platform is needed. The integration of satellite-based, airborne radar, airborne laser ranging, airborne gravity, and ground-based observation systems should be prioritized to provide high-resolution monitoring of snow and ice environments over a range of temporal and spatial scales.
It is intended that a digital Antarctica will be built by establishing a platform for global sharing of polar spatial information. The digital Antarctica will be able to integrate environmental change parameters acquired by multidisciplinary teams, describe polar dynamics variations with high precision, and help solve scientific problems. In addition,it will facilitate data acquisition and sharing, provide a scientific platform for multidisciplinary teams, and support management and decision making by competent authorities.It will also provide scientific and efficient surveying and mapping support, and function as the GIS service platform for future Chinese polar expeditions.
Editorial noteThis paper was originally submitted to that Special Issue“Review of CHINARE Progress over the Last Three Decades” (Vol. 28,No 2, 2017). All of the figures in this article were orginally produced and provided by the authors.
AcknowledgmentsThis work was supported by the Chinese Polar Environment Comprehensive Investigation and Assessment Programs(Grant no. CHINARE2017), Key Program of the National Natural Science Foundation of China (Grant no. 41531069), and National Basic Research Program of China (Grant nos. 2012CB957701, 2013CBA01804-04).
杂志排行
Advances in Polar Science的其它文章
- Preliminary investigation of rubidium distribution in the Grove Mountains area, East Antarctica
- SHRIMP U-Pb zircon geochronology of granites from Sansom Island, Prydz Bay, East Antarctica
- Metamorphism and zircon U-Pb dating of high-pressure pelitic granulites from glacial moraines in the Grove Mountains, East Antarctica
- U-Th-Pb monazite and Sm-Nd dating of high-grade rocks from the Grove Mountains, East Antarctica: further evidence for a Pan-African-aged monometamorphic terrane
- Distribution domains of the Pan-African event in East Antarctica and adjacent areas
- Progress of Antarctic meteorite survey and research in China