Application of shear-sensitive liquid crystal coating to visualization of transition and reattachment in compressor cascade
2018-12-15RuiyuLILiminGAOShuaiZHANGYongzengLITianyuGAO
Ruiyu LI,Limin GAO,*,Shuai ZHANG,Yongzeng LI,Tianyu GAO
aSchool of Power and Energy,Northwestern Polytechnical University,Xi’an 710072,China
bCollaborative Innovation Center of Advanced Aero-Engine,Beijing 100191,China
cAero-Engine Flight Test,Chinese Flight Test Establishment,Xi’an 710089,China
KEYWORDS Compressor cascade;Flow visualization;Leading edge separation;Shear-sensitive liquid crystal coating;Transition
Abstract The present paper aims at introducing Shear-Sensitive Liquid Crystal Coating(SSLCC)technology into compressor cascade measurement for the first time and serves as a basis for better understanding of the influence from the boundary layers.Optical path layout,which is the most significant difficulty in internal flow field measurement,will be solved in this paper by self designed image acquisition device.Massive experiments with different Mach number and incidence are conducted at a continuous subsonic cascade wind tunnel to capture the boundary layer phenomenon.Image processing methods,such as Three-Dimensional(3-D)reconstruction and Hue conversion,are used to improve the accuracy for transition position detection.The analysis of the color-images indicates that complex flow phenomena including transition, flow separation,and reattachment are captured successfully,and the effect of Mach number and incidence on the boundary layer flow is also discussed.The results show that:the Mach number has a significant effect on transition position;the incidence has little effect on transition position,but it has a great impact on the transition distance and leading-edge separation;influenced by the end-walls,the reattachment occurs in advance under positive angle of attack conditions.
1.Introduction
Boundary layer separation and transition to turbulence are ubiquitous in turbomachinery flows and also have a great influence on its performance.1,2In fact,many of the recent advances in the design of high-load blades,such as large turning-angle airfoil,Controlled Diffusion Airfoil(CDA)3and aspirated airfoil,4,5were possible owing to better understanding of the flow unsteadiness in compressor passages and of the influence on the boundary layers.However,due to the complexity of flow phenomenon in compressor,there is no general and accurate separation and transition flow model for computational predictions,which may lead to the failure of the high-load blade design.Thus,the ability to experimentally determine where boundary-layer transition actually occurs over a blade shows great importance:(A)the experimental data can be used as the standard for evaluating the computational predictions;(B)it has a profound meaning for understanding the flow phenomena and loss mechanism.This is the primary motivation of this paper.
There are four well-known boundary-layer transition detection techniques:micromachine-based shear-stress sensor,6,7very thin hot films,8hydrogen bubble flow visualization method9and Shear-Sensitive Liquid Crystal Coating(SSLCC).Although the first three methods have been widely applied to aerodynamic testing in wind tunnel,they are poor in space resolution and would introduce aerodynamic interference.Unlike the previous,the optical-based technique using SSLCC is a preferred method to determine the transition position.
The SSLCC technology has been developing for around fifty years,and it has been applied to external flow measurement successfully.The first attempt to calibrate the color versus shear-stress relationship of a given liquid crystal compound was undertaken by Klein and Margozzi.10The sensitivity to temperature,pressure and the angle of viewing was analyzed,and the results proved the feasibility of using SSLCC technology.The SSLCC was firstly applied as a boundary-layer transition indicator in subsonic flight tests of airplanes by NASA Langley Research Center.11After years of development,SSLCC technology has been extended to a wide range of Mach number:from subsonic12,13to supersonic(Mamax=5).14The shape of measurement object also changes from a simple plate8to cylindrical,14airfoil15and other curved surfaces.However,all of these attempts were made in out flow field in which the layout of optical path is relatively simple and the adverse pressure gradient is relatively small.Although many attempts have been made based on SSLCC,it is seldom applied to internal flow field measurement and it is still unknown whether the SSLCC would be suitable for the measurement of a high load compressor cascade.
In this paper,we aim at introducing SSLCC technology into the measurement of compressor cascade and the analyses of the effects of inlet Mach number and incidence on boundary layer flow based on massive experimental data.Some difficulties and their solutions in internal flow field measurement will be presented,and the flow field diagnostic method will also be discussed.The result from the present study is expected to have an important implication to the transition modelling of boundary layers over compressor blades and give an experience suggestion on application of SSLCC on compressor cascade visualization.
2.Experimental apparatus
2.1.Test rig and compressor cascade
The experiments were conducted in a high-subsonic cascade wind tunnel test rig in the Northwestern Polytechnical University.The test section of the wind tunnel is shown in Fig.1.

Fig.1 High-subsonic cascade wind tunnel test section.

Table 1 Structure parameters of NPU-1 cascade.

Fig.2 Schematic of 3-D cascade.
The compressor cascade used in the experiments is a high load compressor cascade named NPU-1.It has a relatively large solidity 1.1346,which means that the space between two adjacent blades is pretty narrow and leads to the difficulty in optical path layout.The detailed parameters of the cascade are shown in Table 1,and Fig.2 gives the schematic diagram of Three-Dimensional(3-D)cascade.
2.2.Shear sensitive liquid crystal coating
SSLCC technology is based on the characteristics of SSLCC.Under specific lighting,the wavelength of the reflected light from the SSLCC varies with wall shear stress.16All of these wavelengths are within the visible range,so we can obtain the shear stress by analyzing a photo’s color captured by a camera.It is important to note that the maximum of the reflected light can only be viewed in the local shear-vector direction.In detail,as shown in Fig.3,when we view along the direction of the air flow,the response is pretty obvious,while the response will be quite weak when we view upwind.17

Fig.3 Color characteristic of SSLCC.17

Fig.4 Color of paint with different coating thickness.
In this experiment,CN/R3 SSLCC from Hallcrest Company in UK was used.Some basic parameters are described below:(A)the coating belongs to the cholesteric liquid crystals;(B)it is insensitive to temperature in the range of 0–65°C;(C)the maximum available working flow speed of the coating is 200 m/s;(D)the reflected light in the stressless state of the coating is red,and as the stress increases,the green component of the reflected light increases;(E)the exciting light should be natural light or white light;(F)this material dissolves in acetone,petroleum and other organic solvents.
In our work,the SSLCC was diluted with petroleum,and the optimal dilution ration is a volume ratio of 1:40 according to our experience.It is worth mentioning that the choice of the thickness is an important parameter for successful test.On one hand,thin coating thickness will lead to low response;on the other hand,thick coating is easy to be blown away from the surface.According to our test,the optimal thickness should be around 60 μm and the color is shown in Fig.4.
Besides,the application of the SSLCC transition visualization technique requires careful preparation of the test surface.To obtain a clear color contrast,the blades should be painted with a deep-matte flat-black paint that is resistant to the solvents used to thin the liquid crystals.This deep-matte texture provides a surface to which a very thin liquid crystal coating can best adhere,while the black paint allows for reflection of all wavelengths of visible light.After the organic solvent completely evaporates,the blade surface is covered with a uniform and smooth liquid crystal coating.
2.3.Optical device

Fig.5 Image acquisition device.
The most significant difficulty in applying SSLCC technique to the inner flow field measurement lies in the optical path layout,that is,narrow space,large curvature of the blades and shade from each other.An optical device was designed to solve the problem.It is shown in Fig.5,which is a combination of light source and camera.The light source is provided by a group of LED lights,and an electronic regulator is also used to make the voltage and illumination of the light source stable.A professional camera or camcorder is always preferred to capture the high-quality pictures.However,due to the narrow space within the cascade wind tunnel,our choice is limited.Considering the measuring accuracy and size,we choose a professional aviation endoscopic camera finally with a resolution of 320×240.However,not all the pixels are on the blade.The image resolution for 3-D reconstruction after cropping is 210×110.According to the arc length of the blade suction surface,the minimum distance that can be resolved along the blade chord is 0.275 mm.
To minimize the effect of the introduction of the camera and light source on cascade passage flow field,the light source and camera were integrated in one module,which could also make the control system and data transmission system implement easier.
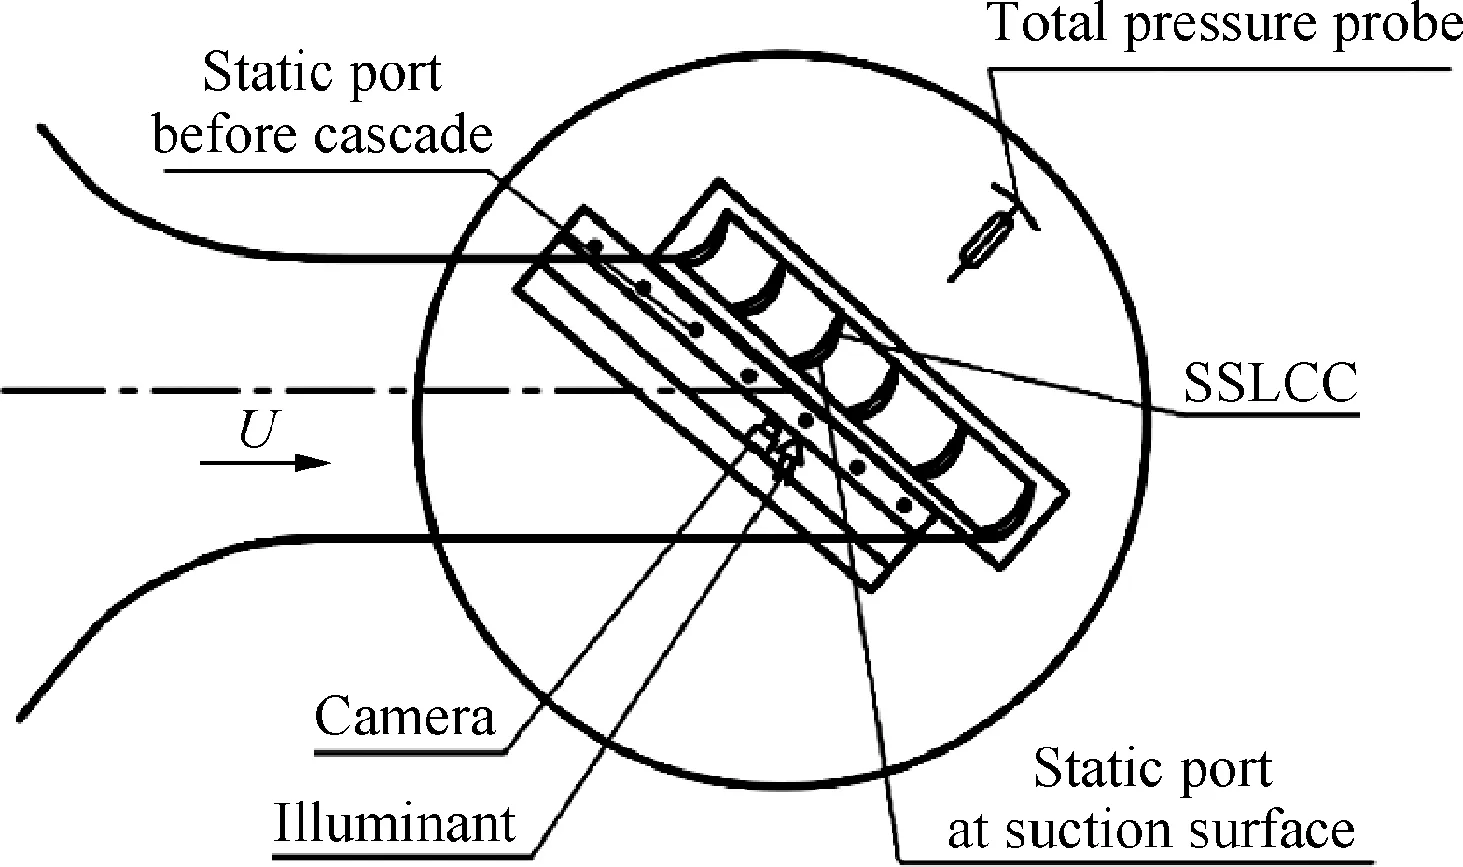
Optical path layout in the wind tunnel is shown in Fig.6.U stands for the velocity of incoming flow and the arrow refers to the flow direction.We place the optical device on the end wall of the wind tunnel and in the upstream of the cascade.This layout has the following advantages:(A)satisfy the requirements of the SSLCC on the optical path;(B)effectively solve the problem of reflection;(C)when changing the angle of attack,the illuminant,the camera and the cascade are relatively stationary,so there is no need to re-adjust the optical path,and the measurement accuracy can also keep the same.

Fig.6 Schematic of optical path layout in wind tunnel.
3.Experiment approach
3.1.Experimental device layout
A special measurement system has been set up for internal flow field measurement by using SSLCC.It includes optical device which has been discussed above,image acquisition,control system,and image processing.A brief description of the measurement system is shown in Fig.7.
The optical device and image acquisition are controlled by a computer,through which we can monitor and collect data in real time.
3.2.Image processing method
Based on the characteristics of shear stress-sensitive liquid crystal,it can be seen that the color of the reflected light is directly related to the magnitude of wall shear stress,which means that we can determine the shear stress by analyzing the color of that.However,although the direction of exciting light is along the main flow,the light angle with suction surface is not consistent due to the large curvature,that is,the color of the reflected light is not only related to the shear stress,but also to the curvature.So,it is hard to measure the shear stress quantitatively,also known as calibration.In our work,only the qualitative analysis is performed to determine the boundary layer flow state.
The image information obtained from the camera is Red-Green-Blue(RGB)value.However,for color measurements,it is more useful to represent the signal in terms of Hue,Saturation,and Intensity(HSI)rather than RGB.18Hue is associated with the dominant wavelength in a mixture of light waves,saturation represents the dilution of a pure color by white light,and intensity relates to the brightness of the light.19The color can be quantitatively described by the Hue value which is obtained by the color gamut,and it can be calculated from the following equations:


Fig.7 Schematic diagram of measurement system.

Fig.8 Color exploded view.
where R,G and B are intensity values of red,green and blue respectively.Fig.8 gives a random color and its corresponding Hue values.To reduce the effect of non-consistent distance from curved surface to illuminant and camera,relative Hue value,which is a difference between the image with stress and that without shear stress,will be used in this paper.
To determine the transition position more accurately,3-D reconstruction is carried out.Direct Linear Transformation(DLT)algorithm was used for 3-D reconstruction,and the equations are given below:

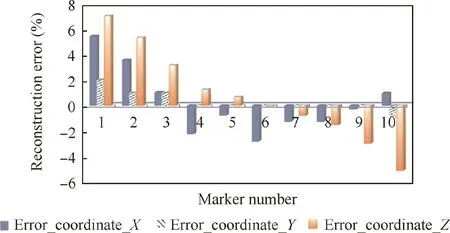
where x and y represent two coordinates of the two dimensional image captured by the camera,X,Y and Z stand for the real 3-D coordinates of the blade,and L1to L11are the coordinate transform parameters.17 markers are used to calculate these parameters by least square method,and the distribution of the markers is shown in Fig.9.The detailed information can be seen in our previous work Ref.20.
Reconstruction error of the coordinates of 10 markers located near 50%span is shown in Fig.10.The marker number is given in Fig.9.It can be concluded that the reconstruction error is within 7%.

Fig.9 Schematic of markers for 3-D reconstruction.

Fig.10 Reconstruction error at ten markers located near 50%blade span in three directions.
4.Experiment results and discussion
The effects of Mach number Ma and flow incidence i on boundary layer flow patterns will be analyzed in this section.Numerous experimental tests have been done with Mach number ranging from 0.10 to 0.25 and with angle of attack ranging from-5°to 5°.It is worth noting that the boundary layer flow pattern variation of suction surface has more obvious effects on aerodynamic performance compared with that of pressure side,so we only focus on the suction side in our research.
4.1.Diagnosis of flow pattern at suction surface boundary layer
According to the color change of the suction surface,we can determine the transition location qualitatively,and we can also determine it quantitatively by using the image analysis method mentioned in Section 3.2.
Fig.11(a)shows the original picture of measuring result at i=0°and Ma=0.12.We extract the Hue–Huerefvalues along the chord near the middle of the blade,which is given in Fig.11(b).Hue and Huerefrepresent the Hue value at stress and stress less state respectively,and the horizontal ordinate y/chord is the normalized chord-wise coordinate.The schematic diagram of the flow pattern is shown in Fig.11(c).There is a separation area near the leading edge of the blade surface,marked as area I.In this area,the color keeps the same.Because when leading edge separation occurs,the shear stress direction is opposite to the main flow direction,which means that the direction of the sight is opposite to the shear stress,so the color is wine due to the weak response(see Fig.3).After a short distance,the Hue–Huerefvalue experiences a sudden increase at the normalized chord of around 0.075 marked as point A,which represents the increase of wall shear stress.From that we can deduce that this is a process of attachment,and the attachment line is shown by a dot dash line in Fig.11(a).The flow transition occurs when the Hue–Huerefvalue increases again and the shear stress of the blade surface increases.From Fig.11(a),we can visually see that the color varies from green to red,and the bounder line is just the transition line.Subsequently,Hue–Huerefvalue is gradually reduced and the color is very close to red,which means that the boundary layer flow becomes all-turbulent.

Fig.11 SSLCC measuring result on blade suction surface(i=0°,Ma=0.12).

Fig.12 Pictures of suction surfaces under different Mach numbers with i=5.0°.
According to the above analysis,we can conclude that the flow pattern and its transition process could be captured and judged by both color and Hue–Huerefvalue of the experimental results.
4.2.Effect of Mach number on boundary layer flow
To study the effect of the incoming Mach number Ma,results under five different Ma(0.10,0.12,0.15,0.20,0.25)conditions are given in Fig.12.

Fig.13 Hue–Huerefalong y/chord at 51%span(i=5.0°,Ma=0.12,0.15,0.20,0.25).
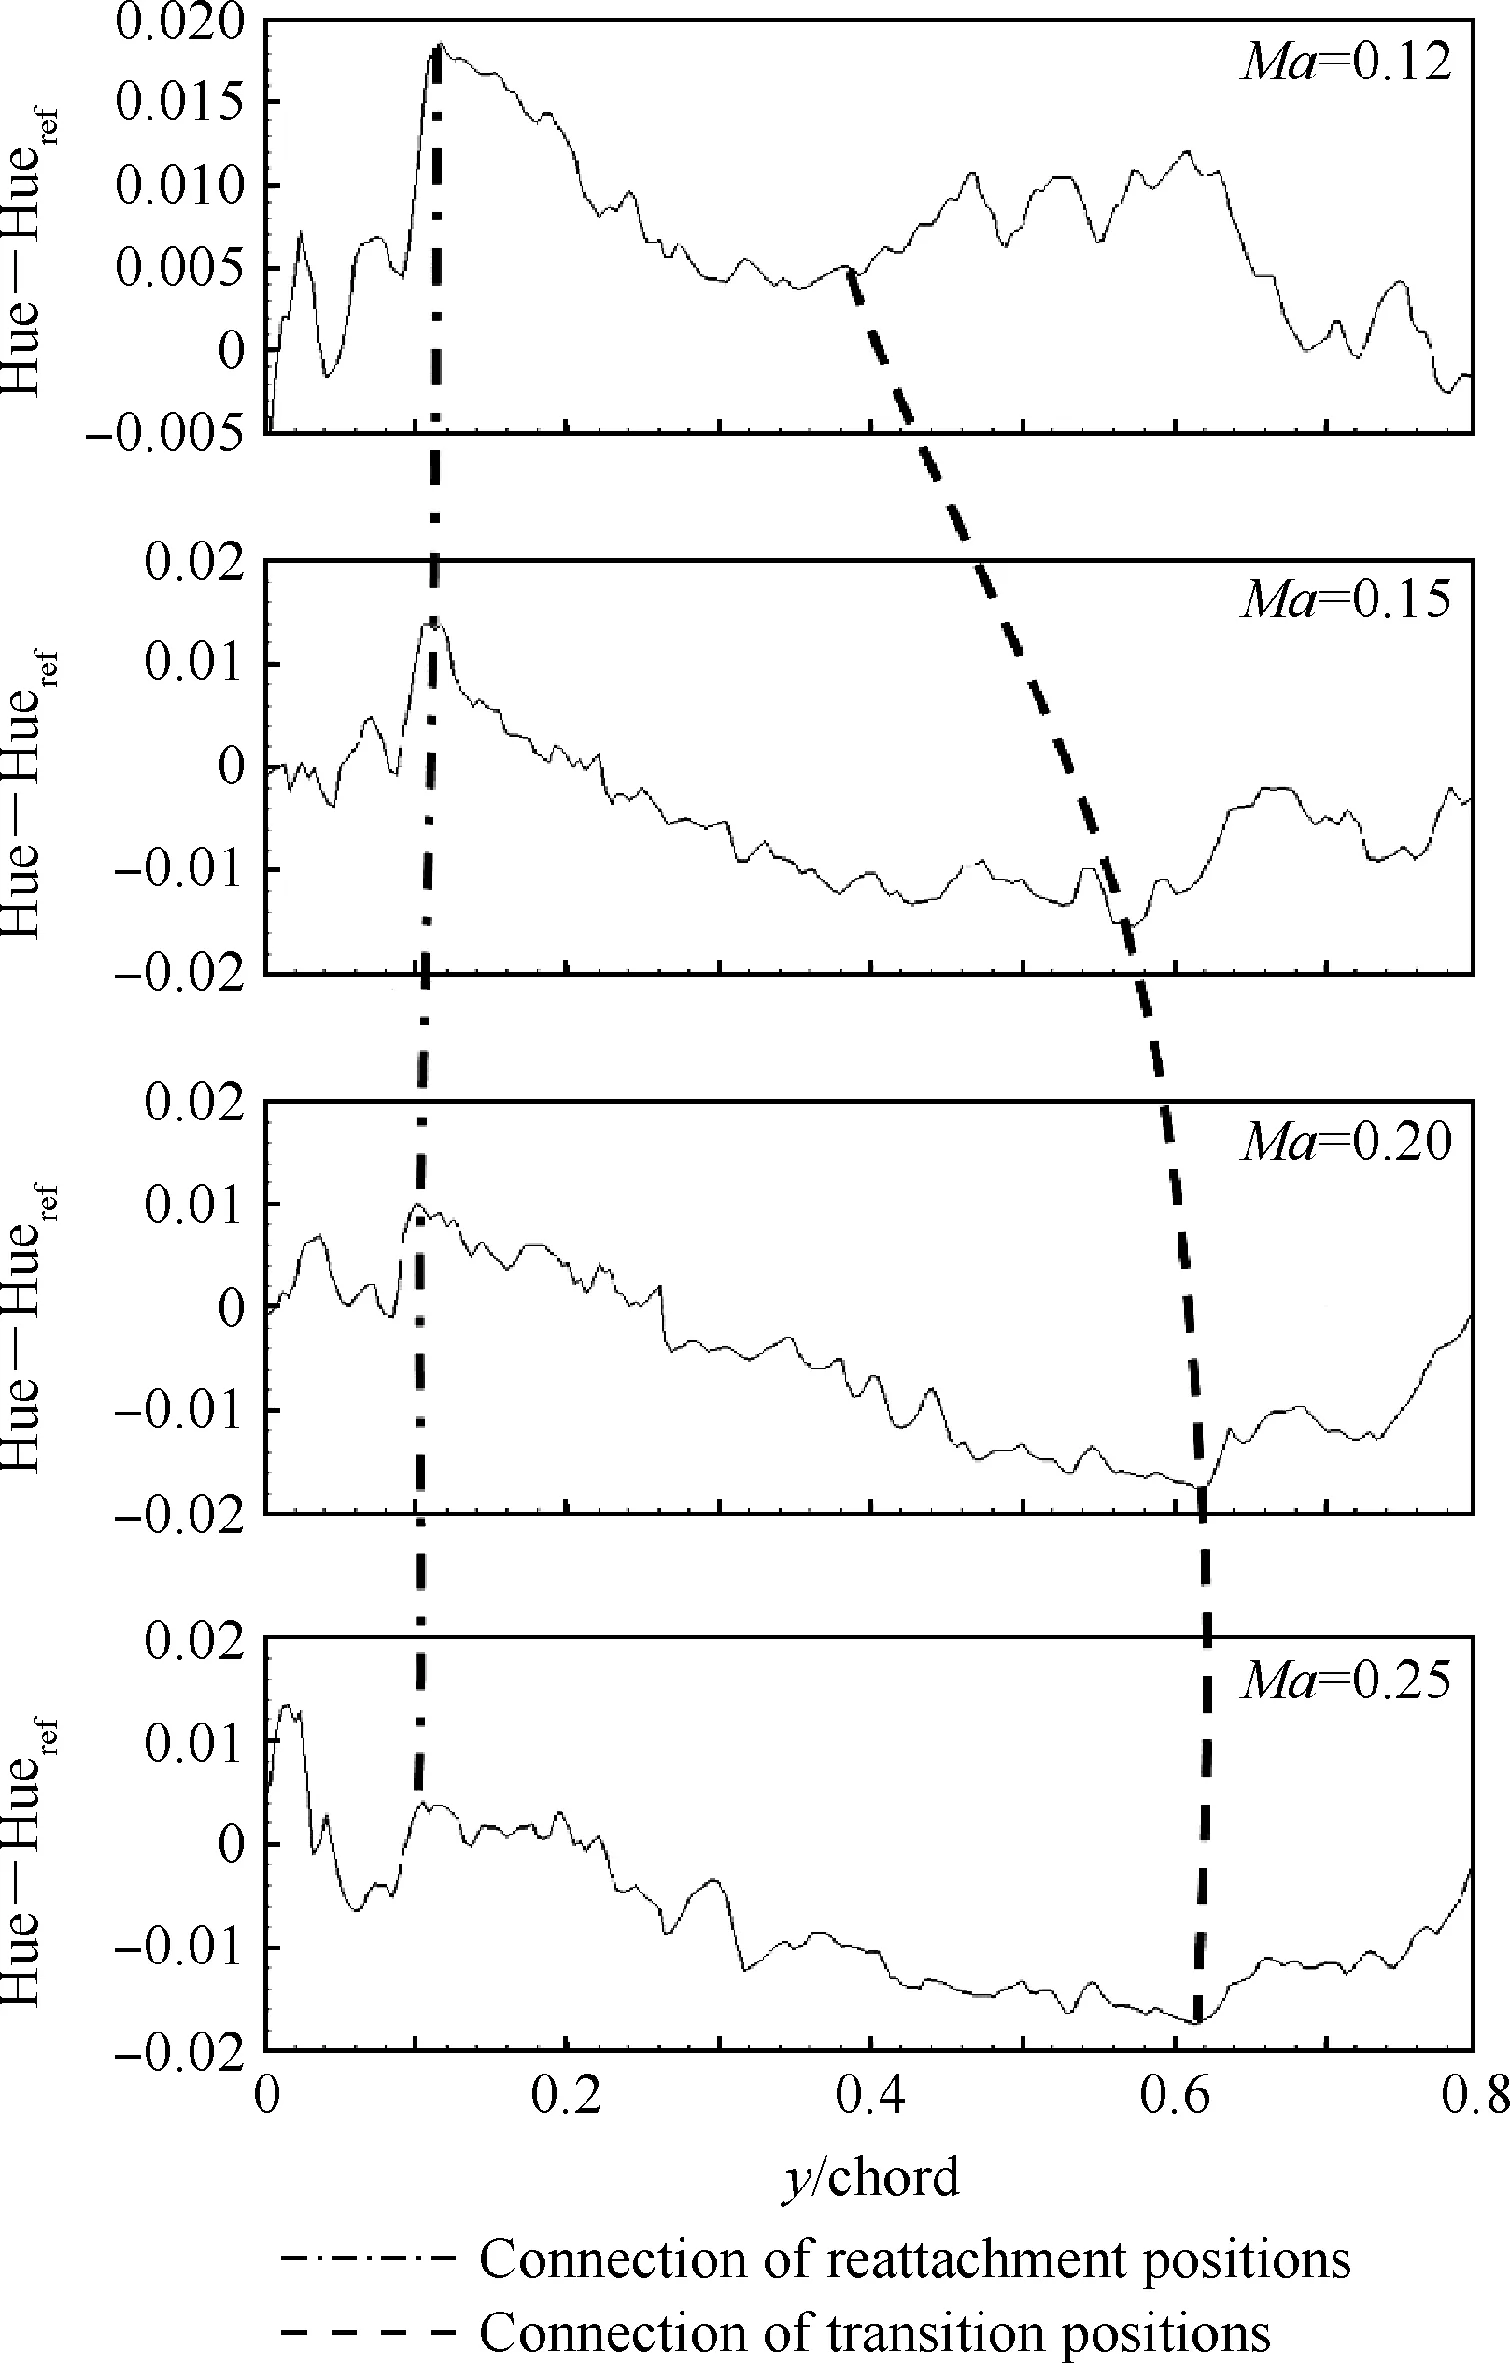
The same as what we discussed above,there is a small region of separation near the leading-edge due to the positive incidence,and we call it leading-edge separation.From leading to trailing edge,according to Section 4.1,the first position where color suddenly changed indicates reattachment,as shown in the form of a white dot dash line.Along the spanwise direction,the reattachment lines bend close to the leading edge from middle of the blade to the end-wall,which can deduce that the reattachment occurs in advance with the influence of the end-walls.Hue–Huerefat nearly middle span are given in Fig.13 to see the changing trend of reattachment and transition position.In the range of Mach number from 0.12 to 0.25,the change of the leading-edge separation area is small,while the transition position shifts backward with Mach number increasing.

Fig.15 Hue–Huerefalong y/chord at 51%span(Ma=0.12,i=-5.0°,-2.5°,2.5°,5.0°).

Fig.14 Pictures of suction surfaces under different angles of attack with Ma=0.12.
4.3.Effect of incidence on boundary layer flow
To study the effect of incidence i,results under the conditions of five different incidences i(-5.0°,-2.5°,0°,2.5°,5.0°)are given in Fig.14,and the Hue–Huerefvalues near middle span along the y/chord are given in Fig.15.It is interesting to find that the transition phenomenon disappears at incidence of 0°,and the leading-edge separation does not occur under negative incidence conditions.In this section,we will discuss the effect of incidence in two aspects:under positive and negative incidence conditions.
As for positive i conditions which are shown in Figs.14(a)and(b),the leading-edge separation can be seen clearly.Fig.14 indicates that incidence has little effect on either the transition position or the area of the leading-edge separation.However,it has a great effect on transition distance.
As for negative incidence conditions which are shown in Figs.14(d)and(e),there is no separation near the leading edge of the suction surface,and the same as positive incidence conditions,the influence on transition position can be neglected,which is described in Fig.15.However,the distance of transition phenomenon is shorter compared with positive incidence conditions.
5.Conclusions
The present experiment test shows that the self-designed optical path layout for optical-based internal flow measurement is feasible.By processing the experimental images,the transition position can be obtained clearly from the measured color change responses of the SSLCC,which indicates that the SSLCC technique can be successfully applied in internal field with high adverse pressure gradient.
The image processing method mentioned in the paper can quantitatively describe the boundary layer flow phenomenon successfully.Leading-edge separation,reattachment and flow transition are captured with different incoming Mach numbers and incidences.
The analysis of the impact of Mach number and incidence on the location of the transition shows that:
(1)the Mach number has a significant effect on transition position,and the transition line shifts backward with the increase of the Mach number.
(2)the incidence has little effect on transition position,but it has a great impact on the transition distance;moreover,the leading-edge separation only occurs under non-negative incidence conditions.
(3)influenced by the end-walls,the reattachment occurs in advance under the conditions of positive angle of attack.
Acknowledgements
This research was co-supported by the National Natural Science Foundation of China(No.51476132),the Innovation Foundation for Doctor Dissertation of Northwestern Polytechnical University(No.CX201713)and the 111 Project(No.B17037).
杂志排行
CHINESE JOURNAL OF AERONAUTICS的其它文章
- Effect of rotor-mounted protrusion on sealing performance and flow structure in rotor-stator cavity
- Experimental and numerical study of chaffcloud kinetic performance under impact of high speed air flow
- Delaunay graph-based moving mesh method with damping functions
- Performance analysis of variable speed tail rotors with Gurney flaps
- Numerical investigation of transitions in flow states and variation in aerodynamic forces for flow around square cylinders arranged inline
- Fatigue behavior of direct laser deposited Ti-6.5Al-2Zr-1Mo-1V titanium alloy and its life distribution model
