Behavior of RC two-way slabs strengthened with CFRP-steel grid under concentrated loading
2018-10-17LuYiyanZhuTaoLiShanZhangHaojun
Lu Yiyan Zhu Tao Li Shan Zhang Haojun
(School of Civil Engineering, Wuhan University, Wuhan 430072, China)
Abstract:A novel composite technique of orthogonally bonding carbon fiber-reinforced polymer (CFRP) strips and steel strips is proposed to improve the performance of reinforced concrete (RC) structures based on co-working of CFRP strips and steel strips. To verify the effectiveness of the method for strengthening RC two-way slabs, seven flat slabs with the dimensions of 1 500 mm × 1 500 mm × 70 mm and an internal reinforcement ratio of 0.22% were prepared and tested until failure under concentrated loading, of which one was unstrengthened, one was strengthened with CFRP strips bonded to its soffit making a grid pattern (termed the CFRP grid), and five were strengthened with a hybrid grid of CFRP strips and steel strips in two orthogonal directions (termed the CFRP-steel grid) to the bottom with steel bolt anchorage. The investigation parameters are the strengthening method, the strip spacing (150, 200, and 250 mm) and the layers of CFRP strips (one layer, two layers, and three layers of CFRP strips are applied for CFRP-steel grid). The experimental results show that the strengthening RC two-way slabs with CFRP-steel grid are effective in delaying concrete cracking and enhancing the load-carrying capacity and deformability in comparison to the CFRP grid strengthening. The yield-line analysis model is proposed to predict the load-carrying capacity of the strengthened slabs. The prediction results are in good agreement with the experimental results.
Keywords:reinforced concrete two-way slab; strengthening method; carbon fiber-reinforced polymer (CFRP)-steel grid; load-carrying capacity; deflection; yield-line
Strengthening or retrofitting of both aging and modern RC structures has become critically important for several reasons[1-7]. One reason is to restore the load-carrying capacity of deteriorated concrete members due to concrete deterioration, corrosion of steel reinforcement or fire exposure. The second is to improve the load-carrying capacity of deficient concrete infrastructures caused by design or construction errors. The third reason is to provide additional strength to concrete structures as a result of increased load demand beyond the original design limit.
The most common strengthening method is based on the use of external bonded technology. External bonded steel plates have been regarded as an effective strengthening method to improve the structural service performance and ultimate capacity of concrete structures for many years. Experimental studies show that externally bonded steel plates can significantly increase the load-carrying capacity and deformation capacity of RC structures[8-10]. However, the main disadvantages of bonding steel plates include the application difficulty due to heavy weight and the durability problem due to potential corrosion, which adversely affects the bond between steel and concrete surface[11-13]. In recent years, external bonded FRP has become an option to strengthen RC structures due to their noncorrosive nature. External bonded FRP can provide confinement and improve the load-carrying capacity of RC members due to their superior tensile strength. Moreover, this method is easier to apply due to their formability and light weight than steel plates. Many experimental studies show that externally bonded FRP laminates can maintain the structural integrity and enhance the structural behavior of a structural member[14-16]. However, many RC elements strengthened with FRP exhibit a drastic reduction in the deformation capacity due to premature FRP debonding[17-24]. Moreover, the strain utilization of FRP laminate typically ranges from 30% to 35% of its tensile strength when the members fail[25-28]. The low efficiency of the strengthening method resulting from debonding may limit its further application.
To take full advantage of both external bonded steel plates and external bonded FRP and to eliminate their disadvantages to some extent, Lu[29]proposed a novel technique, combining these two “simple to apply” strengthening methods into one to achieve a more effective system for strengthening RC structures. Based on the investigation results, the composite strengthening technique showed very promising results. The RC beams strengthened with steel plates and CFRP sheets exhibit higher load-carrying capacity and flexural stiffness, which contributes to retarding the deflection development of strengthened beams[30]. The RC columns strengthened with steel plates and CFRP sheets exhibited better load-carrying capacity, ductility and energy dissipation capacity[31].
A review of the existing literature reveals that, to date, very limited research has been conducted on the strengthening of two-way slabs with steel plate and FRP. This paper investigates the effect of flexural strengthening for RC two-way slabs with CFRP-steel grid in comparison to CFRP grid. The test program consists of seven specimens with similar dimensions and reinforcement details, one of which is unstrengthened and serves as control specimen, while the remaining 6 are strengthened by two different techniques: CFRP grid or CFRP-steel grid bonded on the bottom of slabs. In the second method, steel strips are used instead of whole steel plate and steel bolts are installed at both ends of steel strips, aiming to reduce the weight and avoid premature CFRP debonding. The effect of the strengthening method, strip spacing, number of CFRP layers on the failure modes, load-carrying capacity and strains are studied. The yield-line theory is applied to predict the load-carrying capacity of strengthened slabs.
1 Experimental Program
1.1 Test specimen
All specimens are tested until failure under concentrated loading in a standard laboratory. One is control specimen (Ctrl), one is strengthened with CFRP grid (C1C1-200), and five are strengthened with CFRP-steel grid. Those composite strengthened specimens are named in the form of SxCy-z. For example, S1C2-200 is the specimen strengthened with 1 layer of steel strips inxdirection and 2 layers of CFRP strips inydirection with 200 mm strip spacing.
1.2 Preparation of specimen
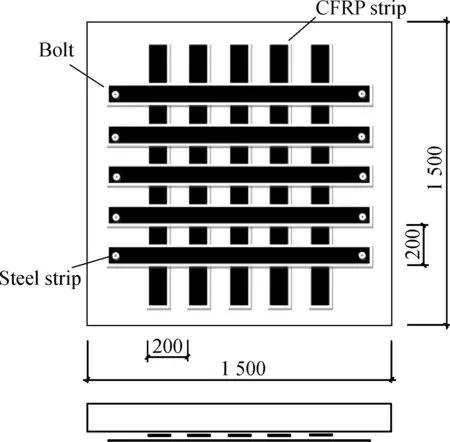
All slabs are square with side dimensions of 1 500 mm and a thickness of 70 mm. The internal reinforcement ratio is 0.22% with 6.5 mm diameter rebars spacing at 200 mm in both directions leaving a concrete cover of 17 mm. The concrete slabs are cast using wooden molds and cured for 28 d in the laboratory. Afterwards, the strengthening technology is followed. Fig.1 shows a schematic view of specimen S1C1-200.
1) The slab bottom is sandblasted by a hand grinder to remove the irregularities and debris.
2) Five fully saturated CFRP strips with the dimensions of 1 300 mm×100 mm×0.111 mm are carefully placed on the designed region of the slab soffit upon which epoxy is applied. A roller is then used to squeeze out excessive epoxy to form a uniform bonding layer.
3) Five steel strips with the dimensions of 1 300 mm × 100 mm × 1.7 mm are adhered in the orthogonal direction with the same strip spacing.
4) Bolts are installed at both ends of each steel strip to provide additional anchorage.
Other specimens are strengthened similarly with variations of material used in thexdirection (CFRP strips or steel strips), strip spacing (150, 200, 250 mm) and the layer of CFRP strips (1 layer, 2 layers, and 3 layers).

Fig.1 The configurations of specimen S1C1-200
1.3 Material properties
The concrete slabs are cast and cured following standard GB 50010—2010[32]. The average strength of concrete cubes is 25 MPa, determined with three 150 mm×150 mm×150 mm concrete cubes after 28 d of curing. The properties of steel strip and rebar are determined by tensile tests in accordance with ISO 6892-1[33]. The yield strength, ultimate strength and modulus of the steel strips are 249 MPa, 329 MPa, and 201 GPa. Those for rebar are 364 MPa, 530 MPa, and 204 GPa, respectively. The properties of CFRP coupons are determined by tensile tests according to ASTM D 3039[34]. The nominal thickness, tensile strength, modulus, and elongation of the CFRP are 0.111 mm, 3.02 GPa, 235 GPa and 2.42%, respectively.
1.4 Test setup and instrumentation
Before casting concrete, all specimens are fitted with 14 strain gauges bonded on the rebars, as shown in Fig.2(a). After strengthening, 15 strain gauges are bonded on the similar location of CFRP strips and steel strips, as shown in Fig.2(b). After the specimen is placed on the roller supports with a span of 1 400 mm, five linear variable differential transducers (LVDTs) are located at four corners on the top of slab and the center of slab soffit to measure displacement. The test is carried out with a universal hydraulic jack (capacity of 300 kN), the concentrated load is applied through a steel plate with the dimensions of 200 mm×200 mm×20 mm at the center of slab, as shown in Fig.3. The load is applied with an increment of 0.5 kN. Each loading level is maintained for 5 min to properly monitor the onset of crack. After concrete cracking, the interval becomes 10 min.

(a)(b)

(a)(b)
2 Experimental Results
2.1 Failure modes of specimens
The failure mode of specimen Ctrl is flexural failure. The concrete crack occurs at the center of slab bottom at 10 kN; more cracks appear and develop diagonally with the increase of load. Inspection of the slab soffit shows a crack pattern radiating outward from the center to corners, as shown in Fig.4(a). The failure occurs at 38 kN with cracks over 1.5 mm width and a mid-span deflection of 19.7 mm, showing good ductility.
Specimen C1C1-200 also exhibits flexural failure. The concrete cracks form in the unstrengthened region of the slab at 18 kN. After the yield of the rebar beneath the loading area, the concrete cracks on the slab soffit develop quickly. Finally, the specimen fails with a sudden rupture of CFRP at 95 kN, accompanied with audible cracking of the epoxy resin, as shown in Fig.4(b).
The typical failure mode of CFRP-steel grid specimens is the flexural failure. As the load increases, firstly, the concrete crack occurs at the center of slab soffit at about 20 kN; secondly, the steel strips beneath the loading area begin to yield; thirdly, the internal rebars yield and propagate diagonally; finally, the concrete cracks widen and followed by the partial debonding of steel strips as shown in Fig.4(c). It should be mentioned that the CFRP strips also debond in several specimens, but significant deflections and rebar yielding are observed during testing. Thus, the failure mode of these specimens can be considered as flexural failure. On the slab soffit, the concrete cracks are narrower and more intensive than those in specimens Ctrl and C1C1-200 at failure, and small cracks even develop at the ends of CFRP strips. This is because the stress distributes uniformly along the CFRP strips well confined by orthogonal steel strips.

(a)(b)(c)
2.2 Load-carrying capacity enhancement
As shown in Tab.1, all strengthened specimens achieve an increase in both cracking load and load-carrying capacity over control specimen. The cracking load of S1C1-200 (20 kN) and C1C1-200 (18 kN) are 100.0% and 80.0% higher than that of specimen Ctrl (10 kN), respectively. The higher cracking load of S1C1-200 is because the thick steel strips provide more enhancement on the elastic stiffness of slab. The ultimate load of S1C1-200 (116 kN) and C1C1-200 (95 kN) are 205.3% and 150.0% higher than that of specimen Ctrl (38 kN), respectively. The higher load-carrying capacity of S1C1-200 is due to the fine confinement on CFRP provided by the steel strips. Therefore, it can be concluded that these two strengthening methods can delay the concrete cracking and improve the load-carrying capacity of RC two-way slabs significantly, and the CFRP-steel grid strengthening technology is more effective.
For CFRP-steel grid specimens, the cracking load and ultimate load decrease with the increase of strip spacing, and increase with the increase of the layers of CFRP strips. The cracking load of S1C1-200 (20 kN) and S1C1-250 (18 kN) are 9.1% and 18.2% less than that of S1C1-150 (22 kN), respectively. The ultimate load of S1C1-200 (116 kN) and S1C1-250 (108 kN) are 9.4% and 15.6% less than that of S1C1-150 (128 kN), respectively. This is because considering the strips as equivalent steel reinforcement, the reinforcement ratio increases with the reduction of strip spacing. The additional reinforcement can delay the concrete cracking and enhance the load-carrying capacity of slabs. On the other hand, more layers of CFRP strips lead to higher cracking load and ultimate load. The cracking load of specimen S1C2-200 (22 kN) and S1C3-200 (26 kN) are 10.0% and 30.0% higher than that of specimen S1C1-200 (20 kN), respectively. The ultimate load of specimen S1C2-200 (124 kN) and S1C3-200 (158 kN) are 6.9% and 36.2 higher than that of specimen S1C1-200 (116 kN), respectively. This is confirmed by the failure of specimen S1C3-200 observed first along the steel strip direction.

Tab.1 Test results of all specimens
2.3 The load versus deflection response
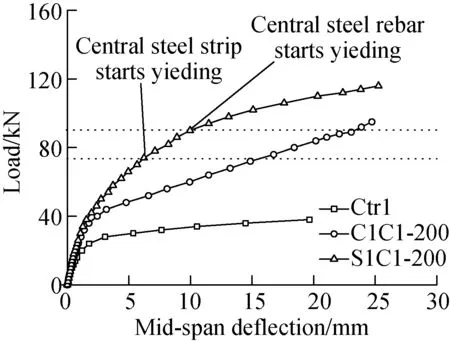
Fig.5 shows the relationships between load and mid-span deflection for all specimens. For specimen Ctrl, the load increases almost linearly before concrete cracking, and almost keeps constant after the yield of rebar, as shown in Fig.5(a). On the other hand, specimen C1C1-200 behaves in a relatively stiffer manner with smaller deflection than that of specimen Ctrl at the same load. When the load exceeds 45 kN, the deflection increases almost linearly. This is because the diagonal cracks are fully developed and the CFRP strip providing stiffness is a linear elastic material. For specimen S1C1-200, the curve comprises four nearly linear parts. The first change in stiffness is caused by the onset of concrete cracking on slab soffit, the second by the onset of steel strip yielding, and the third results from the rebar yielding. The curve is similar to that of C1C1-200 before concrete cracking. Afterwards, the stiffness is much higher than that of C1C1-200 due to the higher stiffness provided by the thicker steel strip than CFRP strip. However, the stiffness decreases gradually with the yielding of steel strips, even becomes lower than that of C1C1-200 after 96 kN, at which steel strips at diagonal section yield. The maximum deflection of S1C1-200 is 25.3 mm, 2.2% and 28.4% larger than that of specimens C1C1-200 (24.7 mm) and Ctrl (19.7 mm).
Fig.5(b) shows the curves for specimens strengthened with different strip spacings. The flexural stiffness declines with the increase of strip spacing. Regarding the strips as additional rebars, this is because the equivalent reinforcement of strengthening strips decreases with the increase of strip spacing.
Fig.5(c) compares the curves for specimens strengthened with different CFRP strip layers. With more layers of CFRP strips, the flexural stiffness of the specimen increases while the deformation capacity degrades significantly. The maximum deflections of specimen S1C2-200 (20.5 mm) and S1C3-200 (15.2 mm) are 19.0% and 39.9% lower than that of specimen S1C1-200 (25.3 mm). Therefore, there should be an upper limit of CFRP strips layers in strengthening practice to make full use of materials.

(a)(b)(c)
Fig.5Load versus mid-span deflection relationship for specimens.(a) Different strengthening methods; (b) Different strip spacings; (c) Different CFRP strip layers
2.4 The load-strain relationship
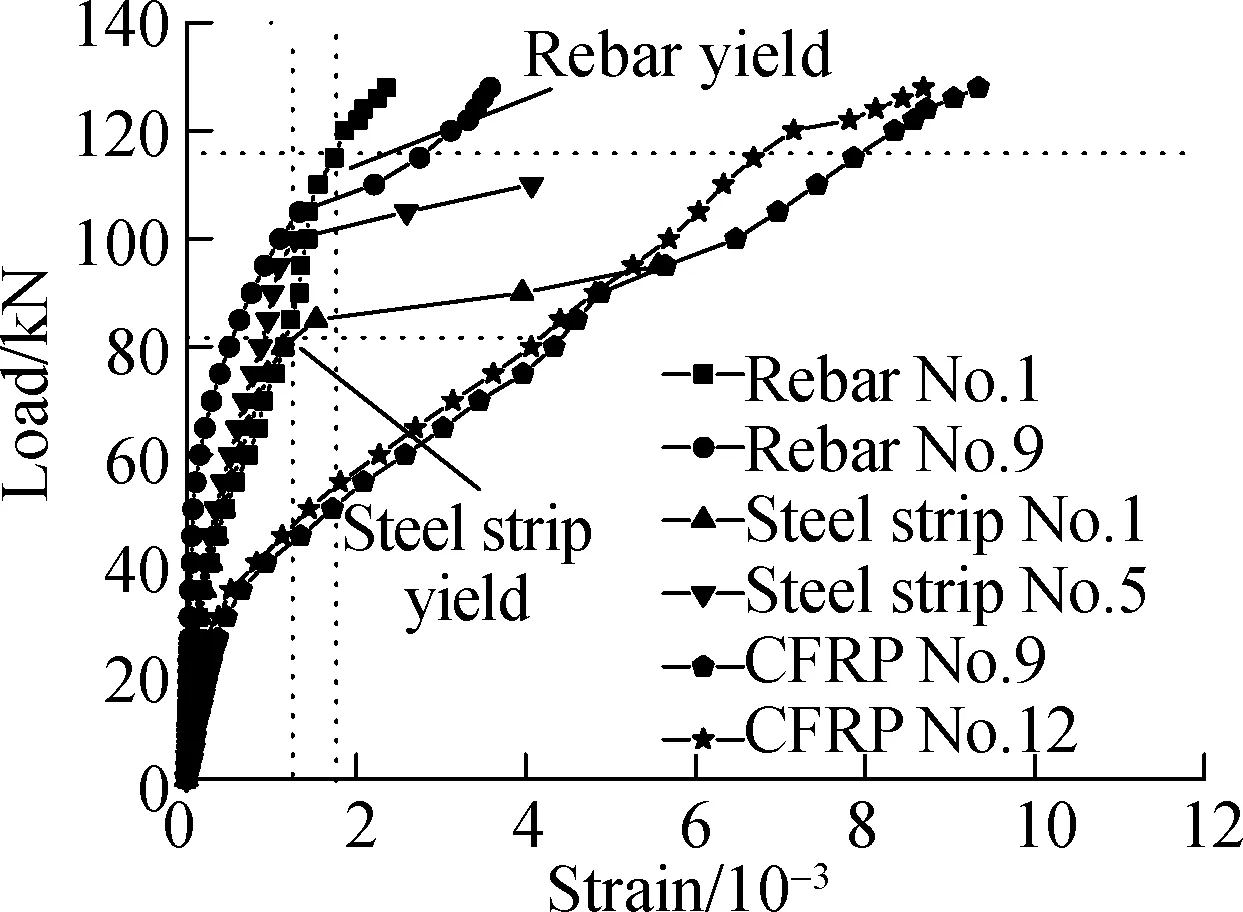
Fig.6 shows the load-strain relationship for specimens Ctrl, C1C1-200 and S1C1-200. For specimen Ctrl, the rebar strain increases slowly before concrete cracking, grows nonlinearly with the developing of cracks, and increases sharply after the yield of central rebar. The curve of specimen C1C1-200 behaves similarly. After the cracks are fully developed, the CFRP strain increases almost linearly. The rebar strain is much lower than that of specimen Ctrl at the same load, and the yield load of central rebar is almost twice that of specimen Ctrl. It means that the CFRP grid shares the load for rebars effectively. For specimen S1C1-200, there is an obvious turning point when rebar yields, after which the CFRP strain increases much faster. This is because the load is mainly carried by CFRP strips afterwards. Compared with C1C1-200, the rebar strain and CFRP strain are relatively lower at the same load, and the yield load of the central rebar is 42.2% higher. It means that the CFRP-steel grid shares the load for rebars more effectively.
Fig.7 shows the load-strain relationship for specimens strengthened with different strip spacings. The yield loads of central steel strip and central rebar show an obvious descending trend with larger strip spacing. At the same load, the strains of steel strip, rebar and CFRP strip are the lowest in S1C1-150, then in S1C1-200, and the highest in S1C1-250. Finally, the ultimate CFRP strain of S1C1-200 (1.054 7×10⁻²) and S1C1-250 (9.680×10⁻³) are relatively higher than that of S1C1-150 (9.355×10⁻³). It indicates that a higher utilization ratio of CFRP can be obtained with larger strip spacing.
Fig.8 shows the load-strain relationship for specimens strengthened with different CFRP strip layers. The yield loads of central steel strip for S1C2-200 (78 kN) and S1C3-200 (86 kN) are 21.9% and 34.4% higher than that of S1C1-200 (64 kN). The yield loads of central rebar for S1C2-200 (102 kN) and S1C3-200 (126 kN) are 12.1% and 38.5% higher than that of S1C1-200 (91 kN). For the strains of steel strip, rebar and CFRP strip under the same load, S1C1-200 gains the highest value, followed by S1C2-200, and S1C3-200 in succession. The maximum central CFRP strains for S1C2-200 (6.697×10⁻³) and S1C3-200 (6.483×10⁻³) are 36.5% and 38.5% lower than that of S1C1-200 (1.054 7×10⁻²). It can be concluded that more CFRP strip layers delay the yield of steel strip and rebar, enhances the load-carrying capacity significantly, but the additional CFRP strips may not be fully utilized.

(a)(b)(c)
Fig.6Load versus strain relationship for specimens strengthened with different methods.(a) Ctrl; (b) C1C1-200; (c) S1C1-200

(a)(b)(c)
Fig.7Load versus strain relationship for specimens strengthened with different strip spacings.(a) S1C1-150; (b) S1C1-200; (c) S1C1-250

(a)

(b)

(c)Fig.8 Load versus strain relationship for specimens strengthened with different CFRP strip layers(a) S1C1-200; (b) S1C2-200; (c) S1C3-200
3 Prediction of Load-Carrying Capacity
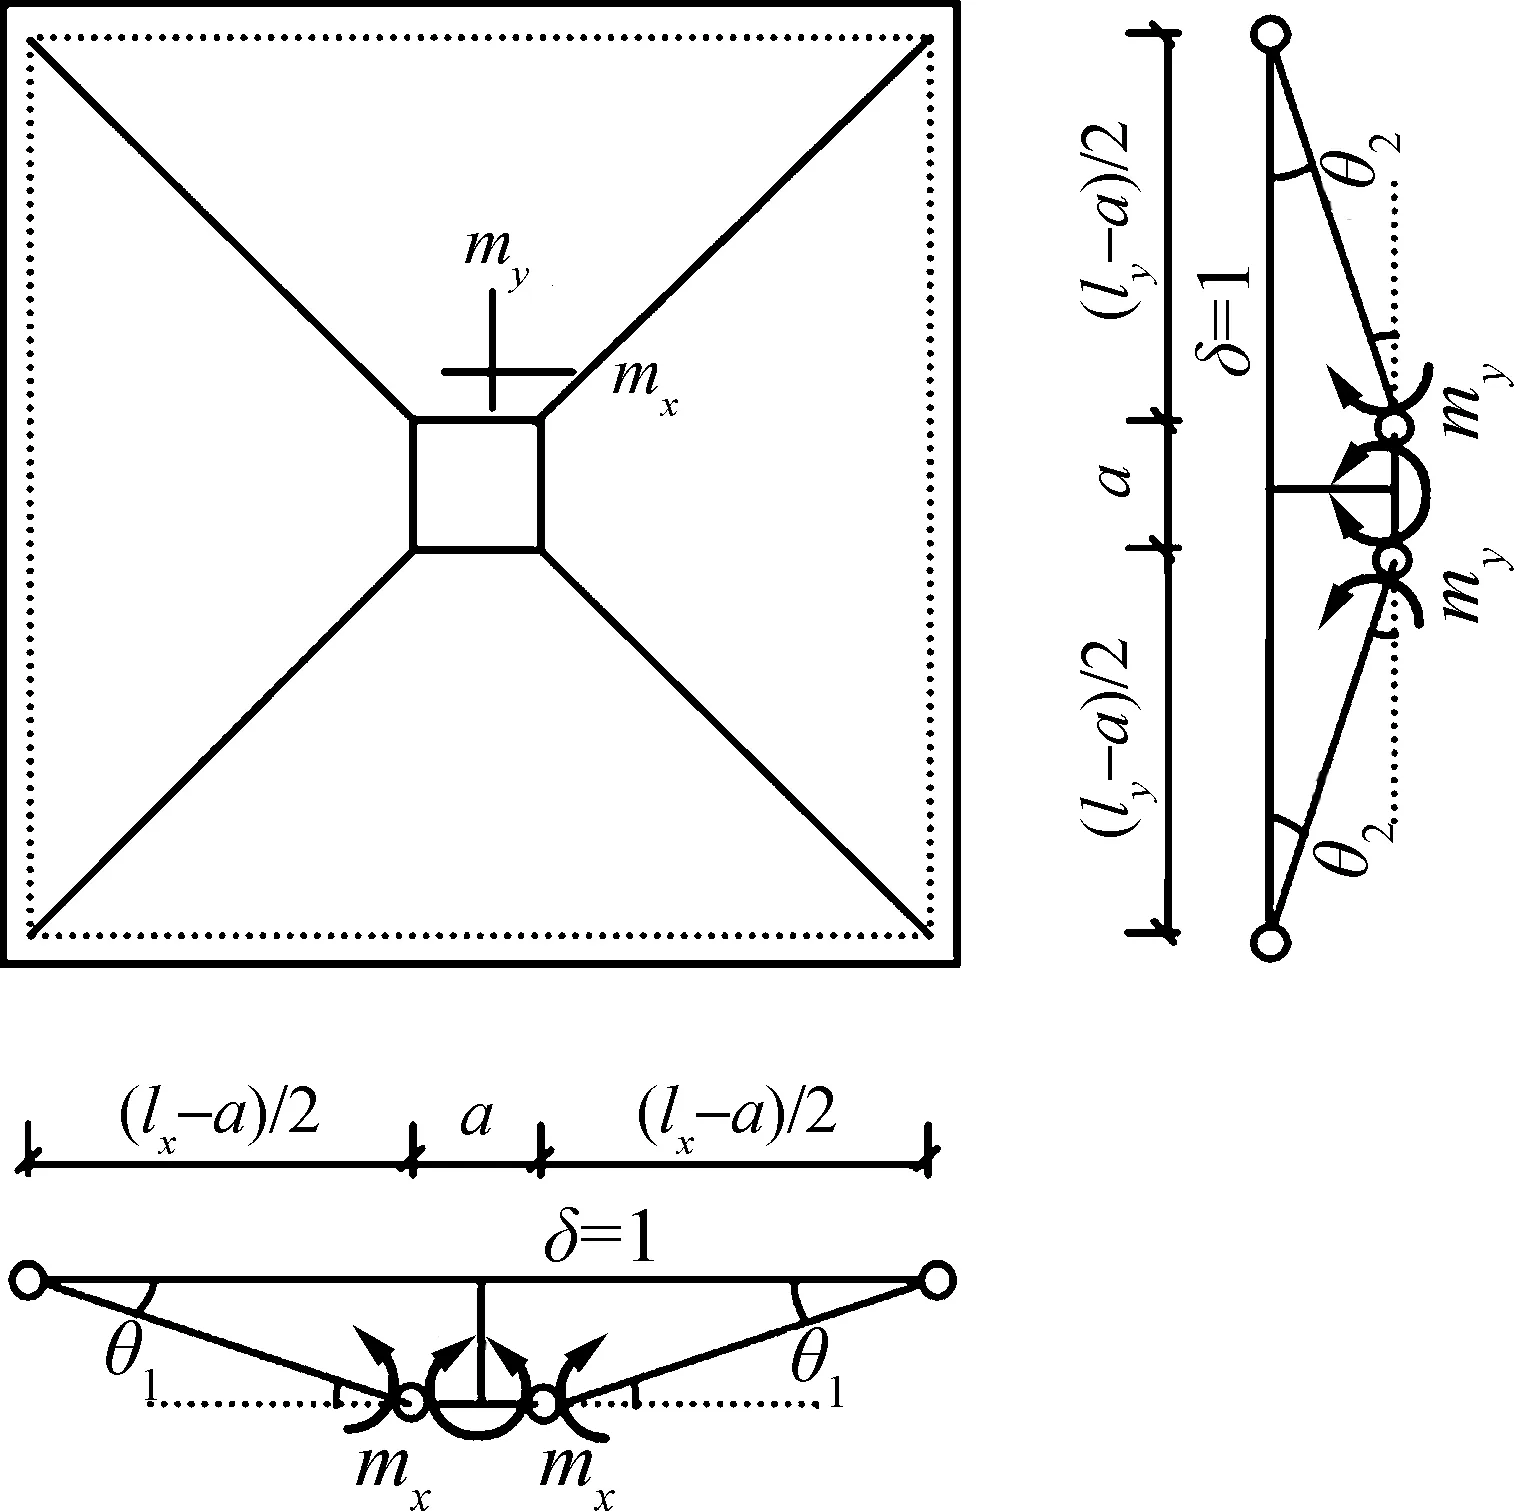
Fig.9 shows a typical yield-line failure pattern for a simply supported square slab, which agrees very well with the cracks developed as shown in Fig.4. Therefore, the yield-line analysis method is applied for the load-carrying capacity calculation.

Fig.9 Typical yield-line pattern
Supposing that the virtual displacement (δ) along the concentrated load is 1, the internal virtual work is equal to the product of flexural momentmiand rotationθialong each yield lineli, i.e.
Wi= ∑miliθi=4mxlx1θ1+4myly1θ2+
2mxlx2θ1+2myly2θ2
(1)
(2)
wherelxandlyare the net span between roller supports, taken as 1 400 mm;ais the width of loading plate, taken as 200 mm.
On the other hand, the external virtual work can be written as
We=Pc·1=Pc
(3)
wherePcis the concentrated load.
According to the principle of virtual work, the internal virtual work is equal to the external virtual work. Thus, the load-carrying capacityPccan be written as
(4)
Since all specimens exhibit flexural failure, the equations for the load-carrying capacity of flexural strengthened specimens in standard GB 50367—2013[35]are also suitable for specimens in this study.
In thexdirection, the load-carrying capacity per unit lengthmxcan be written as
(5)
whereα1is an equivalent efficient, taken as 1.0;fcis the concrete compressive strength;bis the section width, taken as 1 000 mm;xis the concrete compression height;fyandfaare the yield strength of rebar and steel strip, respectively;AsandAaare the area of rebar and steel strip, respectively;his the height of member;h0is the effective height of member.
In theydirection, the load-carrying capacity per unit lengthmycan be written as
(6)
whereσcfis the CFRP stress;Acfis the area of CFRP strip.
In the case that CFRP strip partially debonds in some specimens, the value ofσcfis calculated as[36]
(7)
whereEcfandtcfare the elastic modulus and thickness of the CFRP strip, respectively;Gcfis the interfacial fracture energy;ftis the concrete tensile strength;βwis the width coefficient;bfis the width of CFRP strip, taken as 100 mm; andbcis the calculation width of concrete strip.
Tab.2 compares the predicted strengthPcwith the experimental resultsPu. The ratioPc/Pufor CFRP-steel grid strengthened specimens is 0.93 with a coefficient of variation (COV) of 0.10. In addition, the load-carrying capacity of ten two-way slabs strengthened with FRP from other references[37-38]are collected to verify the accuracy of these equations in predicting the load-carrying capacity. The prediction and experimental strengths agree well with a mean value of 0.98 and COV of 0.09.

Tab.2 Comparison of load-carrying capacity between prediction and experimental results
4 Conclusions
1) All specimens exhibit a flexural failure mode with visible deflections. Compared with specimen Ctrl, the cracking load and the load-carrying capacity increase at least 80.0% and 150.0% for strengthened specimens. These promising advantages mean that these two strengthening methods are very effective in strengthening the RC two-way slabs.
2) The CFRP-steel grid strengthening method takes full advantage of CFRP strips and steel strips. It is more effective because the cracking load and load-carrying capacity of S1C1-200 are 11.1% and 22.1% higher than that of specimen C1C1-200.
3) For slabs strengthened with CFRP-steel grid, longer strip spacing degrades the load-carrying capacity and the slab stiffness, but higher CFRP strain can be obtained. More layers of CFRP strips increase the load-carrying capacity, decrease the deflection capacity, and degrade the utilization of CFRP strips. Therefore, the layers of CFRP strips should be limited in practice to avoid brittle failure and material waste.
4) The failure patterns of strengthened slabs agree with the yield-line pattern well. Thus, the yield-line analysis model is suitable for load-carrying capacity prediction. A comparison between the prediction and the experimental results shows good agreement.
杂志排行
Journal of Southeast University(English Edition)的其它文章
- A recognition model of survival situations for survivable systems
- Big data assessment on the operating characteristics of on-line taxis and thoughts on relevant policies
- Experimental study of the onset of nucleate boiling in vertical helically-coiled tubes
- Syntheses and calculation of (E)-4-chloro-4’-ethoxystilbene and (E)-4,4’-dichlorostilbene
- A weighted selection combining schemefor cooperative spectrum prediction in cognitive radio networks
- Damage evolution analysis of cast steel GS-20Mn5V based on modified GTN model
