Impact of Interannual Variation of Synoptic Disturbances on the Tracks and Landfalls of Tropical Cyclones over the Western North Pacific
2018-10-16XingyanZHOURiyuLUandGuanghuaCHEN
Xingyan ZHOU,Riyu LU∗,and Guanghua CHEN
1State Key Laboratory of Numerical Modeling for Atmospheric Sciences and Geophysical Fluid Dynamics,Institute of Atmospheric Physics,Chinese Academy of Sciences,Beijing 100029,China
2University of the Chinese Academy of Sciences,Beijing 100049,China
3Center for Monsoon System Research,Institute of Atmospheric Physics,Chinese Academy of Sciences,Beijing 100029,China
ABSTRACT This study investigates the tropical cyclone(TC)activity associated with the two leading modes of interannual variability in synoptic disturbances.Both leading modes are found to be related to a dipole pattern of TC occurrence between the subtropical western North Pacific and the South China Sea.Therefore,in this study we performed composite analyses on TC tracks and landfalls,based on the cases of combined modes,to highlight the differences.The composite results indicate that these cases are characterized by distinct features of TC tracks and landfalls:more TCs tend to take recurving tracks and attack eastern China,Korea and Japan,or more TCs exhibit straight-moving tracks and hit the Philippines,Vietnam and southern China.Further analyses suggest that these distinctions in the TC prevailing tracks and landfalls can be attributed to the differences in large-scale steering flow and TC genesis location.
Key words:tropical cyclone,landfall,track,interannual variability,synoptic disturbance
1.Introduction
Tropical cyclones(TCs),as one of the worst natural disasters,are often accompanied by high wind,heavy rain and a storm surge.Particularly,landfalling TCs cause frequently huge losses of human life and property damage.It is well known that the western North Pacific(WNP)spawns intense TCs the most frequently among the oceanic basins,making Asian coastal countries suffer the tremendous threat(e.g.,Ho et al.,2004;Li et al.,2017).Thus,better understanding the variation of landfalling TCs over the WNP becomes essential to disaster mitigation.
The location where a TC makes landfall is largely determined by its track.Previous studies have identified three prevailing tracks over the WNP:westward-moving(or straight moving),recurving-landfall,and recurving-ocean(e.g.,Elsner and Liu,2003;Wu et al.,2005;Colbert et al.,2015;He et al.,2015).The straight-moving TCs tend to strike the Philippines,Vietnam and southern China,and recurving TCs threaten eastern China,Korea and Japan,or displace over the ocean without landfall.
Two major factors can contribute to TC tracks:largescale steering flow and genesis location (Wu and Wang,2004;Colbert et al.,2015).It has become well known that steering flow essentially control TC tracks.The modulation of steering flow has been used to explain the changes in TC tracks associated with El Niño–Southern Oscillation(ENSO)(Wu et al.,2004),stratospheric quasi-biennial oscillation(Ho et al.,2009),teleconnection patterns(Choi et al.,2010),intraseasonal oscillation(Li and Zhou,2013;Yang et al.,2015),sea surface temperature(SST)anomalies in the tropical north Atlantic(Gao et al.,2018),and long-term trends of TC tracks(Ho et al.,2004;Wu et al.,2005;He et al.,2015).The variation in steering flow has also been used to project future change in TC tracks(Wu and Wang,2004;Murakami et al.,2011).On the other hand,TC genesis location can also influence its track.TCs forming farther eastward have a higher probability to recurve(Wu et al.,2004;Yokoi et al.,2013;Mei and Xie,2016).This conclusion was further confirmed numerically,revealing that more(less)TCs occur south of Japan and less(more)over the SCS,if the TC formation locations are shifted 10°eastward(westward)(Wu and Wang,2004).
The synoptic disturbances in the tropics play a crucial role in affecting TC genesis.TCs originate from synoptic dis-turbances,and strong synoptic disturbances favor TC formation(e.g.,Gray,1998;Ritchie and Holland,1999;Fu et al.,2007;Chen and Huang,2009;Hsu et al.,2009,2017;Zhan et al.,2011;Chen and Chou,2014).For instance,Fu et al.(2007)showed that synoptic disturbances are significant precursors to the formation of TCs and the timing of TC genesis depends crucially on the evolution of synoptic disturbances.Zhan et al.(2011)utilized the changes in synoptic disturbance to interpret the impact of ENSO on TC genesis.To explain the decadal change of TC genesis over the WNP,Hsu et al.(2017)suggested that synoptic disturbances can obtain eddy kinetic energy from both mean flow and intraseasonal oscillations,and the development of synoptic disturbances leads to more TC genesis in collaboration with favorable environmental conditions.
Recently,Zhou et al.(2018)analyzed the interannual variation in synoptic disturbances over the WNP and identified two dominant modes:the northeast pattern and southwest pattern.These two patterns are characterized by the anomalously active synoptic disturbances residing over the subtropical WNP and around the Philippines,respectively.They can jointly explain a large portion of interannual variance of disturbances over most of the WNP.In addition,these two dominant modes are related to the large-scale circulation anomalies,in good agreement with previous results in which the occurrence and intensity of synoptic disturbances have been attributed to their embedded basic flows(Lau and Lau,1992;Takayabu and Nitta,1993;Chen,2012).The largescale circulation anomalies and anomalous synoptic disturbance activities associated with the northeast and southwest patterns imply that these two patterns may affect TC tracks and thus landfall.Therefore,we aim to investigate the relationship between the dominant modes of interannual variability in synoptic disturbances over the WNP and TC landfall.
The rest of this paper is organized as follows.The data and methods are described in section 2.The relationship between the two dominant interannual modes and TC activity is presented in section 3.Section 4 investigates the possible mechanism responsible for the relationship.Finally,section 5 summarizes the results.
2.Data and methods
The monthly horizontal winds are obtained from the National Centers for Environmental Prediction–National Center for Atmospheric Research reanalysis dataset,with a horizontal resolution of 2.5°×2.5°.The research period is confined to June–November during 1958–2014,as in Zhou et al.(2018).
The TC data are from the Joint Typhoon Warning Center(https://metoc.ndbc.noaa.gov/ja/web/guest/jtwc/best tracks/western-pacific),with a 6-h temporal resolution.In this study,we only select tropical storms with a maximum surface wind speed greater than 34 kt(~17 m s−1).The TC occurrence and genesis frequency are counted in each 5°×5°latitude–longitude grid.Landfalling TCs in this study refer to those with their tracks crossing the coastline.At the time of landfall,the TCs are required to have at least tropical storm intensity or higher.The strength of synoptic disturbance activity is measured by the 850-hPa eddy kinetic energy(EKE).The Student’st-test is utilized to check the statistical significance.
3. Interannual variability of TC activity in association with synoptic disturbance activity
Zhou et al.(2018)performed empirical orthogonal function(EOF)analysis on the 850-hPa EKE averaged over June–November within the domain(0°–35°N,100°–160°E)during 1958–2014.Accordingly,they identified two dominant modes of interannual variation in synoptic disturbance activities over the WNP.The first mode is called the northeast pattern,which depicts the interannual variation in synoptic disturbance over the subtropical WNP.The second mode is called the southwest pattern,which shows the interannual variation in synoptic disturbance around the Philippines.The regions of red and green contours in Fig.1 show the regions where the first and second modes explain more than half of the total interannual variance of synoptic disturbances,respectively,i.e.,the main regions of the dominant modes.Based on the principal components(PC1 and PC2)of these two modes,which are shown in Zhou et al.(2018,Figs.2c and d),we select eight years with the highest PC values as positive PC years,and the eight years with the lowest PC values as negative PC years.This process yields positive PC1 years(1962,1990,1992,1996,1997,2002,2004,2014),negative PC1 years(1963,1968,1973,1977,1995,1998,2008,2010),positive PC2 years(1964,1967,1971,1974,1985,1990,2009,2011),and negative PC2 years(1963,1966,1968,1972,1982,1997,2002,2004).
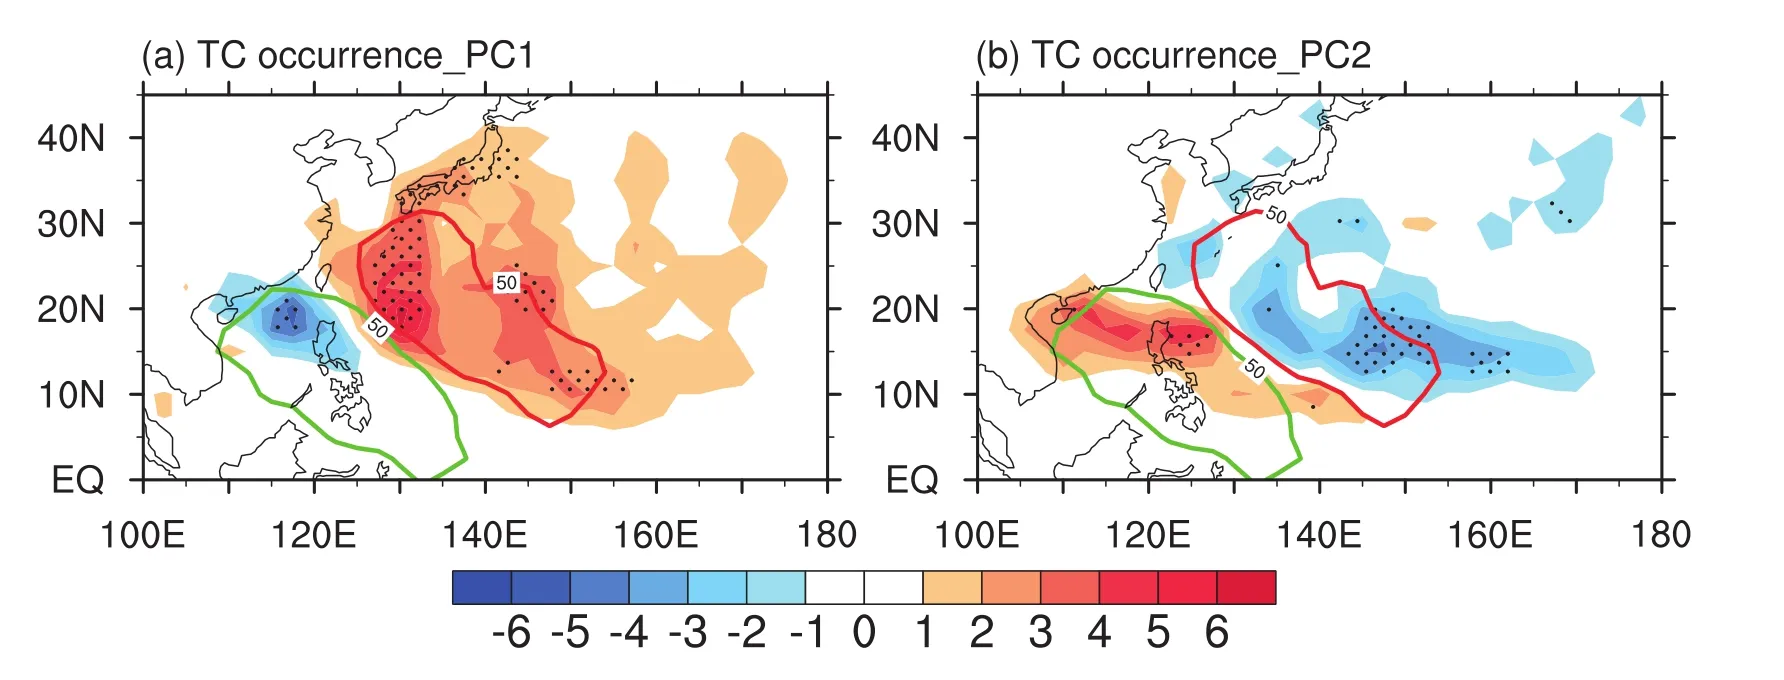
Fig.1.(a)Composite anomalies(color shading)of TC occurrence frequency between the positive and negative PC1 years.(b)As in(a)but for PC2.See text for more details on the PC1 and PC2 years.The red(green)contour represents 50%of the total interannual variability variance of synoptic disturbance explained by PC1(PC2).Dots denote regions significant at the 95%confidence level.
Figure 1 shows the composite differences in TC occurrence frequency between the positive and negative PC years.The TC occurrence differences associated with PC1 and PC2 are both characterized by a dipole pattern between the subtropical WNP and the northern SCS–Philippines corresponding to the regions with high interannual variabilities of synoptic disturbances for PC1 and PC2,respectively(Zhou et al.,2018).For PC1,there is a positive TC occurrence anomaly over the subtropical WNP and a relatively narrow negative anomaly over the northern SCS(Fig.1a).Conversely,the PC2-related TC occurrence anomalies are characterized by a negative anomaly over the WNP and a positive anomaly over the northern SCS–Philippines(Fig.1b).These results suggest that TCs will appear more frequently in the subtropical WNP when both PC1 is positive and PC2 negative,and in the northern SCS–Philippines when both PC1 is negative and PC2 is positive.Therefore,in the following section,we focus on the opposite combination of the northeast and southwest patterns to highlight the anomalies in TC activity.
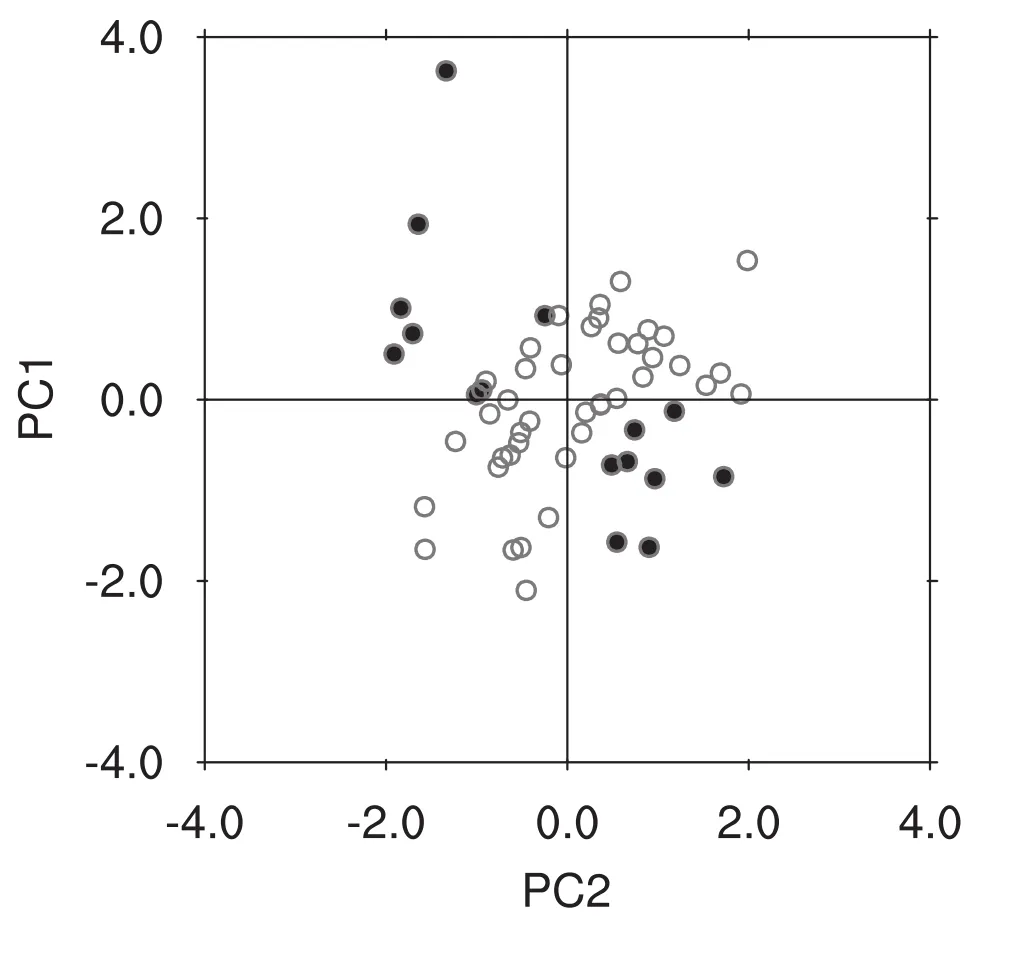
Fig.2.Scatterplot of PC1 and PC2.Solid circles denote the selected samples.
Figure 2 is a scatterplot of PC1 and PC2 from 1958 to 2014.Based on the values of PC12+PC22,or the Euclidean distance from the coordinate origin,eight years with the greatest distances are selected in the second and fourth quadrants,respectively,to represent the opposite combination of the northeast and southwest patterns.Accordingly,the years of positive northeast pattern and negative southwest pattern(hereafter referred to as N+S−years)are 1962,1972,1976,1979,1982,1997,2002 and 2004,and the years of negative northeast pattern and positive southwest pattern(hereafter referred to as N−S+years)are 1964,1970,1978,1983,1988,1995,2008 and 2009,as displayed by the solid circles in Fig.2.We also conducted the same analysis with different sample sizes(e.g.,5 or 10 years)and the results were qualitatively consistent.
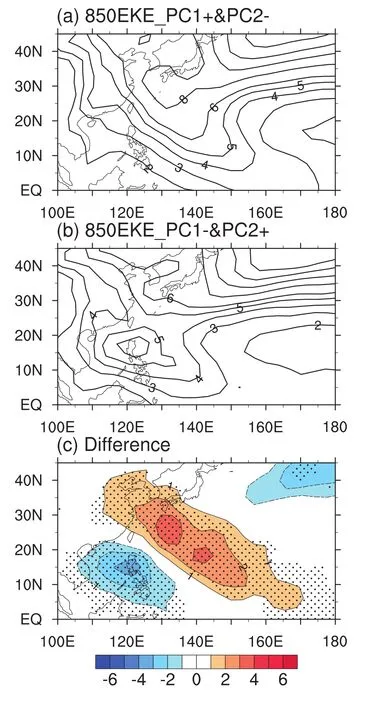
Fig.3.Composite 850-hPa EKE in the(a)N+S−and(b)N−S+years,and(c)the difference(N+S− minus N−S+).Dots in(c)denote regions with significance at the 95%confidence level.Units:m2s−2.
Figures 3a and b show the composite 850-hPa EKE during the N+S− and N−S+years.As expected,in the N+S−years,the synoptic disturbances are active over the WNP corresponding to the region with large interannual variability of synoptic disturbances for PC1[referring to Zhou et al.(2018,Fig.2a)];whereas,in the N−S+years the active region is shifted to the Philippines,coincident with the counterpart for PC2[referring to Zhou et al.(2018,Fig.2b)].Figure 3c displays the difference characterized by a dipole pattern,with a positive anomaly over the WNP and a negative anomaly around the Philippines.The distribution confirms that the synoptic disturbance activities during the N+S− and N−S+years exhibit the opposite variation between the northeast and southwest patterns.
Figures 4a and b show the composite TC occurrence frequency during the N+S−and N−S+years.During the N+S−years,TCs mainly occur over the WNP,with the active region expanding northward to 30°N.Meanwhile,in the N−S+years,TCs mostly appear over the SCS and Philippines,with the active region confined to the south of 30°N but expanded westward to the west of 110°E.Their difference is characterized by a positive anomaly over the WNP and a negative anomaly around the Philippines(Fig.4c).This distribution is similar to that of the synoptic disturbances shown in Fig.3,implying there is a consistent change in TC occurrence and synoptic disturbance activity during the N+S−and N−S+years.Considering that the distribution of TC occurrence frequency is primarily a reflection of TC motion(e.g.,Wu and Wang,2004),the difference in TC occurrence frequency depicted in Fig.4 may suggest TCs take distinct tracks over the WNP between the N+S−and N−S+years.
Figures 5a and b display the TC tracks during the N+S−and N−S+years.During the N+S− years,more TCs tend to recurve northward,thus leading to an increase in TC activity over the WNP.In contrast,in the N−S+years,more TCs take straight-moving tracks,resulting in an increase in TC activity around the Philippines.Furthermore,the variation in TC track may impact the TC landfall location.The increase in the number of recurving TCs during the N+S−years may cause more TCs to make landfall over the northern coastal regions of the WNP,including eastern China,the Korean peninsula and Japan.Meanwhile,the increase in straight-moving TCs during the N−S+years may induce more TCs to strike the southern coastal regions of the WNP,including southern China,Vietnam and the Philippines.It is thus anticipated that TCs making landfall over the northern and southern regions may be different between the N+S− and N−S+years.
If the latitude of 25°N is used to divide the southern and northern regions according to previous studies(e.g.,Kim et al.,2008;Li et al.,2017),Figs.5c and d show the difference in landfalling TC numbers in these two regions during the N+S−and N−S+years.In the southern region, the number of landfalling TCs is 54 in the N+S−years,apparently smaller than the number(98)in the N−S+years,which is a decrease of 45%.By comparison,the number of landfalling TCs in the northern region is 45 in the N+S−years,which is an increase of 47%when compared to that in theN−S+years(24).These results indicate that the number of landfalling TCs in the northern and southern regions differs largely between the N+S− and N−S+years.
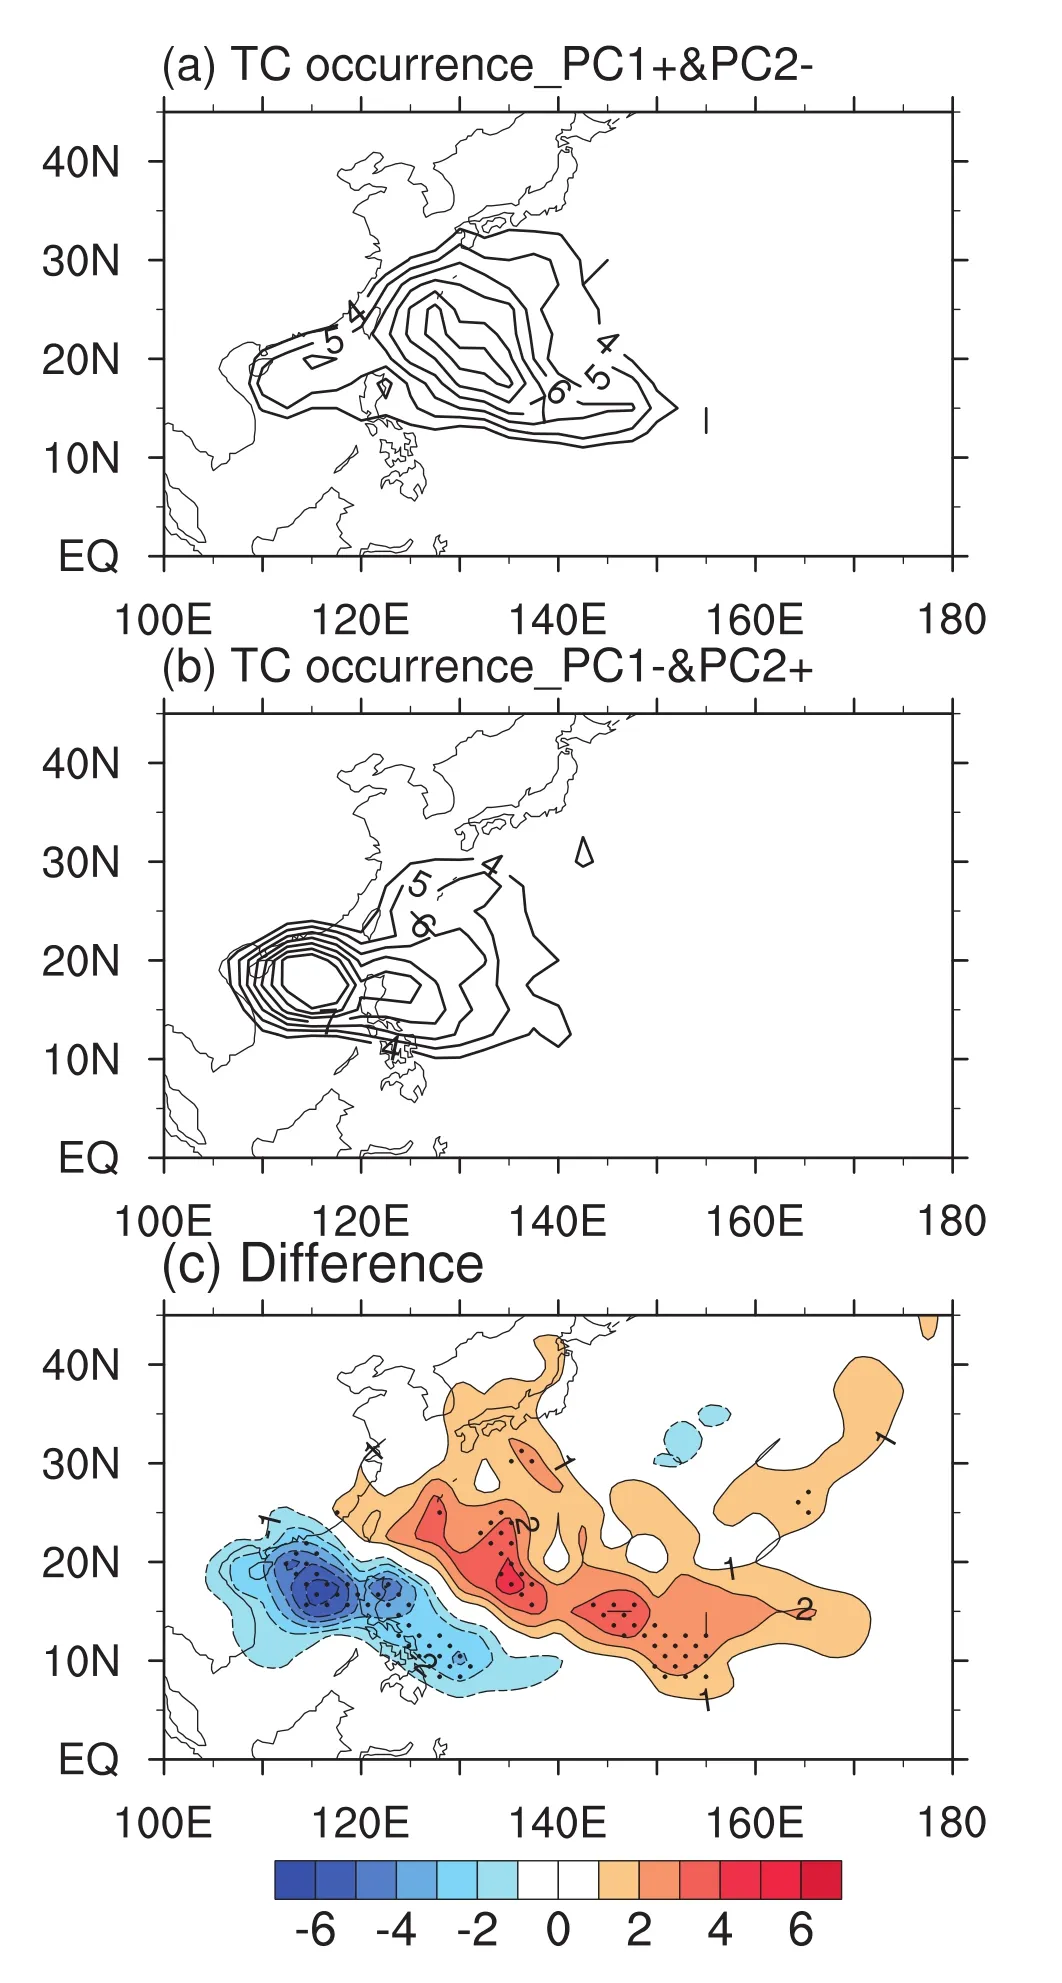
Fig.4.As in Fig.3 but for TC occurrence frequency(number per year).
To examine whether these variations are statistically significant,the prevailing track and landfalling number for each case are compared in Fig.6.For the prevailing track,we use the method of Wu and Wang(2004)and He et al.(2015),who defined the track based on the proportion of TCs over the region of concern to TCs over the source region.We define the source region as the domain(7.5°–25°N,120°E–180°),and the regions of concern as(7.5°–22.5°N,107.5°–120°E)and(25°–45°N,120°–145°E)for straight and recurving tracks,respectively.
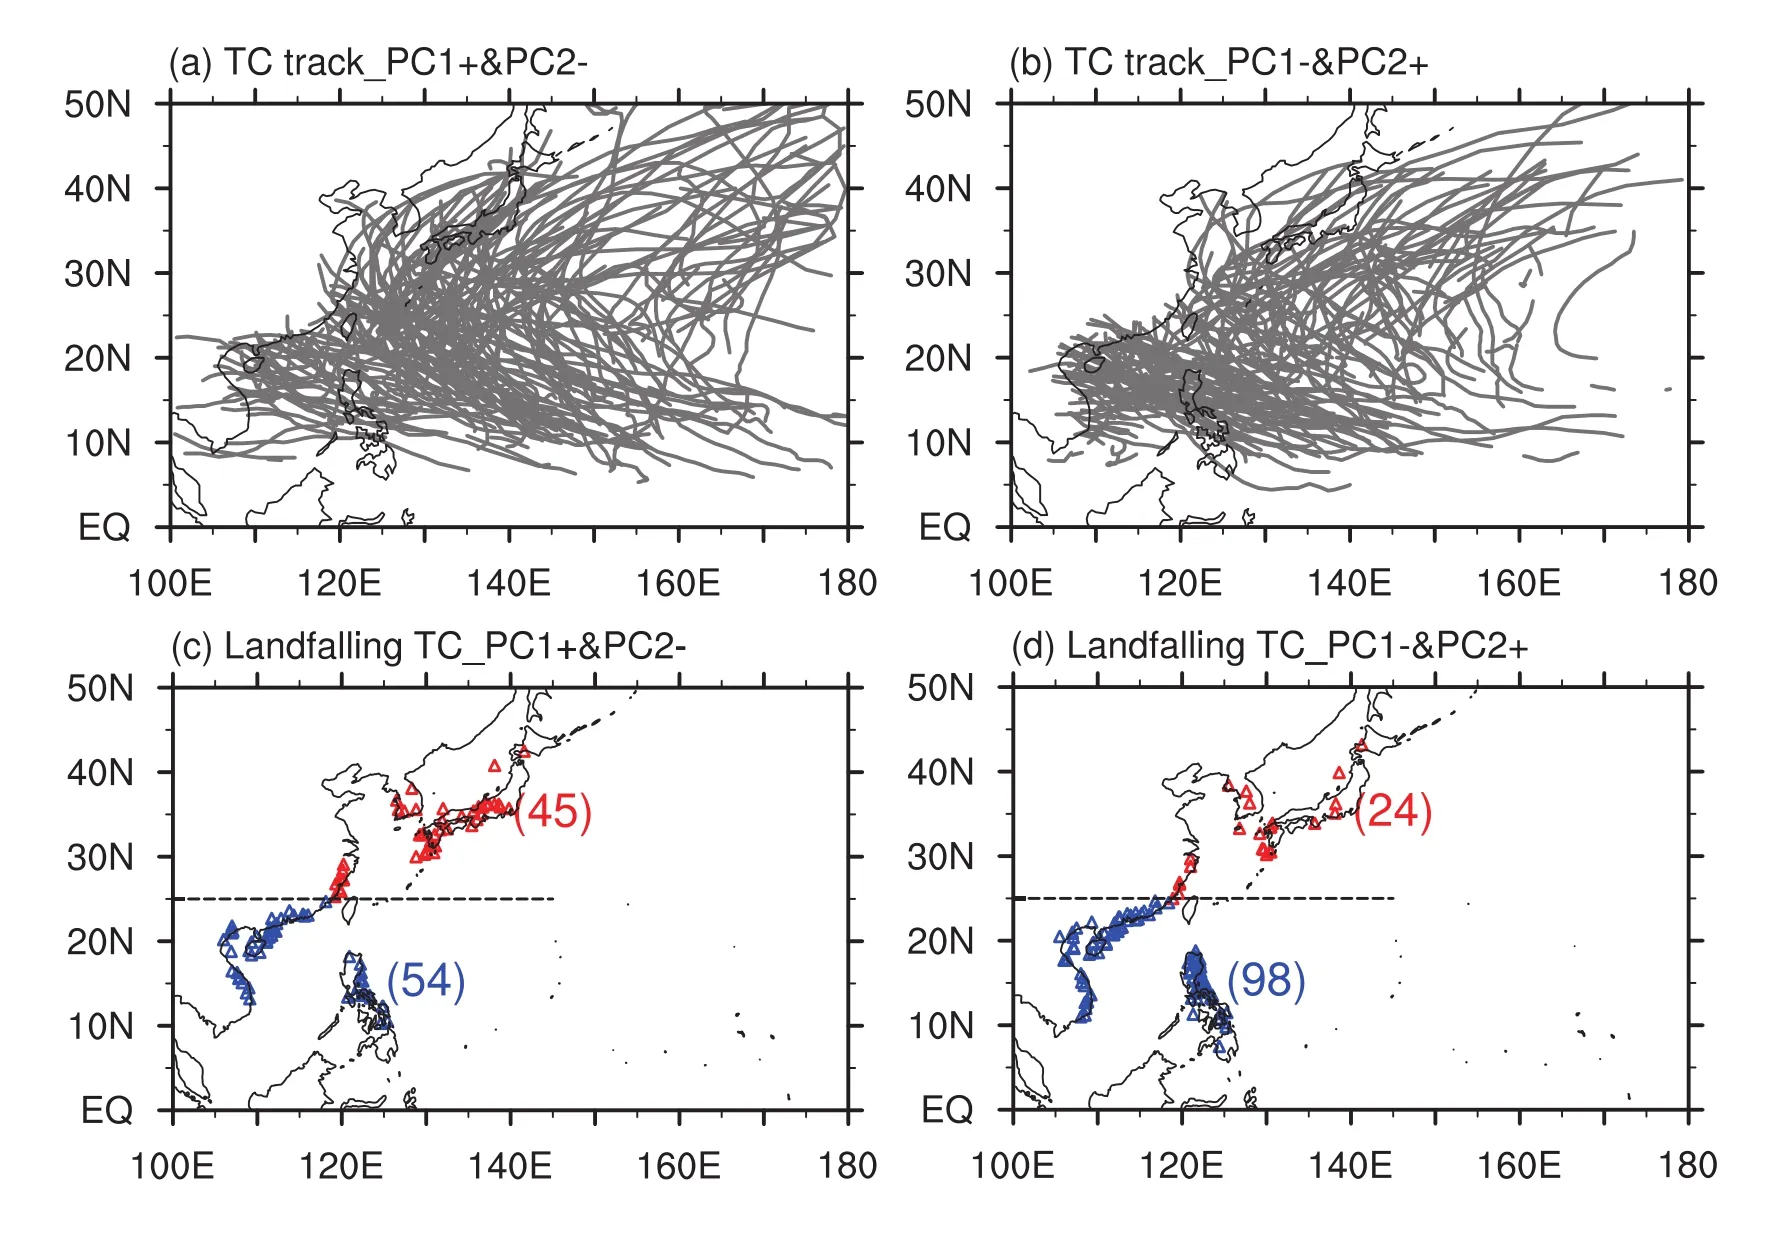
Fig.5.TC(a,b)tracks and(c,d)landfall locations during the(a,c)N+S− and(b,d)N−S+years.Red(blue)triangles denote TC landfall locations in the northern(southern)region.The red(blue)number in parentheses denotes the total landfalling TC number in the northern(southern)region.

Fig.6.Proportion of(a)straight-moving track and(b)recurving track TCs,and the numbers of TCs making landfall over the(c)southern and(d)northern region during the N+S− (red)and N−S+(blue)years.The straight lines denote the mean values.

Fig.7.The(a)composite difference(N+S− minus N−S+)and(b)climatological mean of large-scale steering flow.Shading in(a)denotes regions of either zonal or meridional wind anomalies significant at the 95%confidence level.Units:m s−1.
Figure 6 confirms the significant differences in TC tracks and landfalls between the N+S− and N−S+years,despite the case-to-case variations.For the straight-moving track,the mean proportion is 16.5%in the N+S−years,but this increases to 33.8%in the N−S+years,and their difference(−17.3%)is significant at the 99%confidence level.In contrast,the mean proportion for the recurving track is 59.2%in the N+S− years,but this reduces to 41%in the N−S+years,and their difference(18.2%)is also significant at the 99%confidence level.In good agreement with these differences in TC tracks,landfalls also show distinction between the N+S−and N−S+years(Figs.6c and d).The differences in both the tracks and landfalls between the N+S− and N−S+years are significant at the 95%confidence level.
We also analyzed TC track and landfall variations associated with PC1 and PC2,respectively,and the result(not shown)indicated that these variations are similar to,but weaker than,those associated with the combination of PC1 and PC2.This result confirms that the combination of PC1 and PC2 can highlight the differences in TC tracks and landfalls.
4. Large-scale steering flow and TC genesis location
Figure 7a shows the composite difference of large-scale steering flows between the N+S−and N−S+years.Here,the steering flow is defined as the pressure-weighted mean flow from 850 to 300 hPa(e.g.,Holland,1993,He et al.,2015).It is clear that a westerly anomaly extends from the tropical WNP to the SCS,and a southerly anomaly appears over the subtropical WNP and Japan.Comparison with the climatological steering flows(Fig.7b)suggests that the enhanced southerlies in the subtropical WNP facilitate recurving tracks and landfalls over the northern region, and the weakened easterlies in the tropical WNP are unfavorable for straight tracks and southern landfalls.Therefore,the difference in steering flows can explain well the differences in TC tracks and landfalls between the N+S− and N−S+years shown in the previous section.However,it should be noted that the causality between the difference in time-mean circulation,which determines the steering flows,and interannual variability in synoptic disturbances,remains an open question.
In addition to large-scale steering flow,the TC genesis location can also affect tracks.The Monte Carlo bootstrapping technique(Efron and Tibshirani,1994),with the resampling procedure being repeated 10 000 times,was applied to estimate the probability density function(PDF)of mean TC genesis longitude during the N+S− and N−S+years.Figure 8 shows that the mean genesis longitude in the N+S−years is 140.2°E,whereas in the N−S+years it is 134.4°E,and their PDFs are significantly separated,indicating that the TC genesis location shifts more eastward during the N+S−years in comparison with the N−S+years.
The significant difference in genesis location can be confirmed by Fig.9.First,TCs are more likely to form to the east of 145°E in the N+S− years in comparison with the N−S+years(Fig.9a).Then,we calculated the proportion of TCs forming to the east or west of 145°E to the total TC numbers(Figs.9b and c).Relatively more TCs form to the east of 145°E in the N+S− years,and to the west of this longitude in the N−S+years.The differences between the N+S−and N−S+years shown in Figs.9b and c are significant at the 95%confidence level.The shift in TC genesis location corresponds well to the change in the synoptic disturbance active region as displayed in Fig.3,suggesting that strong synoptic disturbances are favorable for more TC formation.
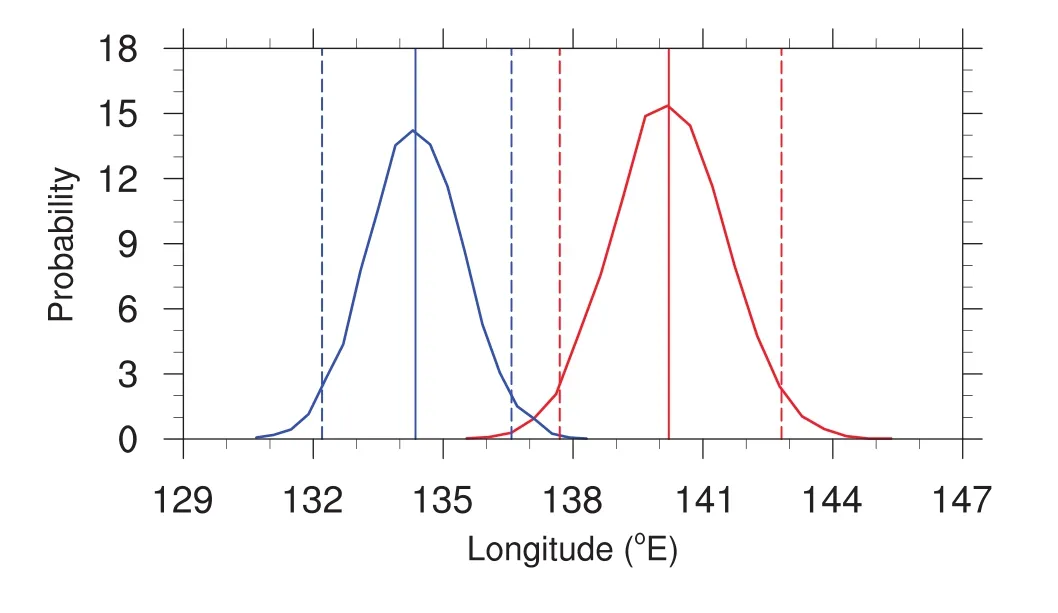
Fig.8.PDF(curve)and mean(vertical solid line)of TC genesis longitude in the N+S− (red)and N−S+(blue)years.Vertical dashed lines indicate the 5%and 95%percentiles.
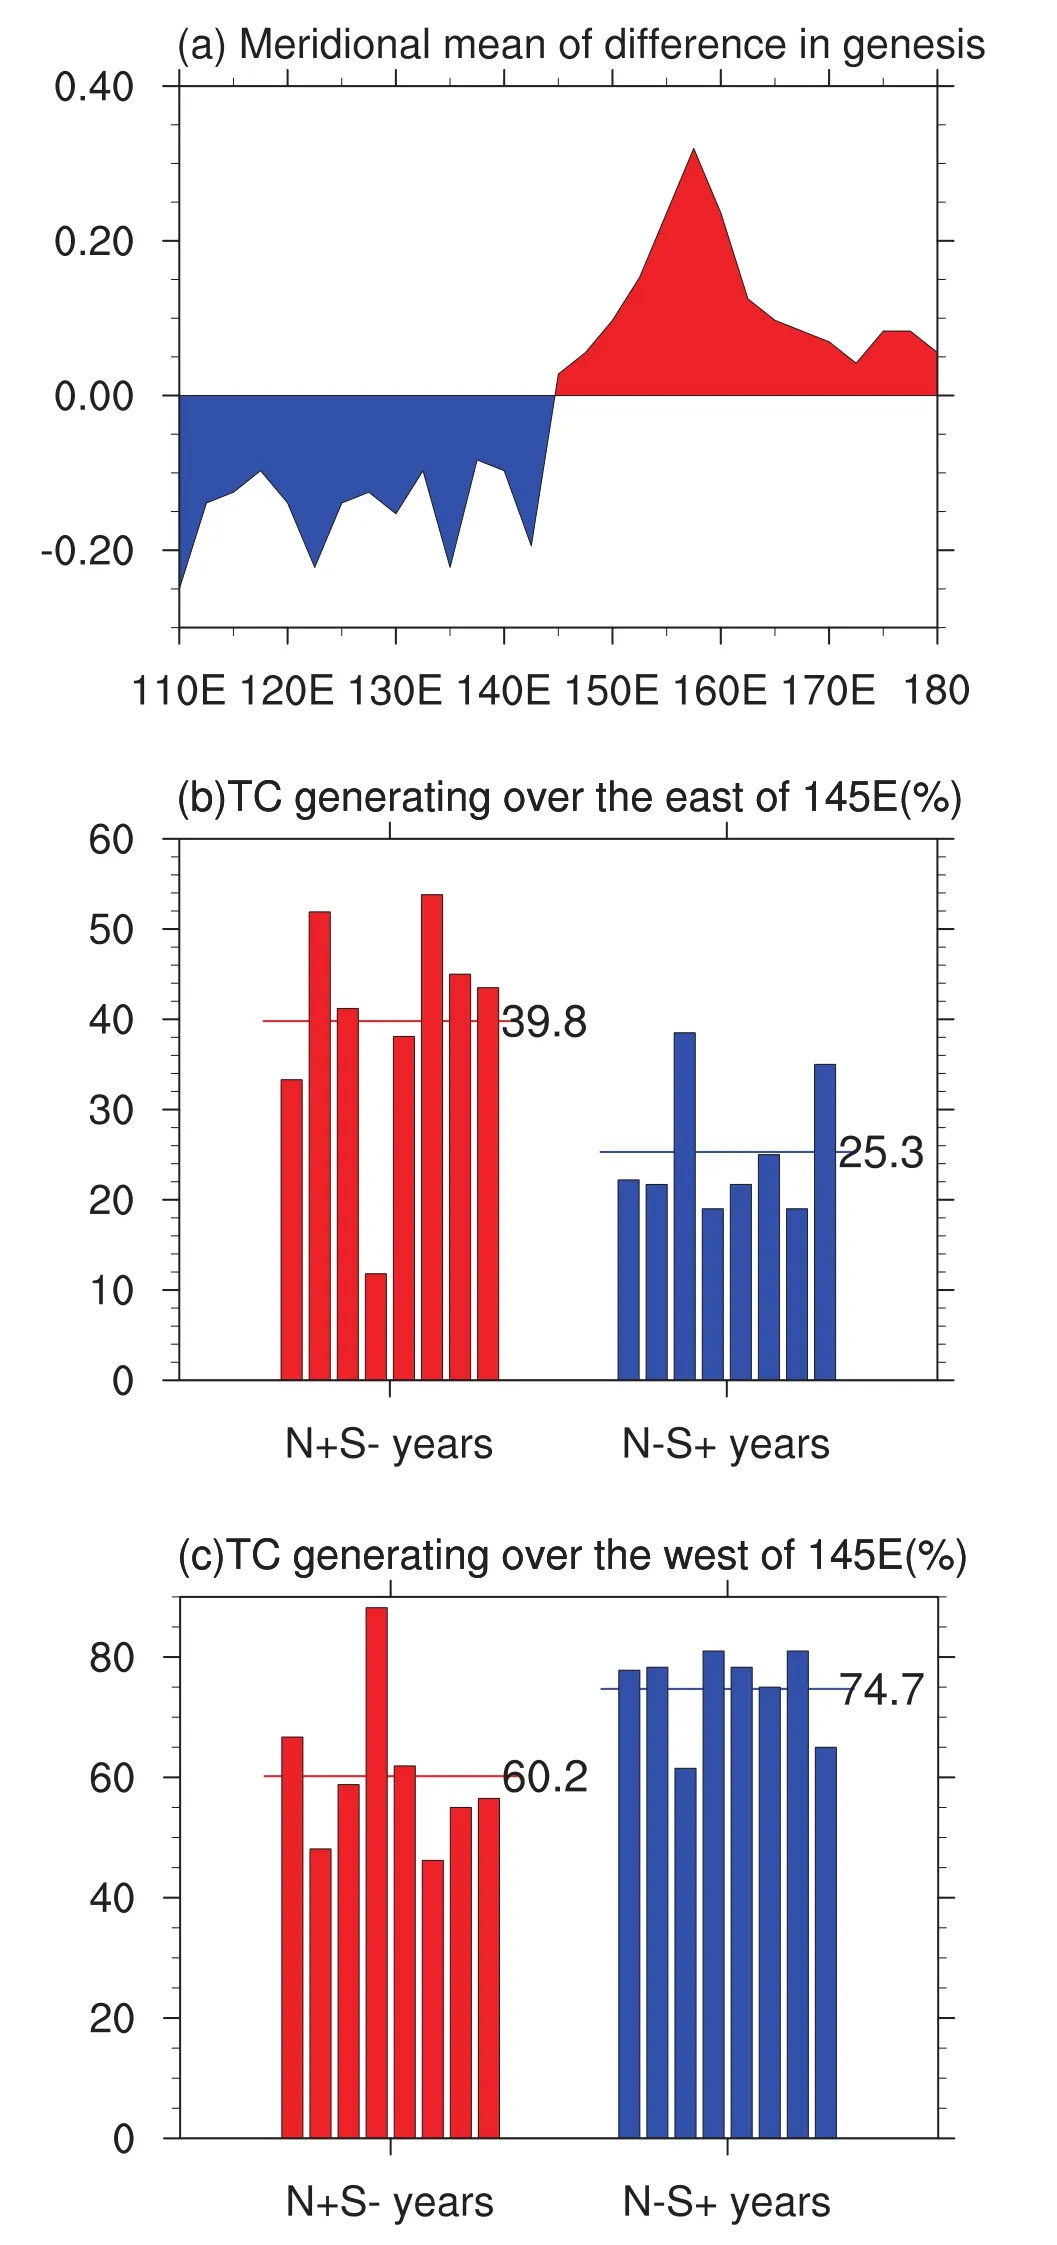
Fig.9.(a)Difference(N+S− minus N−S+)in TC genesis frequency averaged over 5°–25°N.(b,c)As in Fig.6 but for the proportion of the number of TCs forming to the(b)east and(c)west of 145°E.
As mentioned in the introduction,TCs forming farther eastward have a higher probability to recurve.Therefore,the eastward shift in TC genesis location favors recurving tracks and northern landfalls during the N+S−years,and the westward shift in genesis location makes more TCs move in straight tracks and have southern landfalls during the N−S+years.
In addition to the longitudes,the latitudes of TC genesis might also be related to TC tracks and landfalls.Therefore,we compared TC genesis latitudes in the two kinds of years,and found that the TC genesis latitude does not exhibit a remarkable difference between the two kinds of years.Hence,the latitudes of TC genesis may not contribute significantly to the differences in TC track and landfall between the two kinds of years.
5.Conclusions and discussion
In our previous study(Zhou et al.,2018),we found that the interannual variation of synoptic disturbances over the WNP can be represented well by its first two EOF modes,i.e.,the northeast pattern and southwest pattern.These two modes are characterized by the anomalously active synoptic disturbances residing over the subtropical WNP and around the Philippines,respectively.In this study,we further investigated the anomalous TC activity associated with the northeast and southwest modes.The results indicate that both modes are significantly related to a dipole pattern of TC occurrence between the subtropical WNP and the northern SCSP hilippines,and the dipole patterns show opposite signs between the northeast and southwest modes.Therefore,the northeast and southwest modes of synoptic disturbance were combined(i.e.,N+S−and N−S+)to highlight the dipole pattern of TC occurrence.
The composites in these years indicated that TC occurrence is significantly different over the WNP and around the Philippines between the N+S− and N−S+years.During the N+S−years,more TCs occur over the WNP;while in the N−S+years,more TCs appear over the northern SCS and Philippines.Accordingly,more TCs attack eastern China,Korea and Japan during the N+S−years;while more TCs hit the Philippines,Vietnam and southern China in the N−S+years.All these differences between the N+S− and N−S+years are statistically significant.
Further analyses suggested that these discrepancies in the TC prevailing tracks and landfalls can be attributed to the differences in large-scale steering flow and TC genesis location.During the N+S−years,the westerly anomalies over the tropical WNP and SCS lead to more TCs taking a recurving path,and the anomalous southerlies in the subtropical WNP facilitate TCs to make landfall over the northern coastal region of the WNP.In contrast,during the N−S+years,the easterly anomalies promote more TCs to displace westward.In addition,there are more TCs forming eastward and subsequently experiencing recurvature during the N+S−years,as compared with the N−S+years.
Previous studies have suggested synoptic disturbances are related with ENSO,which has been well documented to have a significant impact on TC activity(e.g.,Chan,2000;Wang and Chan,2002;Elsner and Liu,2003;Wu et al.,2004;Hsu et al.,2009;Li et al.,2012;Li et al.,2012;Ha et al.,2013;Zhou et al.,2018).Here,composite analysis revealed that the SST anomalies during the N+S− (N−S+)years are characterized by a developing phase of El Niño(La Niña)(not shown).Thus,we speculate that the westerly anomalies over the tropical WNP shown in Fig.7a and eastward shift of TC genesis location during the N+S−years may have a close linkage with ENSO.However,landfalling TCs related with ENSO mainly occur in the late season(September to November)and are concentrated in Southeast Asia(Elsner and Liu,2003;Wu et al.,2004).Our results reveal that the characteristics of landfalling TCs over Northeast Asia are significantly different between the N+S−and N−S+years.Hence,besides ENSO,some other potential factors may also contribute to the relationship between TCs and synoptic disturbance activities,such as the local SST and extratropical systems.More studies on these potential factors are required.
Acknowledgements.We thank the two anonymous reviewers for their comments,which were helpful for improving the presentation of this paper.This work was supported by the National Natural Science Foundation of China(Grant Nos.41721004,41475074 and 41775063).
杂志排行
Advances in Atmospheric Sciences的其它文章
- A 31-year Global Diurnal Sea Surface Temperature Dataset Created by an Ocean Mixed-Layer Model
- Nocturnal Low-level Winds and Their Impacts on Particulate Matter over the Beijing Area
- Two Types of Flash Drought and Their Connections with Seasonal Drought
- Electronic Supplementary Material to:Two Types of Flash Drought and Their Connections with Seasonal Drought∗
- Estimating the Predictability Limit of Tropical Cyclone Tracks over the Western North Pacific Using Observational Data
- Impact of Mid-and Upper-Level Dry Air on Tropical Cyclone Genesis and Intensification:A Modeling Study of Durian(2001)
