Investigation of Cross-Correlation Characteristics for Multi-Link Channels in High-Speed Railway Scenarios
2018-08-28TaoZhouChengTaoLiuLiuKaiLiuInstituteofBroadbandWirelessMobileCommunicationsBeijingJiaotongUniversityBeijing00044China
Tao Zhou, Cheng Tao, Liu Liu, Kai Liu Institute of Broadband Wireless Mobile Communications, Beijing Jiaotong University, Beijing 00044, China
2 National Mobile Communications Research Laboratory, Southeast University, Nanjing 210096, China
Abstract: This paper investigates the cross-correlation characteristics of large-scale parameters (LSPs) and small-scale fading(SSF) for high-speed railway (HSR) multilink propagation scenarios, based on realistic measurements conducted on Beijing to Tianjin HSR line in China. A long-term evolution-based channel sounding system is utilized in the measurements to obtain the channel data. By applying a proposed time-delay based dynamic partition method, multi-link channel impulse responses are extracted from the raw channel data. Then, the statistical results of LSPs, including shadow fading, K-factor, and root-mean-square delay spread are derived and the cross-correlation coefficients of these LPSs are calculated. Moreover, the SSF spatial correlation and cross-correlation of SSF are analyzed. These results can be used to exploit multi-link channel model and to optimize the next-generation HSR communication system.
Keywords: high-speed railway communications; multi-link channel; cross-correlation;large-scale parameters; small-scale fading.
I. INTRODUCTION
Until 2020, the construction of a modern comprehensive transportation system will be preliminarily completed in China. Serving as an essential part of the modern comprehensive transportation system, high-speed railways(HSRs) are expected to cover more than 80%cities which have more than one million urban residents [1]. To satisfy the ever-increasing demand of higher data rate, higher reliability and security, research in broadband wireless mobile communication systems for HSR has attracted worldwide attention in recent years[2]. Besides, wireless communications and channel models for intelligent transportation systems have been also largely investigated[3-6].
The coverage topology of the long term evolution for railway (LTE-R) network is linear and the distance between two base stations(BSs) is shorter than that in conventional global system for mobile communications for railway (GSM-R) networks, which will lead to a kind of multi-link propagation scenario [7]. As we know, the current single-link channel models cannot describe the propagation characteristics in HSR scenarios where multiple links exist. Additionally, the inter-cell interference,also called “echo effect” [8], can only be simulated through the multi-link channel model.Therefore, accurate multi-link channel models in HSR scenarios are urgently required.
To establish a reliable multi-link channel model, the cross-correlation characteristics of multiple links should be concerned. In most previous works, the cross-correlation property was described through the cross-correlation of large-scale parameters (LSPs) and smallscale fading (SSF). As we know, the existing multiple-input multiple-output (MIMO)channel models can only reflect the simplified cross-correlation properties of multiple links.For instance in [9], the cross-correlation coefficients of multiple links were just fixed to rough values such as 0 and 0.5, while they were assumed to depend on the communication distance in [10]. Authors in [11] presented that existing standardized point-to-point channel models can be extended and applied to cooperative systems by incorporating reasonable correlation models for multiple links.In some cellular communication scenarios, a few work focused on the cross-correlation of LSPs between different links in some cellular scenarios [12, 13]. The cross-correlation models of shadow fading were presented in GSM-R networks in [14] [15]. Authors in [16]have provided the results of cross-correlation of shadow fading, K-factor, and RMS delay spread in a HSR viaduct scenario. However,the cross-correlation property of SSF has not yet been reported. Although the GSM-R measurements have been extensively conducted,there are still many difficulties and restrictions for acquiring the propagation characteristics of HSR channels. In [17], a channel sounding scheme that employs the cell-specific reference signal (CRS) of long term evolution(LTE) as the excitation signal was proposed.Based on the scheme presented in [17], we establish an original system in [18] and analyze the parameters of a single link in [19].This system can be also extended to obtain the multi-link channel characteristics in HSR scenarios.
The cross-correlation properties of LSPs are crucial to the division of cooperative transmission set and cooperative diversity gain.Besides, we note that the cross-correlation properties of LSPs and SSF can be not only referred to model empirical statistical multilink channel models, but also applied to evaluate the feasibility of coordinated multipoint(CoMP) in HSR scenarios for eliminating the inter-cell interference. To the best of our knowledge, researches on the cross-correlation properties are still not sufficient especially for HSR multi-link propagation scenarios. Thus,this paper investigates the cross-correlation characteristics of both LSPs and SSF in HSR multi-link networks.
The remainder of this paper is organized as follows. In Section II, the measurement campaign is introduced. Then the data processing procedure and the original method of departing the multiple links are described in Section III. The results extracted from multiple links are shown in Section IV. Finally, the conclusion is given in Section V.
II. MEASUREMENT CAMPAIGN
2.1 Measurement scenario
Our measurement campaign was conducted on the dedicated LTE railway networks along Beijing to Tianjin HSR line which is in a total length of 18 km. The high-speed test train runs on a viaduct in the plain scenario where around the tracks is sparse vegetation as well as some low buildings. Unlike conventional networks, the architecture of building baseband units (BBU) plus remote radio units (RRU) is deployed in the LTE railway networks. Specifically, BBU control RRUs through opticalfibers and the RRUs transmit the narrow beam signals by back-to-back directional antennas. In the network, the mean distance between two adjacent RRUs is about 1.1 m. The RRU is 20 meters higher than the viaduct and is 30 m away from the track.Thus, the propagation environment between the RRU and the test train is line-of-sight(LOS) environment, as shown in figure 1. The sketch map of the dedicated TD-LTE railway network structure is shown in figure 2.
2.2 Measurement configuration

Fig. 1. Measurement scenario.

Fig. 2. Sketch map of the dedicated TD-LTE railway network structure.
The frequency of the dedicated TD-LTE railway network in our measurement is 1890 MHz and the bandwidth is 18 MHz. The detailed configuration parameters of our measurement can be seen in table 1. A LTE-based measurement system in HSR scenarios is applied in this measurement [18]. The LTE sounder in the deployed system mainly consists of the following parts, two radio frequency (RF) units, a data acquisition card, a data transmission card, a GPS reference clock,a PC, a solid-state disk and a GPS recorder.The LTE eNodeB and LTE sounder all adopt the GPS to achieve the synchronization. Unlike the traditional channel sounders, the LTE sounder has only one receiver and its full parallel architecture receives the excitation signal from all antennas that are employed at the same time. Based on this LTE sounder, we can distinguish the signals of all the different links through delay domain perspective and extract characteristics of multiple links.
Moreover, the relay coverage (RC) scheme,used for providing high quality of service(QoS) to the passengers, is employed in this measurement. Train-mounted antennas and HUBER+SUHNER structure [20] are used for the relay-helped measurement. In the RC scheme, the train-amounted antennas receive signals from RRUs and send them forward to passengers inside the carriage which avoids the penetration loss.
III. DATA PROCESSING
3.1 Channel impulse response extraction
Channel parameters can be calculated based on the extracted channel impulse responses(CIRs) and the procedure of CIR extraction is depicted in figure 3. After low noise amplifying (LNA) and band-passfiltering (BPF), the resulting RF signals are converted to intermediate frequency (IF) signals; The IF signals are sampled by analog to digital converters(ADCs) for satisfying the band-pass sampling;The external frequency reference is provided by a GPS-disciplined rubidium clock; The IF and navigation data are stored together in a solid state disk (SSD) for off-line processing.As for post-processing, baseband data are obtained by digital down converting (DDC)and low-pass filtering (LPF); Cell search is implemented to determine the cell identity and obtain synchronized frames for extracting received CRS and generating local CRS; Frequency-domain correlation is used to estimate channel frequency responses (CFRs) which can be subsequently transformed to the CIRs by inverse fast Fourier transform (IFFT) operation.
3.2 Multi-link partition
The dedicated TD-LTE railway network can be classified into two categories: overlapping area and non-overlapping area. The overlapping area between the adjacent RRUs is also called the multi-link region whereas the non-overlapping area is regarded as the single-link region. In this paper, we attach importance to the cross-correlation properties of the LSPs of the multiple links between RRUs and train in the overlapping area. As for the LTE sounder could receive signals transmitted from neighboring RRUs simultaneously, the partition of multiple links becomes the key part in our investigation. Thus, a dynamic partition method based on time delay domain perspective is used for that we can distinguish the two signals according to different time delay.There are two snapshots of delay window depicted in figure 4 and two obvious power delay profile (PDP) namely PDP (i) and PDP (ii)regarding RRU1 and RRU2 can be seen in the time delay windows. When the train is located in the single link region, PDP (i) occupies the entire multipath delay window. Nevertheless,when the train enters the multi-link region, the PDP (i) and PDP (ii) are both in the multipath delay window thus the entire multipath delay window can be divided into two parts, one part belongs to PDP (i), and the other belongs to PDP (ii). For the banding networks, the train always runs in the region between two RRUs, so we can get enough data to study the cross-correlation of the two links based on this method.
To ensure the independence and integrity of the extracted multiple links, some conditions should be set. Wefirstly define the delay interval of PDP (i) and PDP (ii) as parameter ∆τ.In figure 4, the top one is captured when the train is close to the RRU1, whereas the bottomone is captured when the train moves to the medium position between RRU1 and RRU2.Comparing the two snapshots, we can observe the shortening of ∆τ. Then, a reasonable threshold τthshould be determined so that we extract the multiple links only when ∆τ>τthand stop extracting when ∆τ=τth. The determination of τthshould take the following issues into consideration: i) When ∆τ>τth,the extracted multi-link information should coverage all effective multipath components ii) τthshould not be too small to make the two links aliased iii) The τthwhich is too large may lead the data acquired insufficient so τthshould not be too large either. On account of the above considerations, wefinally choose 1 us (18 taps) as τthin this measurement.

Table I. Measurement configuration
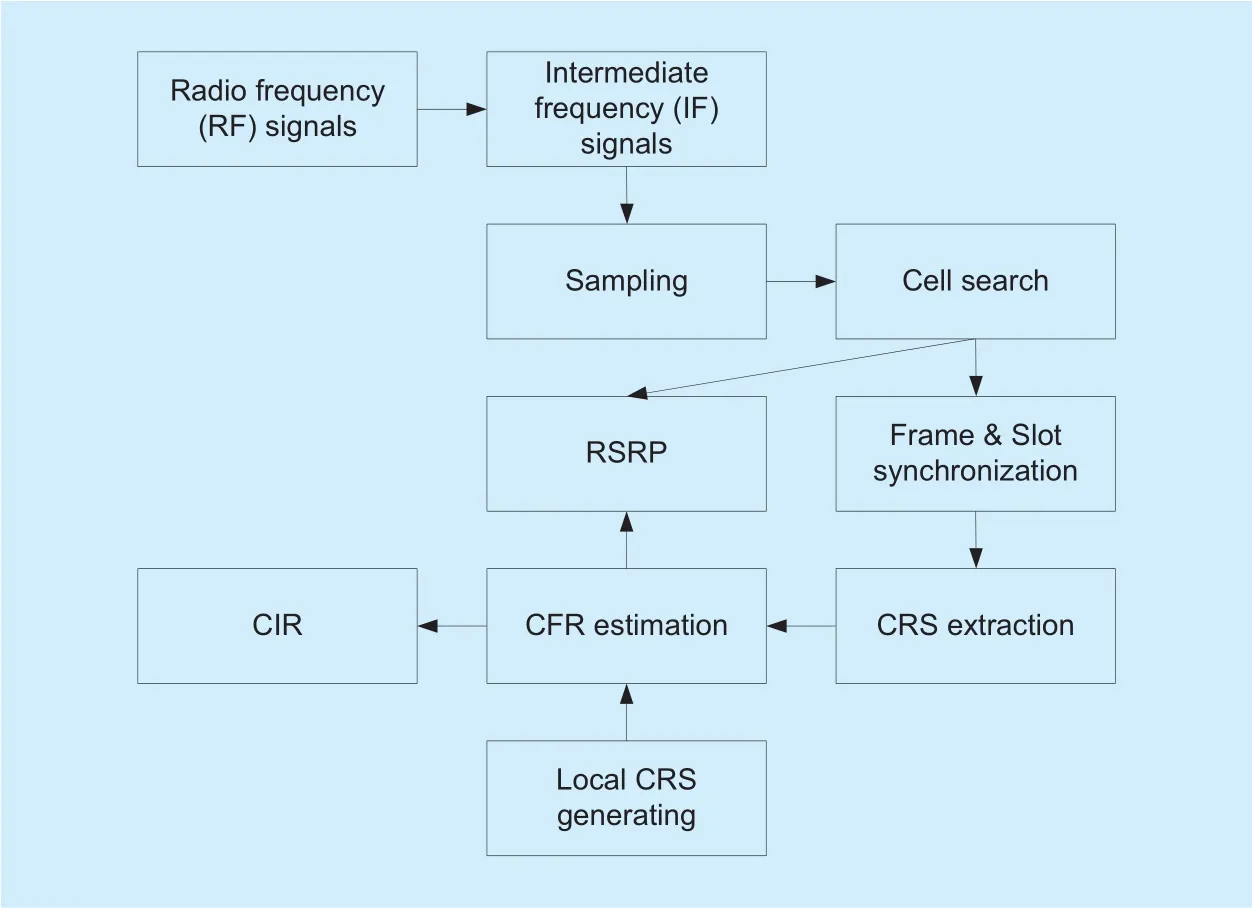
Fig. 3. CIR extraction procedure.
3.3 Channel parameters estimation
The LSPs, as defined in ITU-R M.2135 [21],include shadow fading, K-factor, RMS delay spread, and RMS angular spread, which are used as control parameters when generating the small-scale channel parameters. Due to the limited measurement capability, the LSPs except RMS angular spread are considered here. To estimate the LSPs, a proper window size over which averaging is applied in order to eliminate the effect of SSF should befirstly chosen. According to the recommendation in previous work [19], the average over 20 wavelengths is adopted. Then, the shadow fading,K-factor, RMS delay spread, and SSF are estimated according to the extracted CIRs h( t,τ),where t is the time index and τ is the delay index.

Fig. 4. Two snapshots of the PDP in one multi-link region.
1) Shadow Fading: The shadow fading describes the variation of the received power,which is related to the change in the environment that is experienced at a slow rate. The SF can be estimated as the difference between the path loss (PL) data and a linear regression model as a function of logarithmic distance:
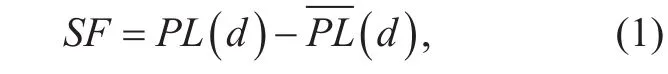
where the PL can be obtained bythe distance between transmitter and receiver in meters, PTxis the transmitted power of CRS, PRx(d ) is the received power at position d, GTxand GRxare transmit and receive antenna gains, respectively, and ARFis the attenuation of RF module; the PL model is expressed asstands for the intercept, and n indicates the PL exponent.
2) K-Factor: The K-factor measures how much local fading the signal undergoes over space, which is defined as the power ratio of LOS components to non-LOS (NLOS) components in the received signal. Based on a classical moment-based method, the narrowband KF is estimated as [22]

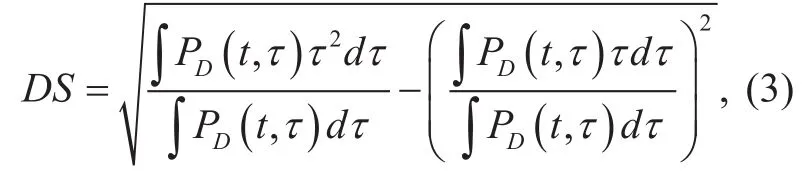
3) RMS delay spread: Multiple echoes of the original signal arrive at the Rx with different power, delays, and angles, leading to dispersion in the time-frequency-space domain.The time dispersion of radio channel is mainly quantified by the RMS delay spread. The RMS delay spread is estimated as the standard deviation of the second central moment of the PDP[23]:
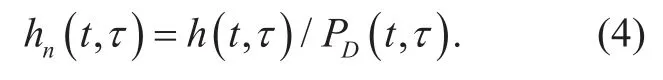
4) Small-scale fading: By removing the large-scale fading effect from the CIRs, the small-scale data with wideband and narrow-band forms can be respectively obtained as follows:
3.4 Cross-correlation coefficient calculation
The cross-correlation coefficient between LSPs and SSF of two links is calculated by
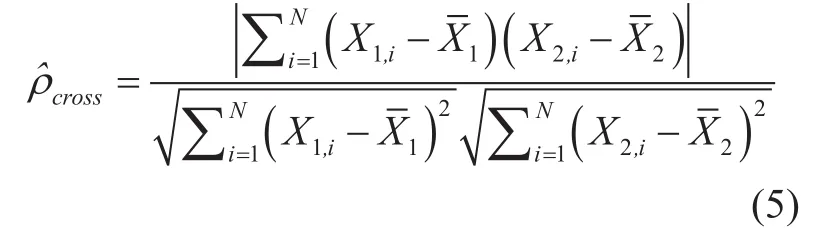
where i=1, 2 is the link index, X indicates the specific LSPs or SSF,denotes the mean value of X, and N represents the number of used samples. The cross-correlation coefficient can be categorized into global cross-correlation coefficient and local cross-correlation coefficient, according to the length of N. The global cross-correlation is calculated by the full route, which may overlook a lot of details on local level that can be of interest for the communication system. Therefore, it is also necessary to consider the local cross-correlation over shorter distances. In this paper, the global cross-correlation coefficient is calculated using N=1000, corresponding to 197 m distance, while the local one is computed employing N=80, corresponding to 15 m distance.
Figure 5 illustrates a dual-link geometric model for HSR networks. Link1 represents the link between the train and RRU1, while Link2 is the link between the train and RRU2. When the HST runs at the center of the multi-link region, the two links are aliasing. The angle between two links is defined as θ. In the following section, we will discuss the impact of θ on the cross-correlation.
IV. RESULTS
4.1 Cross-correlation of large-scale parameters
The results given in this section are statistical average values of two cells about 10 overlapping regions in the plain scenario. The mean of the path loss exponent calculated in this measurement is 2.63 which is not much bigger than the exponent 2.0 in the free-space model. Other extracted characteristics of LSPs in the measured scenario are shown in table 2,which are compared with the ones in the standard channel model ITU-R M.2135 in RMa scenario [21]. The example of cumulative distribution functions (CDFs) of LSPs from two links are presented in figure 6. Firstly, wefind that the channel characteristics obtained from two links are similar and are close to the results of standard channel models. This implies that the multi-link partition method proposed in this paper is correct. Then, we analyze the concrete results of LSPs in detail. We can see that the standard deviation of SF in this paper is smaller than the result in the ITU-R M.2135 model in RMa scenario. However it equals to the standard deviation of SF measured in viaduct scenario at 2.35 GHz [24]. The K-factor of Link2 is slightly higher than that of Link1.The reason may be that the power of some multipath components of Link2 are lower than the noise threshold, thus these components are invalid. As for the results of RMS delay spread, the mean value of RMS delay spread from link1 is 48.82 ns which is lower than that of ITU-R M.2135 model but is higher than 40 ns in WINNER II [9]. The result of the mean value of RMS delay spread from Link2 is 34.51 ns which is even lower than 40 ns.

Fig. 5. A dual-link geometric model for HSR networks.

Fig. 6. Example of CDF of LSPs in one multi-link region.
The cross-correlation coefficients of shadow fading, K-factor and RMS delay spread are summarized in table 3. Referring to the conclusion in [13], the obvious relationship between θ and cross-correlation coefficients only exists when θ is small (no more than 60°). However, for the dedicated TD-LTE railway networks where θ is more than 160°, the cross-correlation coefficients are conjectured tofluctuate around afixed value as shown in the table 3. All the coefficients of LSPs are lower than 0.3, which are commonly regarded as the low correlation. The results confirm the feasibility of the deployment of CoMP in HSR scenario. Based on the obtained LSP statistics and cross-correlation coefficients of LSPs, it is possible to jointly simulate the LSPs in HSR multi-link propagation scenarios. The brief process is suggested as follows: Generating standard normal random variables; Imposing the obtained cross-correlation coefficients of LSPs into these random variables; Mapping the random variables into LPSs of the multilink channel in accordance with the corresponding distribution.
4.2 Cross-correlation of small-scale fading
Before investigating the cross-correlation of SSF for the HSR multi-link MIMO channel,the single-link spatial correlation coefficients of the two links in the overlapping area are concentrated, as shown in figure 7. It is found that due to the LOS dominance and lower scattering density, the spatial correlation is rather high in the measured HSR scenario. It is also seen that the spatial cross-correlation of Link1 is higher than that of Link2. This is because the power of LOS path of Link1 is larger. The spatial correlation is also associated with the delay spread. The larger RMS delay spread in the Link2 causes the higher spatial correlation.
The cross-correlation results of SSF are obtained and listed in table 3. It is observed that the global and local cross-correlation coefficients of SSF are 0.2448 and 0.4125,which have the similar values with the LSPs.The SSF cross-correlation determines the micro-diversity gain of CoMP and can be used to evaluate system performance, e. g., correlation matrix collinearity and sum rate capacity.
V. CONCLUSION
In this paper, the cross-correlation characteristics of the LSPs and SSF of the HSR multilink channel are estimated based onfield measurement data. In the multi-link region of the LTE railway networks, two links are measured simultaneously and extracted from the delay perspective. The statistical characteristics of LSPs including shadow fading, K-factor and RMS delay spread and SSF in the HSR multilink environment are presented. The global and local cross-correlation coefficients of LSPs and SSF are obtained, which show a relatively low value. The experimental results can be applied to exploit multi-link channel model, make simulations and optimize the deployment of future LTE railway networks along HSRs.

Table III. Cross-correlation coefficients of LSPs and SSF

Fig. 7. Example of CDF of LSPs in one multi-link region.
ACKNOWLEDGEMENT
This work was supported by the Beijing Municipal Natural Science Foundation under Grant 4174102, the National Natural Science Foundation of China under Grant 61701017,the Open Research Fund through the National Mobile Communications Research Laboratory, Southeast University, under Grant 2018D11, and the Fundamental Research Funds for the Central Universities under Grant 2018JBM003.
杂志排行
China Communications的其它文章
- A Stackelberg Differential Game Based Bandwidth Allocation in Satellite Communication Network
- Joint Resource Allocation Using Evolutionary Algorithms in Heterogeneous Mobile Cloud Computing Networks
- A Master-Slave Blockchain Paradigm and Application in Digital Rights Management
- The Coevolutionary Relationship of Technology,Market and Government Regulation in Telecommunications
- Mobile Jammer-Aided Secure UAV Communications via Trajectory Design and Power Control
- A Quantitative Security Metric Model for Security Controls: Secure Virtual Machine Migration Protocol as Target of Assessment