Impact of the Kuroshio Extension Oceanic Front on Autumn and Winter Surface Air Temperatures over North America
2018-08-24YUANLiandXIAOZiniu
YUAN Li, and XIAO Ziniu
Impact of the Kuroshio Extension Oceanic Front on Autumn and Winter Surface Air Temperatures over North America
YUAN Li1), 3), and XIAO Ziniu2), *
1) Chinese Academy of Meteorological Sciences, Beijing 100081, China 2) State Key Laboratory of Numerical Modeling for Atmospheric Science and Geophysical Fluid Dynamics, Institute of Atmospheric Physics, Chinese Academy of Sciences, Beijing 100029, China 3) Chifeng Meteorelogical Service of Inner Mongolia, Inner Mongolia, Chifeng 024000, China
Mid-latitude air-sea interaction is an important topic that attracts a considerable amount of research interest. The Kuroshio Extension (KE) is one of the main western boundary currents and plays a critical role in the mid-latitude atmospheric circulation. This paper uses the NCEP/NCAR reanalysis and Hadley sea surface temperature datasets to investigate the influence of oceanic fronts in the KE region on surface air temperature in North America over the period 1949–2014. A significant correlation was found between the KE front intensity and the temperatures over North America in autumn and winter. A strong (weak) KE front anomaly in autumn is associated with an increasing (decreasing) surface temperature over western North America but a decreasing (increasing) surface temperature over eastern North America. In winter, central North America warms (cools) when the KE front is strong (weak). The response of the atmospheric circulation, including wind in the high and low troposphere, troughs, and ridges, to the strengthening (weakening) of the KE front is the main cause of these changes in surface temperature.
Kuroshio extension; surface air temperature; North America
1 Introduction
WithinthePacificOcean,thesubtropicalwesternbound- arycurrents(WBCs)aretheKuroshioCurrentintheNorth- ern Hemisphere, which is associated with a gyre that transports warm water polewards, and this water then interacts with the cooler atmosphere through strong air-sea heat fluxes (Kelly, 2010; Kwon, 2010). The Kuroshio brings warm, saline water from the south and the Oyashio carries cold, fresh water from the north. The confluence of these two ocean currents results in a transition zone that is characterized by a sharp sea-surface temperature (SST) gradient at mid-latitude, similar to an atmospheric front (Qu, 2001). The strong SST front is located on the northern edge of the Kuroshio Extension (KE), and called Kuroshio Extension Front (KEF) (Xie, 2002; Xu, 2011). Previous studies have proposed that the differential oceanic heat supply across the oceanic fronts can force an atmospheric response. For example, air-sea interactions over such fronts and eddies have been shown to generate a positive correlation between near-surface wind speed and SST (Liu, 2000; Chelton, 2001; Hashizume, 2001; Hu, 2015; Wang and Liu, 2015). The differential heating on of the two sides of an oceanic front enhances baroclinicity in narrow regions of the lower troposphere and effectively influences the position of storm tracks above (Nakamura, 2004), and the heat transport is released into the atmosphere mostly during the cold seasons (September to March) (Kelly and Dong, 2004). Nonaka and Xie (2003) suggested that the mid-latitude atmosphere would respond to fine-scale SST variations associated with oceanic fronts and eddies. Furthermore, Small. (2008) examined the interaction between the sharp SST gradient and the overlying atmosphere using high-resolution satellite data, and found that the air temperature and hydrostatic pressure gradient are located downstream of the SST gradient. Using a regional atmospheric model, Taguchi. (2009) demonstrated that the location and structure of storm tracks are significantly influenced by the presence of regions of enhanced SST gradient in the mid-latitudes.
As mentioned above, the KEF has the potential to induce an atmospheric circulation anomaly over the North Pacific through the differential heat transport, resulting in atmospheric instability and increased vertical momentum exchange influencing storm tracks. That makes it possible for KE to affect climate, and some studies reveal the response of Kuroshio and its extension in East Asia (Murazaki, 2015). The onset and strength of South China Sea Summer Monsoon associate with Kuroshio, and lead to drought (flood) in northern and southern China (Sasaki, 2012; Feng and Hu, 2014).
Pacific-North America describes the relationship between the geopotential height of North Pacfic and Eastern North America during winter-half-year, which could raise the question whether the response of KEF in North Pacific influences North America climate (Feldstein, 2002; Deser, 2016). It could be supposed that the variability in the strength of the KEF would affect the climate over North America, which lies downstream from the KEF, but fewer studies have mentioned it.
During the cold seasons, the Aleutian Low reaches its most intense point and the Subtropical High is displaced southwards in the low troposphere. In the middle troposphere, the East Asian trough and Alaska ridge gradually strengthen. This atmospheric configuration favors the propagation of perturbed systems across a large latitudinal domain, which directly affects the northwestern American climate (Favre and Gershunov, 2006). It is reasonable to suspect that the impact of the KEF on the atmospheric circulation would spread easily to the downstream area during the cold seasons. To confirm this hypothesis, this study investigates the relationship between the variability of the KEF and the surface air temperature (SAT) over North America during the cold seasons, and suggests a possible internal process that drives this relationship. As the KEF is most intense in winter and weakest in summer (, it shows a well-defined seasonal cycle; Chen, 2008), we studied the influence of KEF strength on the temperatures over North America in autumn (initial development period) and winter (strong development period) separately.
2 Datasets and Methods
We used the Hadley Center monthly SST datasets (1˚×1˚, 1948–2014) and the NOAA (National Oceanic and Atmospheric Administration) high-resolution blended analysis (Optimum Interpolation Sea Surface Temperature Version 2, OISST V2) of daily SST (0.25˚×0.25˚, 1981–2014) to characterize the variability of the KEF and compare the influence of the low- and high-resolution datasets. The OISST daily data is an analysis constructed by combining observations from different platforms on a regular global grid, including those from satellites, ships and buoys, and it has relatively long time series and high resolution.
The meridianal gradients of the KE were calculated using the following formula, where g is the gradient and ∆is the distance between two latitudinal points:

For the temperatures over North America, we used the NOAA CPC (Climate Prediction Center) monthly gridded 2m land temperature datasets, which have a spatial resolution of 0.5˚×0.5˚ and cover the period 1949 to 2014. The 2m air temperature datasets are using a combination of two large individual data sets of station observations from GHCN (Global Historical Climatology Network version 2) and CAMS (Climate Anomaly Monitoring System). So they can be updated in near real time, and has used some unique interpolation methods. The other climatic impact of the KEF was analyzed using the NCEP-NCAR monthly geopotential height and wind. Niño 3.4 index is provided by the NOAA CPC from 1948 to the present.
Correlation, empirical orthogonal function (EOF), high-pass filter, and composite statistical analysis techniques were used in this study. The linear trend was removed from all of the monthly data prior to further statistical analysis.
3 Results
3.1 Kuroshio Extension Front Index
The distribution of SST gradient in the KE region in autumn (September, October, and November) and winter (December, January, and February), using the Hadley (Figs.1a and 1b) and NOAA (Figs.1c and 1d) SST datasets is shown in Fig.1. In Figs.1b and 1d, it is evident that the highest value of the SST gradient is located in the region east of Japan and extends zonally into the central Pacific during winter, and has a center with a maximum SST gradient beyond 35˚–45˚N, 140˚–180˚E. The SST gradient in autumn is similar to that in winter, but its intensity is much weaker. The NOAA high-resolution data shows the detail of the KEF distribution, but the Hadley data only reveals the center and approximate range of the KEF. To quantify the strength of the KEF, the regional average of the meridional SST gradient in the area outlined by the dashed rectangle in Fig.1 is defined as an intensity index for the KEF.
The correlation between the index calculated using the Hadley SST data (long time series but low resolution) and the index calculated using the NOAA SST data (high resolution but short time series) was 0.93 and 0.85 in autumn and winter, respectively (Figs.2a and 2b), indicating that the resolution has almost no effect on the index. To increase the statistical confidence in our subsequent analysis of the atmospheric state, we used the SST gradient index calculated by Hadley SST as the KEF index, as it has the longer time series.
Nakamura and Kazmin (2003) also used the SST to define the frontal intensity in Kuroshio Extension and north- ern fronts, which is measured as a cross-frontal SST contrast within 5˚ latitudinal band centered at the instantaneous frontal axis at each meridian and then the same zonal averaging as above was applied. The frontal axis is marked by the gradient maximum at each meridian. And the frontal area in Kuroshio Extension is (36˚–46˚N, 150˚E–175˚W). To prove the consistency of our index, we compare it with the previous index defined by Nakamura and Kazmin as shown in Figs.2c and 2d. Both of correlation coefficients in winter and autumn are significant at the 99% confidence level. Qiu (2002) defined the Kuroshio Extension jet intensity index by sea surface height, but his index emphasizes the ocean internal dynamic process instead of thermal process we cared about.
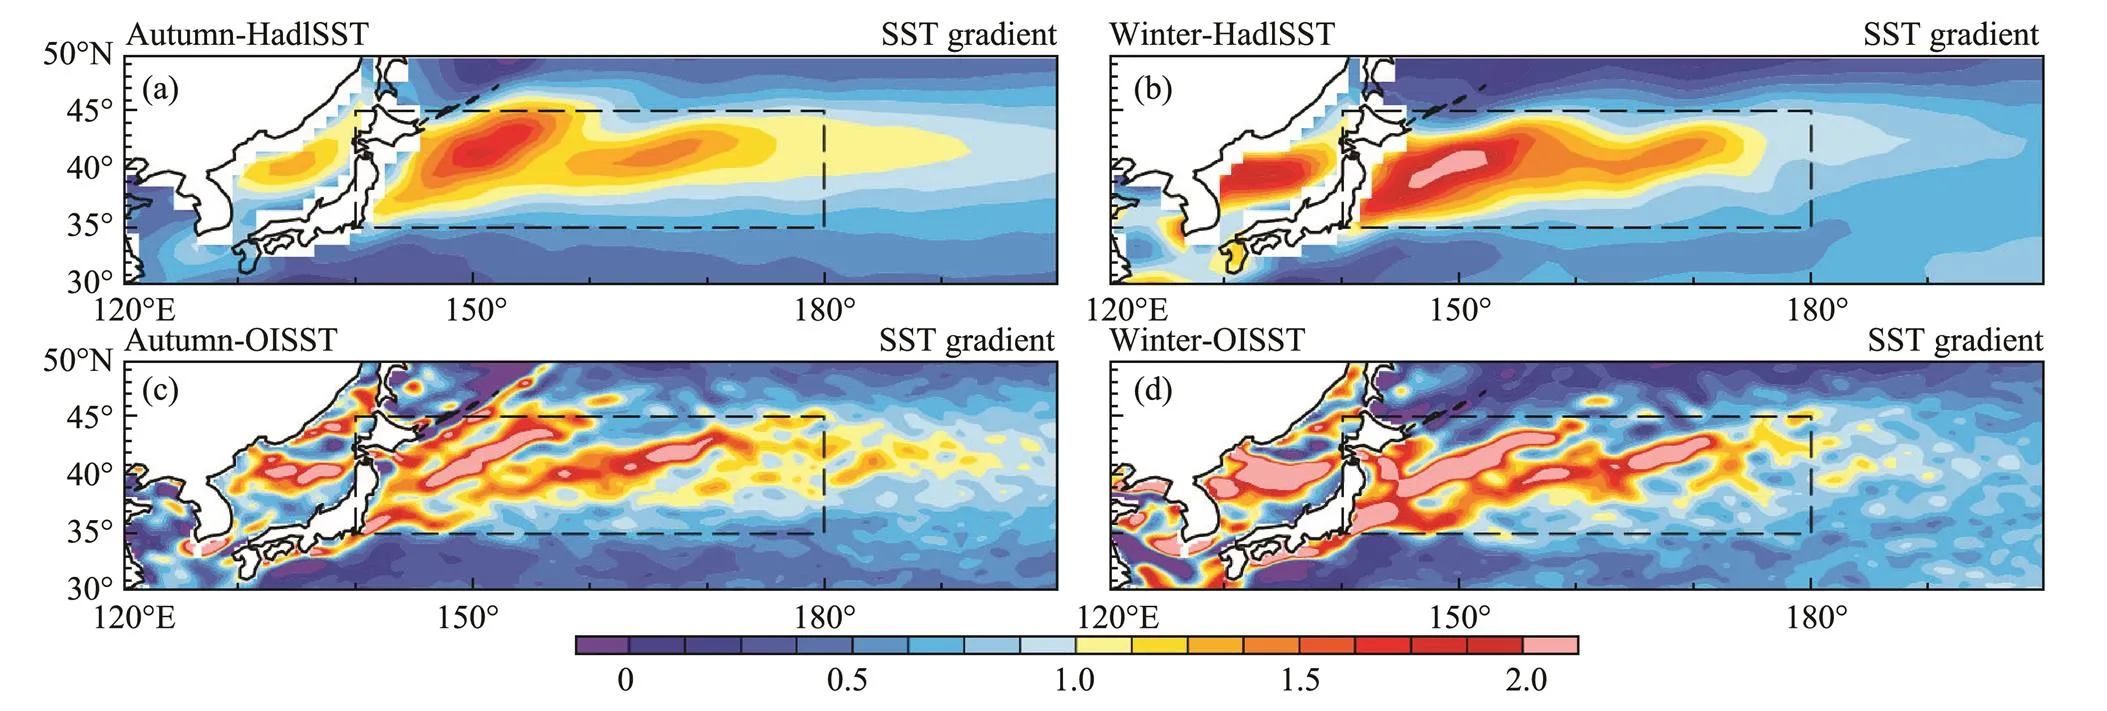
Fig.1 Average distribution of SST gradient (℃(100km)−1) in (a) autumn and (b) winter. The dashed box (35˚–45˚N, 140˚–180˚E) indicates the area used for calculations.

Fig.2 KEF indexes calculated using the Hadley data (black solid line) and NOAA data (red dashed line) for (a) autumn and (b) winter. The KEF indexes newly defined (black solid line) and Nakamura defined in 2003 (blue dashed line) for (c) autumn and (d) winter.
3.2 Relationship Between the KEFI and North American SAT
From the time series of the KEF index (KEFI), we selected the years with an absolute value of KEFI beyond ±0.7 standard deviation from the mean in autumn and winter as typical anomalous positive/negative KEFI years (Table 1). In this section we explore the impact of the KEF on the North American climate. The SAT is sensitive to circulation upstream, so the temperatures in North America might be influenced by the KE. To understand the distribution and variation of SAT in the North America, we used EOF analysis to decompose anomalous temperatures into their spatial and temporal variations (Fig.3). The first spatial patterns of autumn and winter are both centrally enhanced, with their cores being within the region bounded by (40˚–60˚N, 120˚–80˚W), and both of the explained variance exceed 30%. In addition, both the autumn and winter EOF2s have an east-west direction with explained variance above 20%. Thus, the first two spatial patterns can explain the main variability of SAT over North America in autumn and winter.
The SAT of North America is related to the KE, and this is confirmed by the correlation coefficients between KEFI and the time series of each EOF mode in autumn and winter (Table 2). Furthermore, the correlation coefficient between KEFI and EOF1 in winter is 0.242 (significant at the 95% confidence level), and that between KEFI and EOF2 in autumn is −0.344 (significant at the 99% level).
To investigate the interaction of SAT over North America with KEF, lead correlation maps are computed (Fig.4). The correlation maps show areas where KEFI increases significantly with the increasing temperatures in autumn (Figs.4a–4c) and winter (Figs.4d–4e), such as in western North America for autumn and northern North America for winter. The pattern of positive and negative correlation coefficients is similar to the EOF2 mode in autumn; however, the winter pattern resembles the EOF1 mode. In addition to the significant simultaneous correlation, the late-summer KEF could affect autumn SAT as well and be enhanced gradually. The case of winter is the same as autumn and it is also significant when the KEF leads SAT two months. Thus, we can speculate that a close relationship exists between the strength of the KEF and SAT in North America during autumn and winter. We infer that the KEFI would influence SAT intensity changes in winter, whereas the variation of KEFI in autumn has an obvious effect on the pattern of the east–west dipole.

Table 1 Typical anomalous positive-/negative-KEFI years for autumn and winter used to produce the seasonal composites
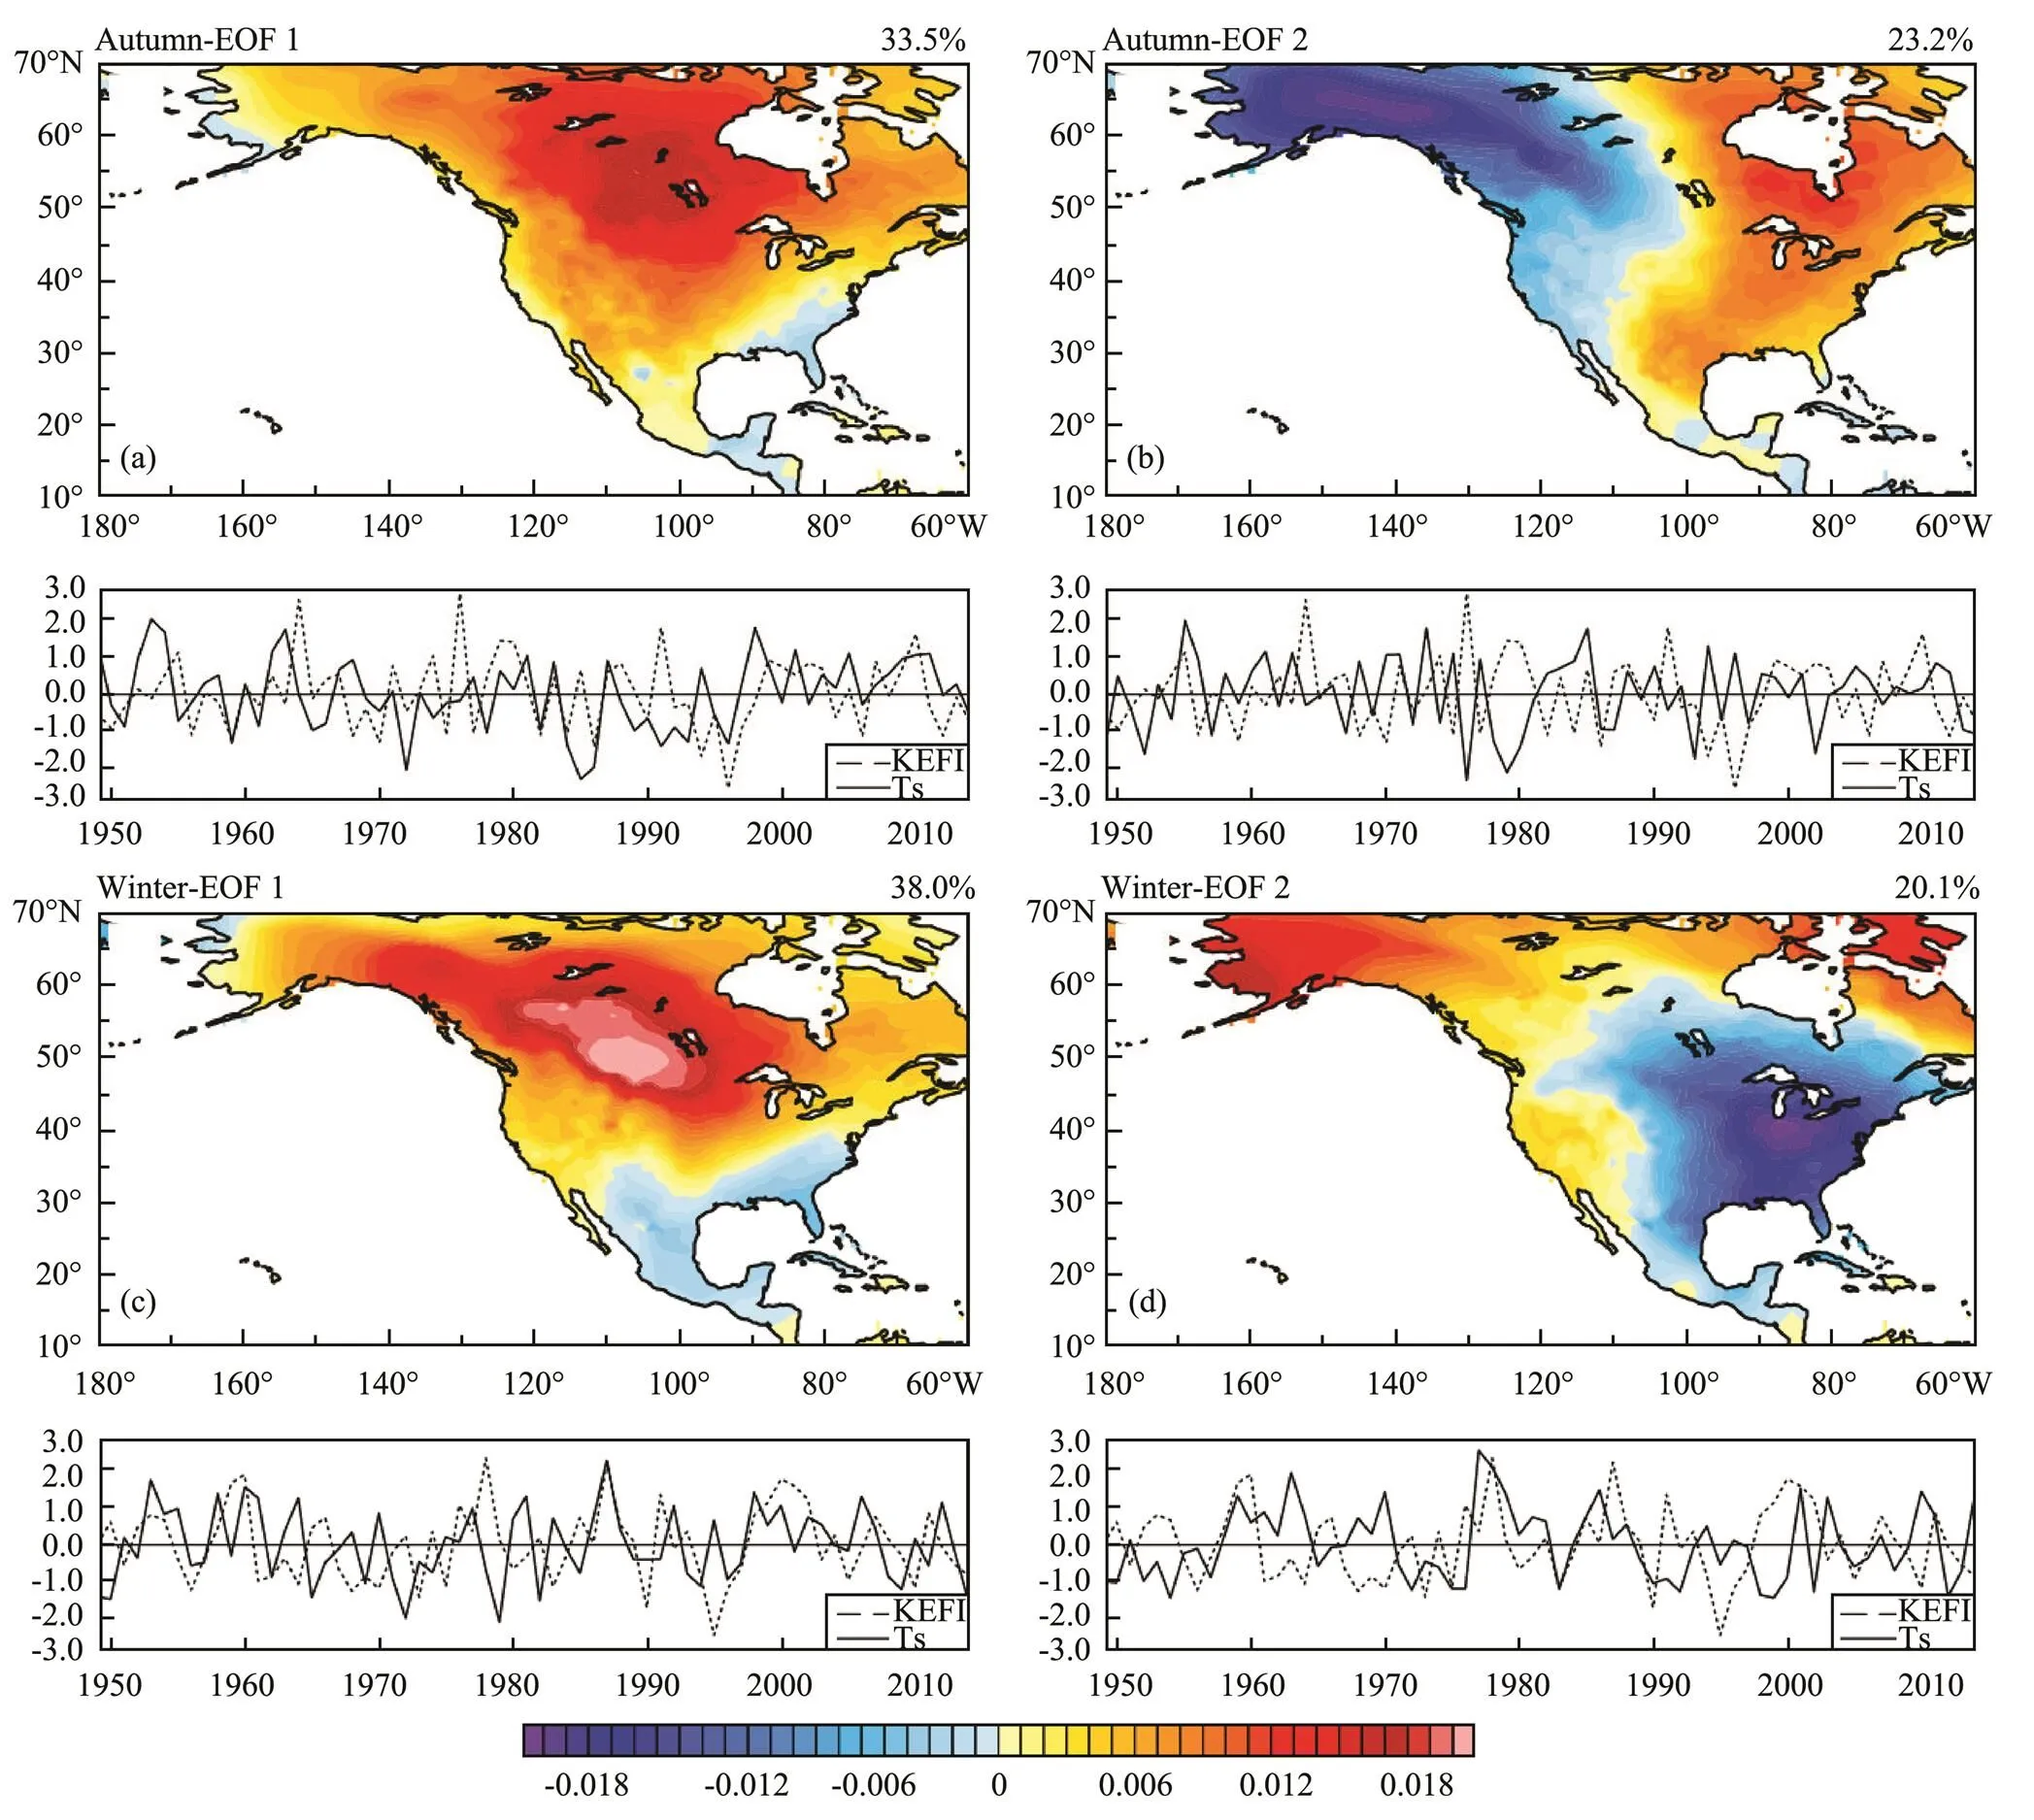
Fig.3 The first two EOF spatial and temporal patterns of SAT during autumn (a and b) and winter (c and d) in North America. In the lower graphs, the dotted lines indicate KEFI and solid lines indicate temporal index of EOF patterns.
In addition, El Niño-Southern Oscillation (ENSO) may have contributed to the warming/cooling of North America in cold seasons through the warm/cool pool in central and eastern Pacific (Renwick and Wallace, 1996). We also calculated the correlation between the KEF and SST in the equatorial Pacific to examine whether the ENSO impacts upon the relationship between the KEF and SAT, and our results showed no significant correlation (not shown). In addition, the correlations between KEFI and the Niño 3.4 index are 0.085 and 0.043 in autumn and winter, respectively, over the same period, but neither of them pass the 90% significance level. On this basis, we could deem the effect of KEF on temperatures change in North America is independent with Tropical Ocean.

Table 2 The correlation coefficients between the KEFI and EOF patterns in autumn and winter
Notes: Correlation coefficient exceeds 95% (†) and 99% (††) level.
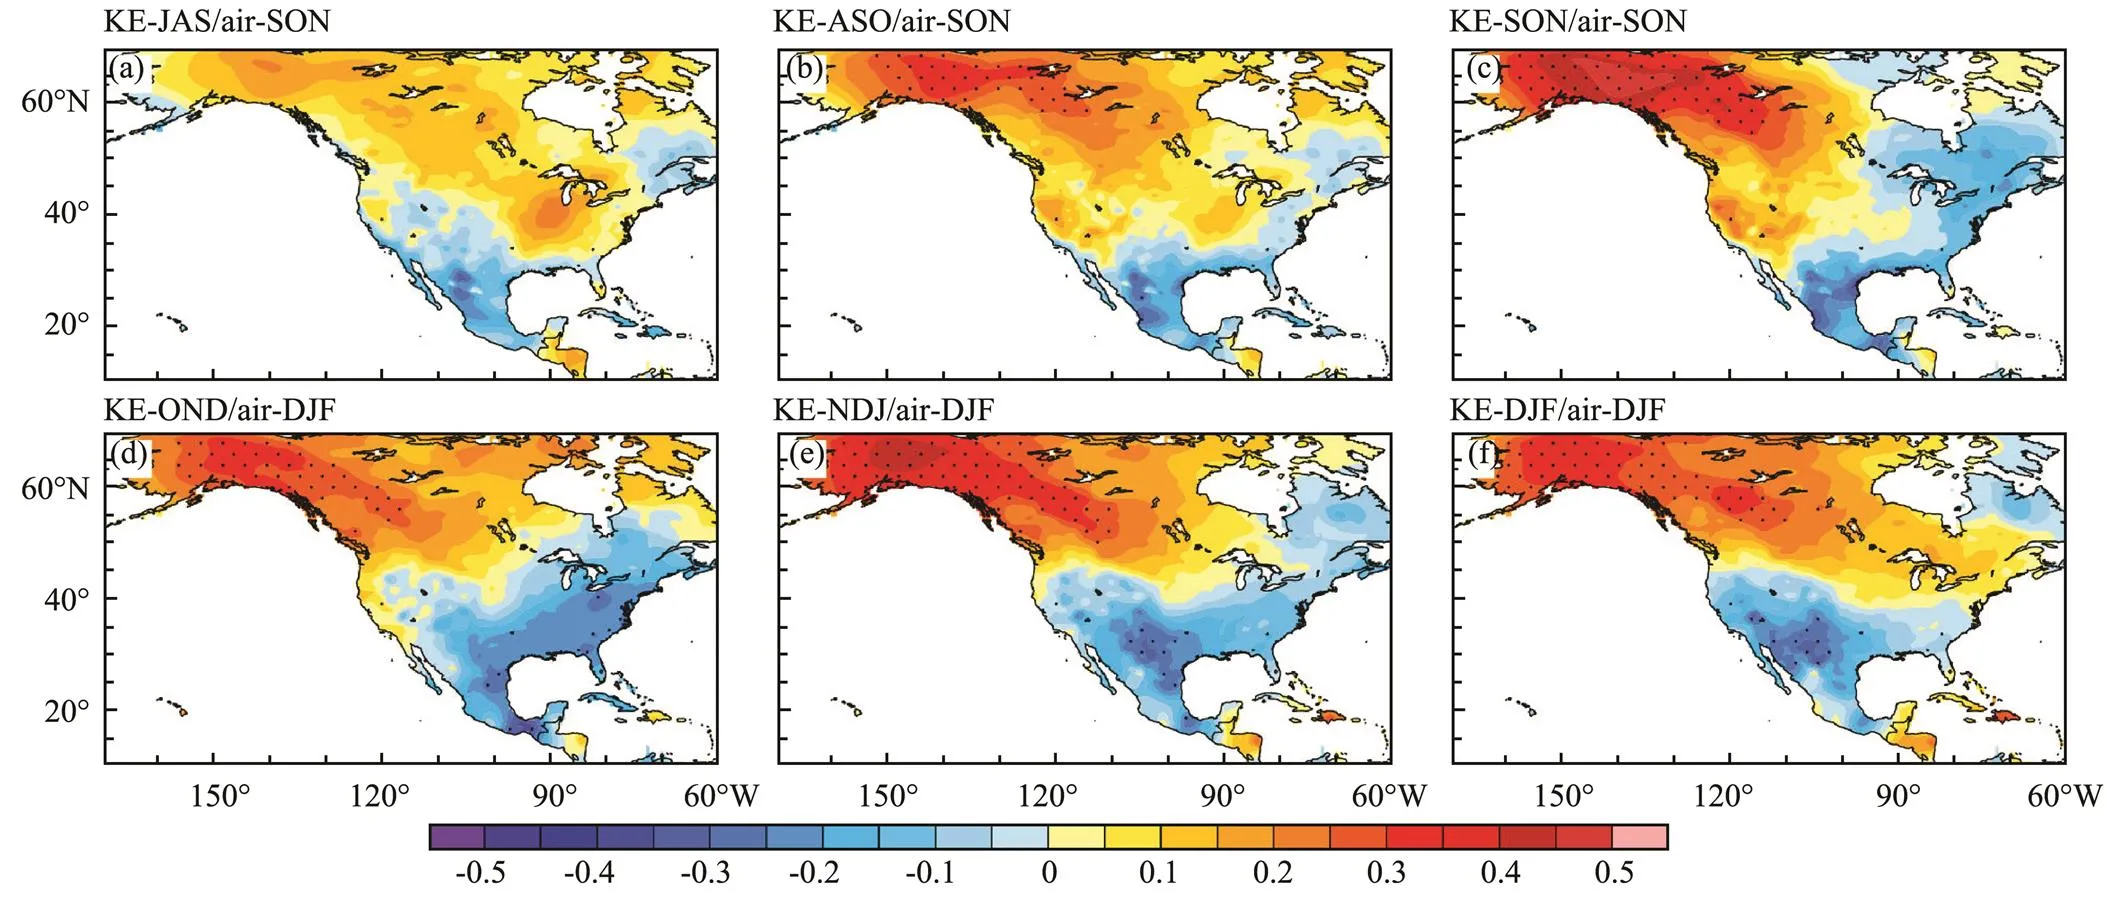
Fig.4 Correlation maps of autumn SAT over North America with three-mean seasonal KEFI which leads SAT (a) two months, (b) one month, and (c) zero months. (d–f) are the same as (a–c) but for winter. Dotted areas indicate the 95% confidence level or above.
3.3 Possible Mechanism
As outlined above, the KEF affects air temperatures in North America. To better illustrate the relationship between the variations in the KEF and SAT in autumn and winter, Figs.5a and 5b show the composite differences (shaded) and seasonal climatology (contoured) of the SAT between high- and low-KEFI autumns and winters. The predominant area of increased temperature is located mainly on the western side of North America in autumn and in the northern area in the winter, which is consistent with the correlation distribution. The positive SAT anomaly differences in winter are stronger and farther south than those that develop in autumn, and the maximum positive regions almost pass the 95% confidence level in both seasons. In relation to the climatology, it represents a warming and cooling of the SAT in North America during the positive phase of the KEFI in the two cold seasons (autumn and winter).
The SAT depends largely on the upper-level atmospheric circulation field. To investigate the process by which the KE influences SAT, it is important to consider the variability of the large-scale circulation states for the two cold seasons in the KEFI positive and negative phases (Fig.6). In the lower troposphere, as shown in Figs.6a and 6b, an anomalous southwest wind from the northeastern Pacific Ocean brings warm and wet air onto the land and is conducive to an increase in the western SAT. During a positive-KEFI autumn, a strong abnormal northwest wind over central North America drives cool air to the east and forms an east–west dipole because of the increasing temperatures to the west while decreasing temperatures to the east, which corresponds to the pattern of the correlation distribution (Fig.6a). Meanwhile, an anomalous northwest wind occurs farther south and is weaker in winter, and the westerly is displaced northwards (Fig.6b).
The composite differences in the geopotential height anomalies and climatology at 500hPa in autumn and winter are shown in Figs.6c and 6d, respectively. The difference patterns seen in autumn and winter are similar, but in winter the difference is stronger and more signifi- cant. As we know, autumn and winter have different climatic average flows in the middle troposphere. The atmospheric circulation in autumn is in the seasonal transition period, with the strengthened East Asian trough to the west and the ridge over Alaska forming gradually. In Fig.6c, the pattern of abnormal geopotential height at high latitudes is zonal ‘− + −’, which is PNA-like pattern, with an increase over western North America but a decrease over the Pacific and eastern North America. After calculating the correlation coefficient between KEFI and PNA index (Wallace and Gutzler, 1981), it is found the KEFI in autumn is well related with PNA (=0.275, significant at the 95% level) but not in winter (=0.148). The anomalous geopotential height at 500hPa still has some difference with PNA in positive/negative centers’ location. The negative center of anomalous geopotential height in Eastern North America is weaker and northward compared with the positive phase of PNA. The PNA-like pattern promotes the development of the Alaska ridge and the trough located in Eastern North America during positive-KEFI years. SAT over North America increases in front of the ridge and decreases behind the ridge, and this explains why the temperature anomaly displays an east-west dipole configuration similar to that of the EOF2 mode in autumn. By winter (Fig.6d), the East Asian trough and Alaska ridge have formed. At high latitudes, the negative geopotential height anomaly over the North Pacific and positive anomaly over central North America cause the trough and ridge to be strong and eastward, which leads the temperatures over central North America to increase in positive-KEFI winters.
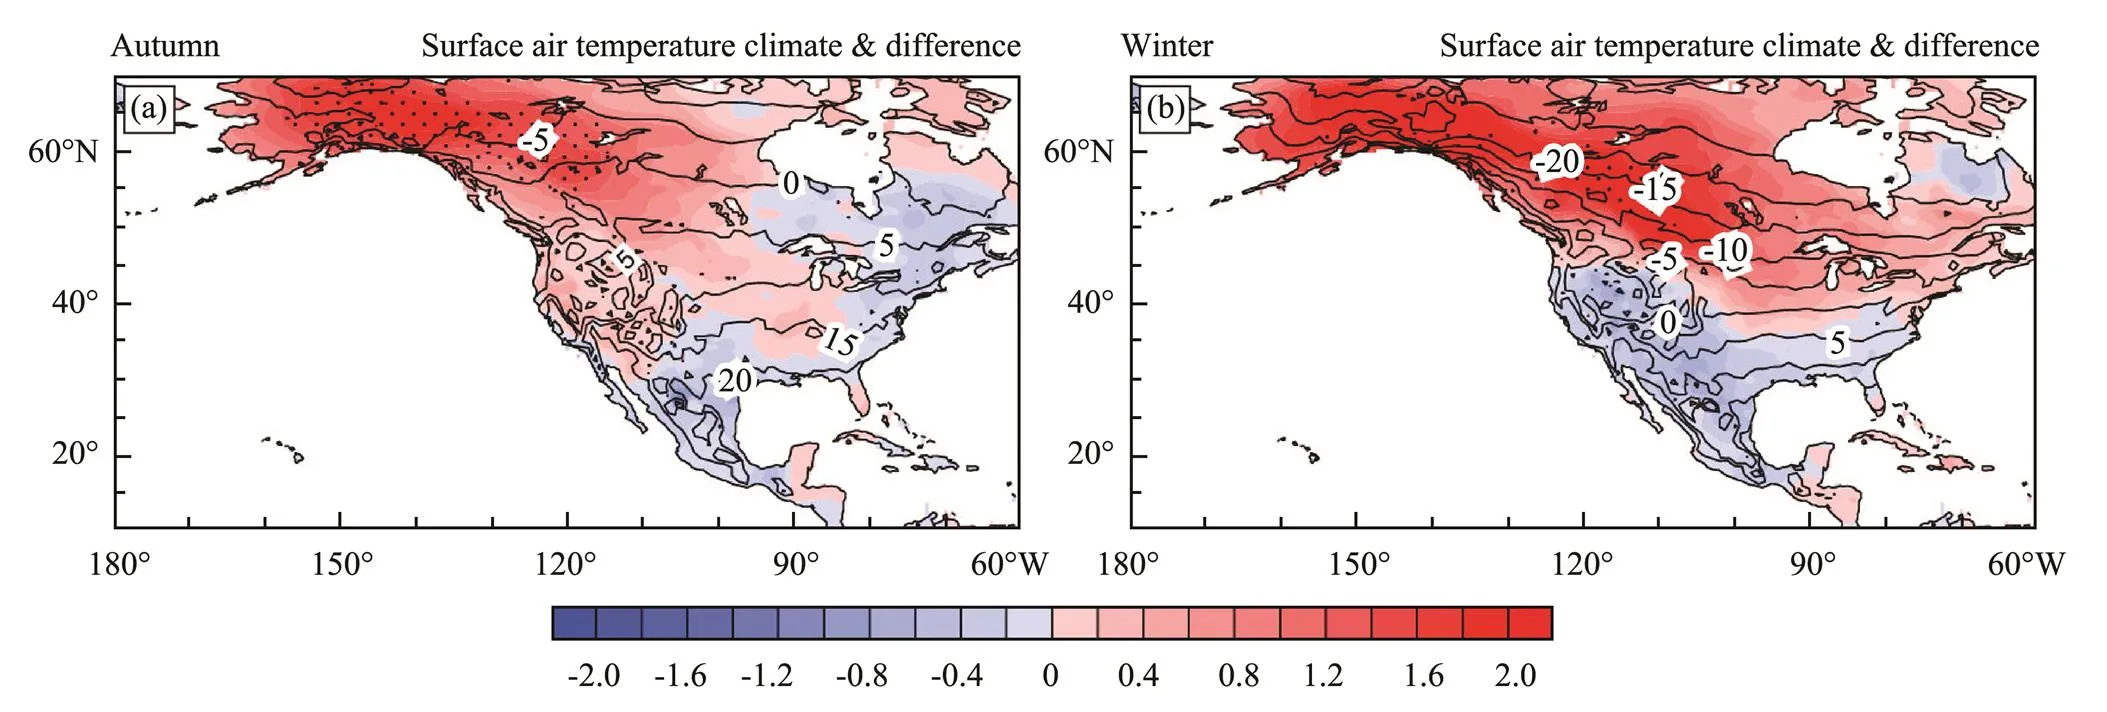
Fig.5 Composites mean difference (contoured, ℃) between SAT over North America in positive- and negative-KEFI autumns (a) and winters (b). The solid lines represent seasonal mean SAT. Areas with the 95% confidence level are indicated by black dots.

Fig.6 The difference composite of wind, and geopotential height between positive- and negative-KEFI years during autumn (left row) and winter (right row). (a, b) The difference (vectors, ms−1) and zonal climatology (shading, ms−1) of wind at 850hPa. (c, d) The difference (shading, gpm) and climatology (contours, gpm) of geopotential height. And (e, f) being the same as (a, b) but for 200hPa. The dotted (c, d) and white dashed (a, b, e, and f) shaded areas indicate statistical significance at the 95% confidence level.
The high-level wind is equally important. The abnormal wind and climatological zonal wind speed in the upper troposphere are shown in Figs.6e and 6f, and the westerly anomaly occurs near the jet region and the southwesterly anomaly over the northwestern coast of the North America during the cold autumn and winter seasons. Obviously, the jet in winter is much stronger and wider than that in autumn. Regardless of whether the abnormal westerly or easterly over the Pacific in winter are stronger than that in autumn, the situation over land is the opposite. In positive-KEFI years, the north of the westerly jet is strengthened, whereas the southern is slightly weakened by the abnormal easterly. In addition to variations in the jet, the wind anomaly near the northwest coast of North America is similar to that at the lower level at 850hPa, where the abnormal southerly wind component favors an increase in the land temperatures.
In conclusion, our analysis suggests that the atmospheric circulation will respond to changes in KEF strength, and that variations in the larger-scale circulation between lower and upper levels are conducive to an increase (decrease) in the SAT in western North America and a decrease (increase) in eastern North America during positive (negative) KEFI autumns, and an increase (decrease) in central North America during positive (negative) KEFI winters.
4 Discussion and Conclusions
We have investigated the correlation between the KEF and SAT over North America during autumn and winter using an index of KEF strength. In the autumn of positive-KEFI years, the SAT increases in the west of North America while it decreases in the east, which is similar to the second spatial pattern of the same quarter. Furthermore, the correlation coefficient between the autumn KEFI and the EOF2 time series is significant at the 99% confidence level, and the correlation map is also similar to the EOF2 pattern. For winter, central North America warms in positive-KEFI years, except at some low latitudes. The KEFI and time series of winter EOF1 have a significant correlation, and the spatial patterns are highly consistent. Correlation analysis indicates a close relationship between KEF and the temperatures over North America during autumn and winter.
To verify the relationship, we used atmospheric data to obtain composite difference maps of the large-scale circulations between positive and negative years. The maps have shown that during positive-KEFI years, the westerly jets of both the high and low troposphere are displaced northwards, and the southerly anomaly appears over the northwestern coast of America, which causes the temperatures of northwestern North America to increase in autumn and winter. In addition, the troughs and ridges deepen in the middle troposphere, and the abnormal geopotential height over North America in autumn is in the east-west opposite mode and causes the corresponding temperature changes. The abnormal geopotential height over the whole of North America in winter is positive, which leads to an increase in temperatures over the central area. Both the low- and high-level atmospheric circulation promote the northward movement of a warm air mass towards the land during the positive phase of the KEF, and vice versa.
In summary, the strength of the KEF has an important influence on the SAT of North America during autumn and winter. The specific process involved, and the extent of the KEF effect, will be the subject of a future study.
In previous researches, the location and structure of storm tracks are strongly determined by the presence (or not) of regions of enhanced SST gradient in the mid-latitude. And Favre and Gershunov (2006, 2009) found that the increasing/decreasing cyclones/anticyclones in North Pacific could influence the SAT in North America. But the specific variation of cyclones/anticyclones in storm tracks caused by KEF needs further research.
Acknowledgements
This study was supported in part by the National Natural Science Foundation of China (Nos. 41490642, 41690640 and 41665004).
Chelton, D. B., Esbensen, S. K., Schlax, M. G., Thum, N., Freilich, M. H., Wentz, F. J., Gentemann, C. L., Mcphaden, M. J., and Schopf, P. S., 2001. Observations of coupling between surface wind stress and sea surface temperature in the eastern tropical Pacific., 14 (7): 1479-1498.
Chen, S., 2008. The Kuroshio extension front from satellite sea surface temperature measurements., 64 (6): 891-897.
Deser, C., Terray, L., and Phillips, A. S., 2016. Forced and internal components of winter air temperature trends over north america during the past 50 years: Mechanisms and implications., 29: 160107131720009.
Favre, A., and Gershunov, A., 2006. Extra-tropical cyclonic/anticyclonic activity in north-eastern Pacific and air temperature extremes in western North America., 26 (6): 617-629.
Favre, A., and Gershunov, A., 2009. North pacific cyclonic and anticyclonic transients in a global warming context: Possible consequences for western North American daily precipitation and temperature extremes., 32 (7-8): 969-987.
Feldstein, S. B., 2002. Fundamental mechanisms of the growth and decay of the PNA teleconnection pattern., 128 (581): 775-796.
Feng, J., and Hu, D., 2014. How much does heat content of the western tropical Pacific Ocean modulate the South China Sea summer monsoon onset in the last four decades., 119 (7): 4029-4044.
Hashizume, H., Xie, S. P., Liu, W. T., and Takeuchi, K., 2001. Local and remote atmospheric response to tropical instability waves: A global view from space., 106 (D10): 10173-10185.
Hu, D., Wu, L., Cai, W., Gupta, A. S., Ganachaud, A., Qiu, B., Gordon, A. L., Lin, X., Chen, Z., Hu, S., Wang, G., Wang, Q., Sprintall, J., Qu, T., Kashino, Y., Wang, F., and Kessler, W. S., 2015. Pacific western boundary currents and their roles in climate., 522 (7556): 299.
Kelly, K., and Dong, S., 2004. The relationship of western boundary current heat transport and storage to midlatitude ocean-atmosphere interaction. In:. American Geophysical Union, 147: 347-363.
Kelly, K. A., Small, R. J., Samelson, R. M., Qiu, B., Joyce, T. M., Kwon, Y. O., and Cronin, M. F., 2010. Western boundary currents and frontal air-sea interaction: Gulf Stream and Kuroshio extension., 23 (21): 5644-5667.
Kwon, Y. O., Alexander, M. A., Bond, N. A., Frankignoul, C., Nakamura, H., Qiu, B., and Thompson, L., 2010. Role of the Gulf Stream and Kuroshio-Oyashio systems in large-scale atmosphere-ocean interaction: A review., 23 (12): 3249-3281.
Liu, T. W., Xie, X., Polito, P. S., Xie, S., and Hashizume, H., 2000. Atmospheric manifestation of tropical instability wave observed by quikscat and tropical rain measuring mission., 27 (16): 2545-2548.
Murazaki, K., Tsujino, H., and Motoi, T., 2015. Influence of the Kuroshio large meander on the climate around Japan based on a regional climate model., 93 (2): 161-179.
Nakamura, H., and Kazmin, A. S., 2003. Decadal changes in the north Pacific oceanic frontal zones as revealed in ship and satellite observations., 108 (C3): 371-376.
Nakamura, H., Sampe, T., Tanimoto, Y., and Shimpo, A., 2004. Observed associations among storm tracks, jet streams and midlatitude oceanic fronts. In:. American Geophysical Union, 147: 329-345.
Nonaka, M., and Xie, S. P., 2003. Covariations of sea surface temperature and wind over the Kuroshio and its extension: Evidence for ocean-to-atmosphere feedback., 16 (9): 1404-1413.
Renwick, J. A., and Wallace, J. M., 1996. Relationships between north Pacific wintertime blocking, El niño, and the PNA pattern., 124: 2071-2076.
Sasaki, Y. N., Minobe, S., Asai, T., and Inatsu, M., 2012. Influence of the Kuroshio in the East China Sea on the early summer (baiu) rain., 25 (19): 6627-6645.
Small, R. J., Deszoeke, S. P., Xie, S. P., Neill, L. O., Seo, H., Song, Q., Cornillon, P., Spall, M., and Minobe, S., 2008. Air-sea interaction over ocean fronts and eddies., 45 (3-4): 274-319.
Taguchi, B., Nakamura, H., Nonaka, M., and Xie, S. P., 2009. Influences of the Kuroshio/Oyashio extensions on air-sea heat exchanges and storm-track activity as revealed in regional atmospheric model simulations for the 2003/04 cold season., 22 (24): 6536-6560.
Qiu, B., 2002. The Kuroshio extension system: Its large-scale variability and role in the midlatitude ocean-atmosphere interaction., 58 (1): 57-75.
Qu, T., Mitsudera, H., and Qiu, B., 2001. A climatological view of the Kuroshio/Oyashio system east of Japan., 31 (9): 2575-2589.
Wallace, J. M., and Gutzler, D. S., 1981. Teleconnections in the geopotential height field during the northern hemisphere winter., 109 (4): 784-812.
Wang, Y. H., and Liu, W. T., 2015. Observational evidence of frontal-scale atmospheric responses to Kuroshio extension variability., 28 (23): 150924130818006.
Xie, S., Jan, H., Youichi, T., Liu, W. T., Hiroki, T., and Xu, H. 2002. Bathymetric effect on the winter sea surface temperature and climate of the Yellow and East China Seas., 29 (24): 2228, DOI: 10.1029/2002GL015884.
Xu, H., Xu, M., Xie, S. P., and Wang, Y., 2011. Deep atmospheric response to the spring Kuroshio over the East China Sea., 24 (18): 4959-4972.
(Edited by Xie Jun)
(Received March 5, 2017; revised March 29, 2017; accepted April 11, 2017)
© Ocean University of China, Science Press and Springer-Verlag GmbH Germany 2018
. E-mail: xiaozn@lasg.iap.ac.cn
杂志排行
Journal of Ocean University of China的其它文章
- Offshore Fault Geometrics in the Pearl River Estuary, Southeastern China: Evidence from Seismic Reflection Data
- Application of Geoid Anomalies to the Tectonic Research in the East Asian Continental Margin
- Middle Holocene Organic Carbon and Biomarker Records from the South Yellow Sea: Relationship to the East Asian Monsoon
- Mesozoic Deformation and Its Geological Significance in the Southern Margin of the South China Sea
- Optimization of Shanghai Marine Environmental Monitoring Sites in the Identification of Boundaries of Different Water Quality Grades
- Seasonal Variation of Environmental Variables and Phytoplankton Community Structure and Their Relationship in Liaodong Bay of Bohai Sea, China
