Understanding the Influence of microwave on the relative volatility used in the pyrolysis of Indonesia oil sands☆
2018-08-18HongLiPengShiXiaoleiFanXinGao
Hong Li,Peng Shi,Xiaolei Fan*,Xin Gao,*
1School of Chemical Engineering and Technology,National Engineering Research Center of Distillation Technology,Collaborative Innovation Center of Chemical Science and Engineering(Tianjin),Tianjin University,Tianjin 300072,China
2School of Chemical Engineering and Analytical Science,The University of Manchester,Sackville Street,Manchester,M13 9PL,United Kingdom
Keywords:Oil sands Microwave irradiation Pyrolysis Fuel Relative volatility
ABSTRACT In this paper,pyrolysis of Indonesian oil sands(IOS)was investigated by two different heating methods to develop a better understanding of the microwave-assisted pyrolysis.Thermogravimetric analysis was conducted to study the thermal decomposition behaviors of IOS,showing that 550°C might be the pyrolysis final temperature.A explanation of the heat–mass transfer process was presented to demonstrate the Influence of microwave-assisted pyrolysis on the liquid product distribution.The heat–mass transfer model was also useful to explain the increase of liquid product yield and heavy component content at the same heating rate by two different heating methods.Experiments were carried out using a fixed bed reactor with and without the microwave irradiation.The results showed that liquid product yield was increased during microwave induced pyrolysis,while the formation of gas and solid residue was reduced in comparison with the conventional pyrolysis.Moreover,the liquid product characterization by elemental analysis and GC–MS indicated the significant effect on the liquid chemical composition by microwave irradiation.High polarity substances(ε> 10 at 25 °C),such as oxyorganics were increased,while relatively low polarity substances(ε< 2 at 25°C),such as aliphatic hydrocarbons were decreased,suggesting that microwave enhanced the relative volatility of high polarity substances.The yield improvement and compositional variations in the liquid product promoted by the microwave-assisted pyrolysis deserve the further exploitation in the future.
1.Introduction
Oil sands(also known as crude bitumen)are a type of unconventional petroleum deposit consisted of sand,clay,water and bitumen.The largest deposit of oil sands is found in Canada(e.g.70.8%of the world total natural bitumen reserves)where the total recoverable oil sand deposit in Canada is even larger than Saudi Arabia's established oil reserve.Oil sand is an unconventional source of petroleum attracted much attention due to the depletion of conventional oil resources.It is a dark,highly viscous fluid that is nearly solid at room temperature,which makes its recovery difficult and time consuming.Many methods have been developed and investigated for the bitumen recovery from oil sands[1],i.e.separating bitumen from sand grains,including hot water extraction,solvent extraction,and pyrolysis.The hot water extraction process was the industrial standard and used in Canada in the last century.However,it consumes the large amount of water,as well as requiring the treatment of toxic tailing ponds have,limiting its further deployment due to the environmental concerns.The solvent extraction process achieves relatively high bitumen recovery efficiency and reduces water and energy consumption,but it is not recommended because of the involvement of expensive,volatile, flammable,and toxic organic solvents[2].Pyrolysis is an alternative method to recover bitumen fro moils ands.Pyrolysis is the process of heating the oils ands to the temperature high enough for its organic components to crack into smaller hydrocarbons.During oils and pyrolysis,bitumen cracks into smaller hydrocarbons,for mingtar,gas,and solid residue product,which are both a valuable fuel and chemical source.The pyrolysis process of oil sands requires no water or solvent consumption and produces no pollution.However,the formation of chars during the pyrolysis process reduces the conversion of bitumen.The pyrolysis oil contains significant a mounts of heavy hydrocarbons,and a further upgrading process is needed.Another disadvantage is that the sand grains absorb a large amount of heat during pyrolysis.Though the high temperature sands can be used as a heat carrying agent to preheat the feedstock or the carrier gas,the heat loss is not negligible[3].
Technologies such as microwave heating have been successfully employed in the thermal cracking of oil sands.Integrating microwave heating into pyrolysis is a novel concept which has been attracting increasing attention in recent years.In conventional heating methods,heat is transferred into materials by convection,conduction,and radiation to material surfaces.On the contrary,microwave energy is delivered directly into materials within an electromagnetic field[4].Therefore,energy is transferred by thermal gradients in the conventional heating,but microwave heating is the conversion of electromagnetic energy into molecular kinetic energy rather than heat transfer[5].The phenomenon of energy conversion can make the microwave heating more efficient.Since heat can be generated throughout the volume of the material,the energy transfer does not rely on diffusion of heat from the surfaces,and it is possible to achieve rapid and uniform heating of thick materials[6].What's more,compared with light induced heating process,microwave heating has a greater Influence on the liquid product distribution and characteristics at the same heating rate[7].Microwave heating has been successfully employed in the thermal cracking of oil sands.
A lot of pyrolysis studies have been conducted using microwave as a heating source.From the sestudies,they mainly focused on the optimization of operating conditions.The primary factors affecting the productivities were studied including reaction temperature[8],reaction time[9],microwave power[10],vacuum degree[11],particle size[12],additives[13],and the original characteristics of feedstock[14].After comparing the obtained results with those of the conventional pyrolysis,few researches made a detail interpretation for the distribution and character of product.The mechanism of microwave enhancement is necessary to be further researched to have a clear understanding of the microwave pyrolysis progress and get a higher quantity and quality pyrolysis products.
In this paper,microwave and conventional pyrolysis of oil sands from Indonesia were studied to understand the effect of microwave irradiation on product yield and quality improvement.Firstly,TGA was carried out to investigate the thermal decomposition behavior and determine the final pyrolysis temperature.Secondly,a fixed bed reactor and a microwave reactor were applied to carry out both pyrolysis processes with the same heating rate.Finally,the yield distributions and the compositions of products were determined to demonstrate the effect of microwave irradiation on the heat–mass transfer of the pyrolysis process and relative volatility of the pyrolysis products.
2.Experimental
2.1.Materials
The oil sands used for all of the experiments were from Indonesia and were crushed into particles less than 5 mm in diameter.Their element and proximate analyses for IOS were conducted before our pyrolysis experiments:C:81.75%,H:8.68%,N:0.55%,O:2.43%,S:6.59%;moisture:1.25%,volatiles:26.62%, fixed carbon:0.91%,ash:71.22%.By Soxhlet extraction[15],the oil sand consisted of 27.14%bitumen.The carbon powder with a diameter of 15 μm was a metal free solid,served as a microwave absorber,which can reach temperatures of up to 1000°C or higher in a few minutes.
2.2.Thermogravimetric analysis
A TGA Instruments Q50 thermogravimetric analyzer was used to study the pyrolysis behavior of oil sand.The experiment was carried out using about 20 mg oil sand sample with the diameter less than 2 mm,from 30 °C to 600 °C[16]at the heating rate of 10 °C·min−1,under 50 ml·min−1nitrogen flow.
2.3.Pyrolysis experiments
2.3.1.Pyrolysis in a microwave reactor
A multimode on–off microwave oven that delivers microwaves at different powers was utilized for pyrolysis experiments of the IOS.Fig.1 depicts the experimental set-up of the bench top microwave pyrolysis unit.The oven was modified by drilling a 40 mm hole,opening at the top to insert a quartz adaptor that connects the quartz flat bottom container with the condenser to collect the liquid product.The modified thermocouple was also inserted into the reaction vessel through the adaptor.A 250 ml flask,which was maintained at a temperature of−5 °C by continuous circulation of chilled mixture,containing glycol and water,was used to collect the condensates.Two stage condensation ensured that the condensable liquids were collected at the low enough ambient temperature.
In the experiments,the initial mass of IOS was(40±0.1)g,and the mass ratio of IOS to absorber was 20:1.Microwave absorber and IOS were shaken for 30 s prior to pyrolysis to eliminate the segregation of IOS and absorber particles within the reaction mixture,which guaranteed homogeneity and uniform energy transfer.The thermocouple was inserted into the quartz reactor and its position was adjusted to touch the reaction mixture to accurately measure the temperature.Due to the homogeneous mixing,localized hot spot formation did not occur within the reaction vessel,which was verified by placing the temperature sensor at different locations within the quartz vessel.Utmost care was taken to eliminate the impact of induced current for temperature measurement.In order to conduct induced current on the surface of the thermocouple,the thermocouple was attached to the oven cavity and the cavity was grounded.Repeatability in temperature measurement within±3°C was observed.Before starting everyexperiment,the entire system,including the reaction mixture and downstream condensation units was thoroughly purged with N2gas at a flow rate of 0.1 L·min−1to maintain inert environment.Microwave power densities(7.5,12.5,17.5 W·g−1)and ultimate temperature(550 °C)were set in the microwave oven,and the off-time temperature was recorded every 15 s.All powers culminated at 550°C,with each sample held at this temperature for an interval of 20 min.

Fig.1.Schematic diagram of the microwave pyrolysis experimental setup.
2.3.2.Pyrolysis in a fixed bed reactor
Fig.2 illustrates the schematic diagram of the pyrolysis apparatus.The pyrolysis experiments were conducted in a laboratory-scale fixed bed reactor.The horizontal sealed fixed bed cylindrical reactor tube had an internal diameter of 50 mm and a length of 500 mm.The fixed bed reactor tube contained a hollow half cylindrical drawer with a length of 450 mm,allowing the samples to be spread flat when the drawer was charged into the reactor tube.The reactor tube was heated externally by an electric heating element of a temperature-programmed furnace,and the temperature was measured by a thermocouple inside the reactor tube.
Compared with microwave heating experimental process,we studied the Influence of heating rates(20,30,40 °C·min−1)for IOS only,to reach(and maintain for20min)a temperature of 550°C.During the pyrolysis under N2,N2was introduced into the reactor tube as inert gas at a flow rate of 0.1 L·min−1constantly.
Gas and volatiles formed during pyrolysis flowed out from the reactor,and then crossed through the cooling unit which was comprised of a round-bottomed flask and two glass condensers cooled with the circulation of water glycol using a cryostat at approximately−5°C.The liquid product was then condensed and collected in the flask.The non-condensable gas was collected in a gas bag connected to the end of the condenser.When the reactor tube reached ambient temperature inside after each pyrolysis run,the solid residue product was collected[17].
The liquid product was then condensed and collected in the flask.There were also tars condensed on the cooling unit since the tar had relatively high viscosity.Therefore,dichloromethane(weighed and recorded as MD)was used as a solvent to wash the tars on the cooling unit.The liquid we finally collected(weighed and recorded as MT)from the flask contained tar(liquid product)and dichloromethane.The mass of the liquid product(ML)could be calculated by Eq.(1).

where MLis the mass of the liquid product,MTis the total mass of the liquid product and dichloromethane we collected from the flask,and MDis the mass of dichloromethane we used to wash the cooling unit.
The non-condensable gas was collected in a gas bag connected to the end of the condenser.When the reactor tube reached ambient temperature inside after each pyrolysis run,the solid residue product was collected,weighed,and recorded as MS.The mass of the gaseous product was obtained by difference using Eq.(2).

where MGis the mass of the gaseous product,MFis the initial mass of the feedstock,MLis the mass of the liquid product,and MSis the mass of the solid residue product.
The mass of liquid,gaseous,and solid residue products in the fixed bed reactor pyrolysis were recorded as ML,MG,and MS,respectively.The yields of liquid,gaseous,and solid residue products in all pyrolysis experiments were calculated by Eq.(3).

where Yiis the yield of i(liquid,gas,and solid)in pyrolysis,Miis the mass of i(liquid,gas,and solid),and MFis the initial mass of the feedstock.Each pyrolysis experiment was conducted in triplicate in order to con firm reproducibility,and the value reported for each yield was the average of three equivalent runs with its absolute error.
2.4.Characterization of pyrolysis products
2.4.1.Liquid product characterization
2.4.1.1.Elemental analysis.Elemental analysis of CHNOS was performed using an Elementar Analysensysteme GmbH vario MICRO V1.6.4 analyzer for bitumen extracted from IOS and pyrolysis liquid product.
2.4.1.2.GC–MS analysis.The chemical compositions of the liquid product samples were determined using the gas chromatography mass spectrometry(GC–MS).The liquid product samples were diluted with dichloromethane to a ratio of 1:100,and then dried with anhydrous sodium sulfate and filtered by a 0.45 μm PTFE filter.GC–MS analysis was carried out on an Agilent 7890A GC System equipped with an Agilent 5975C Mass Selective Detector and an Agilent 7683B auto-sampler.The column used was HP-5MS capillary column(30 m×0.25 mm×0.25 μm).Helium was employed as the carrier gas at a constant flow rate of 1.0 ml·min−1at a split ratio of 100:1.A sample of 0.2 μl was injected.The initial oven temperature was maintained at 50°C for 3 min and programmed to increase at 15 °C·min−1to 280 °C(held for 5 min).The temperatures of the injector,the ion source and the MS transfer line were kept constant at 300,230 and 260°C respectively.The solvent delay was set at 2 min.The ionization mode of MS was EI and the ionization voltage was 70 eV.The voltage applied to the multiplier detector was 2059 V and an m/z from 30 to 550 was scanned.
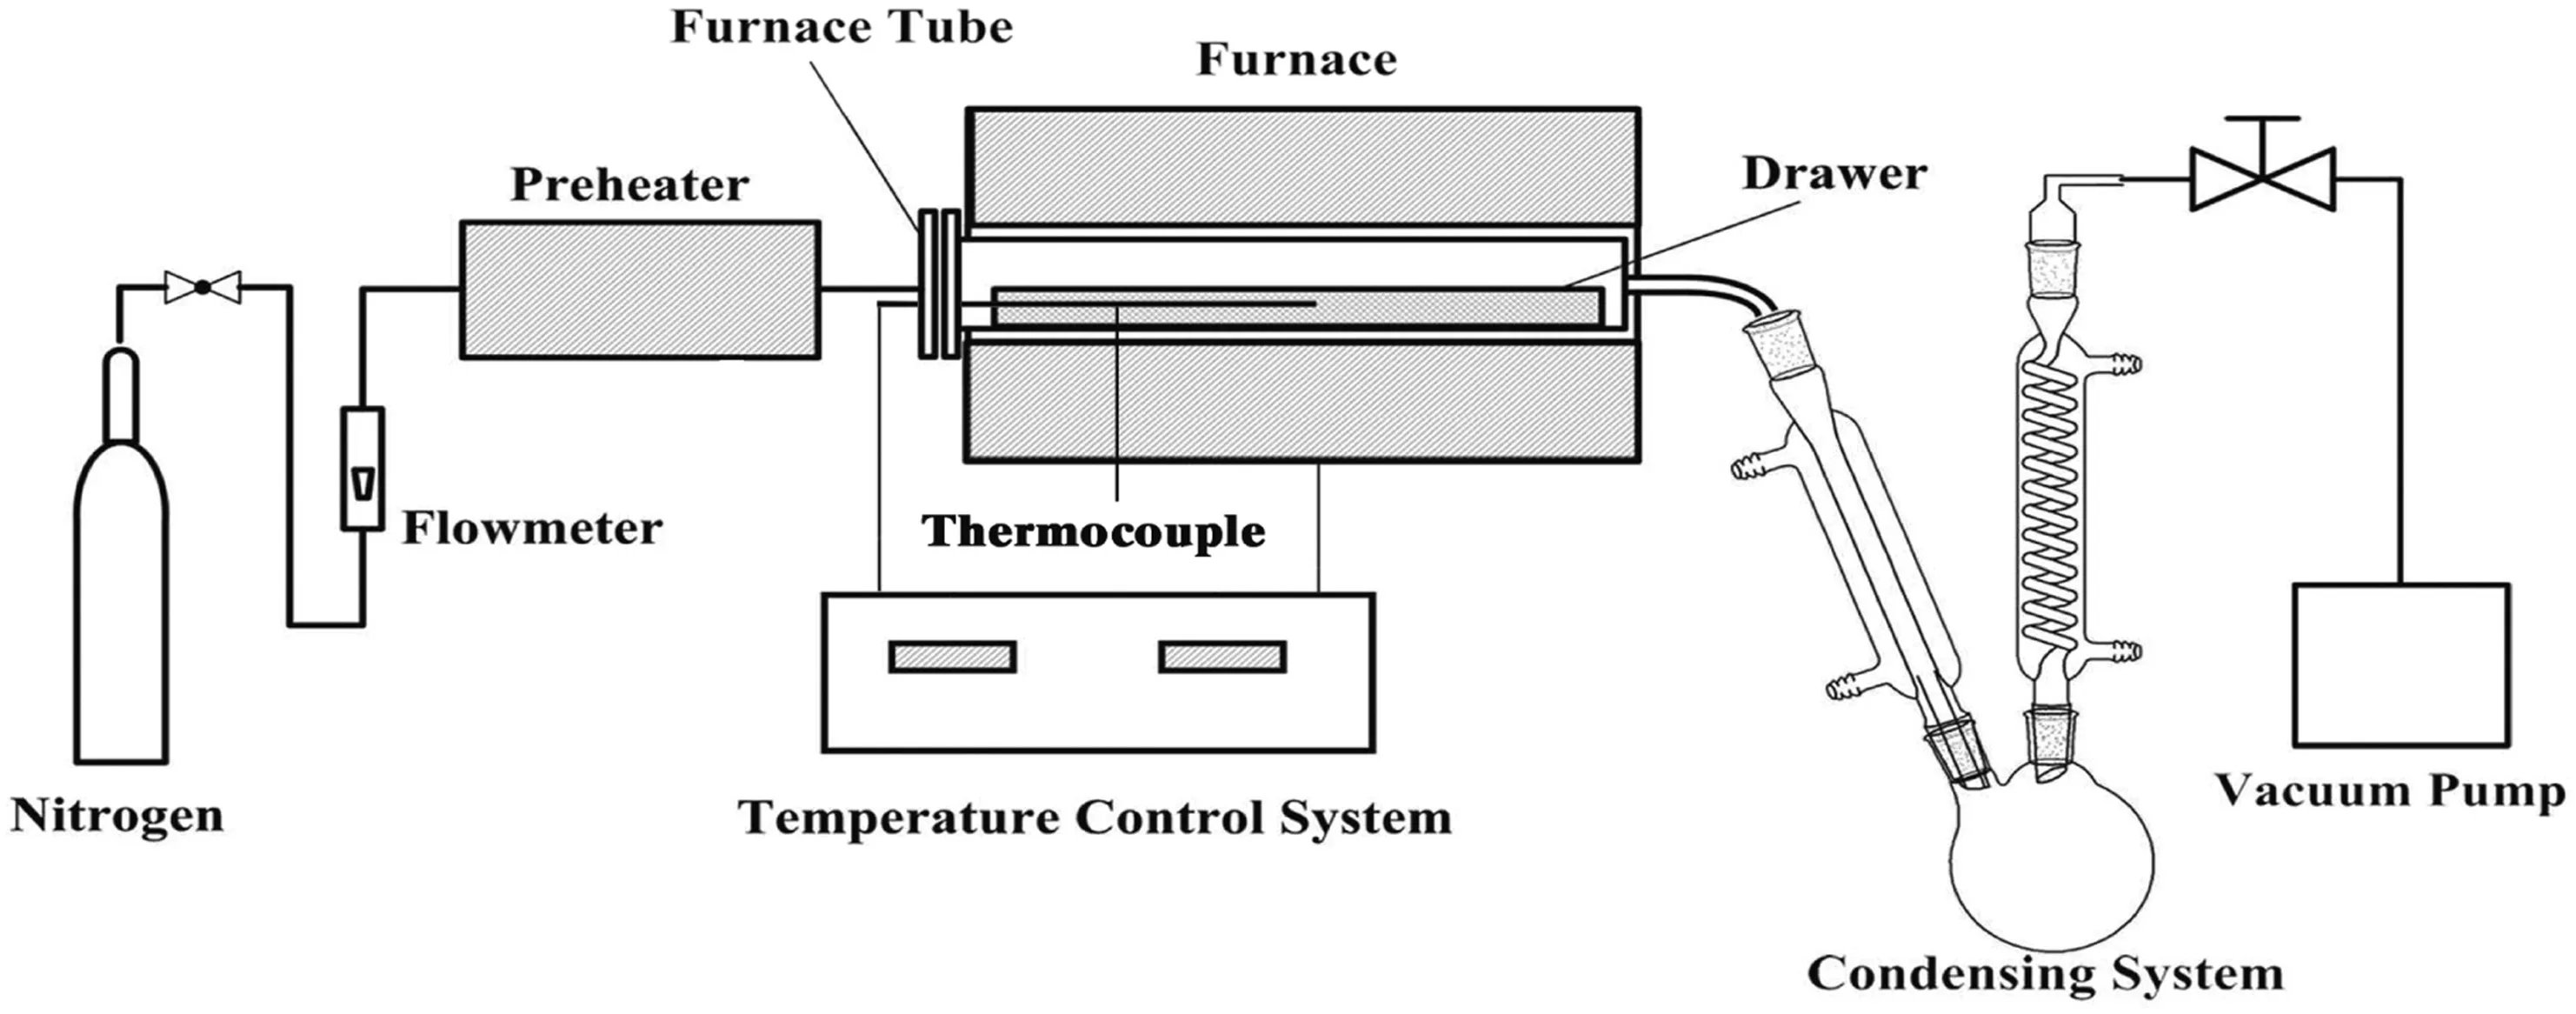
Fig.2.Schematic diagram of the fixed bed reactor.
2.4.2.Gaseous product characterization
The major constituents of gaseous products(H2,CO,CH4,and CO2)obtained from individual pyrolysis and co-pyrolysis were determined using a Perkin Elmer Autosystem XL gas chromatograph(GC)equipped with a carbon molecular sieve packed column(TDX-01)and a thermal conductivity detector(TCD).Helium was used as the carrier gas to analyze the content of CO,CH4,and CO2.The oven temperature was kept90°C for 14 min.The injector and detector temperatures were set at 120 and 150°C,respectively.Nitrogen was used as the carrier gas to analyze the content of H2in which the oven,injector,and detector temperatures were 170 °C(7 min),80 °C and 170 °C,respectively.
3.Results and Discussion
3.1.Thermogravimetric analysis
Fig.3 shows the thermogravimetric(TG)and the reversed differential thermogravimetric(DTG)curves of IOS at 10 °C·min−1.It was observed that the mass-loss process of oil sand could be divided into three steps based on the mass loss rate:The first step was a small mass loss due to the evaporation of moisture and light hydrocarbons atabout150°C.The second step was a relatively light organic substance volatilizing and desorbing from 150 to 350°C.The third step of mass lossbetween350and500°Cwas caused by the main thermal decomposition of bitumen.The TG curve showed that 550°C could be treated as pyrolysis final temperature to ensure the pyrolysis process was completely finished.The DTG curve showed that the maximum mass loss rate occurred at 440°C which was useful for the optimization of pyrolysis conditions.
3.2.Temperature pro file
Temperature is one of the most important characteristics of microwave pyrolysis.The temperature pro files without microwave and under microwave power densities of 7.5,12.5 and 17.5 W·g−1are shown in Fig.4.Microwave pyrolysis of IOS cannot be run without a microwave absorber because IOS is a poor microwave energy absorber.Under microwave irradiation,IOS itself can only be heated to 200°C without carbon powder mixed.After microwave irradiation under 12.5 W·g−1,the IOS sample was quickly heated at the rate of 38.3 °C·min−1(the average value from the start to the 15th min).The maximum temperature was 559°Cat about the15th min,a little higher than the setting final temperature 550°C.After the processing time of around 15 min,the reaction temperature remained approximately constant to the end of experiment(20 min processing).Increases in microwave power densities caused the increase of maximum heating rate and shortened the time to achieve determined temperature[18].Low heating rates at lower microwave power densities are due to conductive heat and microwave reflective losses,while high heating rates achieved at high microwave power densities are due to the sustained high microwave energy transformation[19].Sample heating rate is an important criterion in pyrolysis which determines the quantity and quality of oil[20].In order to investigate the Influence of microwave irradiation,the elimination of heating rate factor is necessary for the accuracy of experiments.In the case of conventional pyrolysis at 40 °C·min−1,as shown in Fig.4,heating rate curve was closest to the curve of microwave irradiation under 12.5 W·g−1,indicating that both pyrolysis processes had the similar heating rate.
3.3.Product distribution and characterization
3.3.1.Product distribution
For both pyrolysis experiments,product distribution and compositional analysis were investigated.Fig.5 illustrates the product yield distribution of the conventional(C20,C30and C40)and microwave pyrolysis(M7.5,M12.5and M17.5).The results were the average values of three repetitions with relative errors.The liquid product yields of C20,C30andC40and those of M7.5,M12.5andM17.5were 15.8%,14.2%,12.3%,19.7%,18.1%and 15.8%,respectively.The gaseous product yields in two different pyrolysis methods were 5.5%,6.7%,8.9%,4.4%,5.1%and 5.9%,respectively.The solid product yields of C20,C30and C40and those of M7.5,M12.5and M17.5were 78.7%,79.1%,78.8%,75.9%,76.8%and 78.3%.The highest liquid yield occurred at the heating rate of 20 °C·min−1in conventional pyrolysis and the power density of 7.5 W·g−1in microwave pyrolysis.A higher power density meant a faster heating rate for microwave pyrolysis.As known high heating rates were favorable for improving the liquid yield[21].However,as the heating rate increases,the liquid yield decreased.This is because in a batch pyrolysis process,higher heating rates shortened the time to reach the desired temperature(550°C),and the total reaction time was reduced,and fewer liquid products could be yielded.Higher heating rates also caused the rate of pyrolysis reactions faster than the remove rate of liquid products from the reactor,which leading to cracking further into coke and gases[22].Therefore,the highest liquid yield occurred at the heating rate of 20 °C·min−1in conventional pyrolysis and the power density of 7.5 W·g−1in microwave pyrolysis.
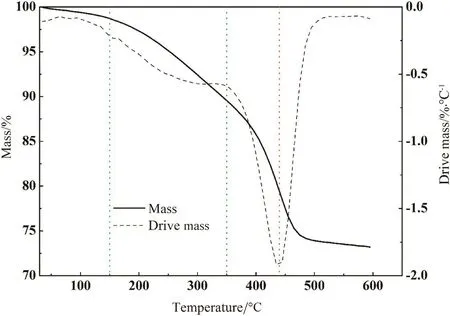
Fig.3.TG and reversed DTG curves of oil sand from 30 °C to 600 °C at the heating rate of 10 °C·min−1.

Fig.4.The temperature pro files of IOS during microwave pyrolysis and conventional pyrolysis.
Fig.5 also shows that microwave pyrolysis improved the liquid yield compared with conventional pyrolysis at the same heating rate(12.5 W·g−1and 40 °C·min−1).The differences in product distributions using different pyrolysis methods were mainly attributed to their different heat–mass transfer methods which were the critical factor.As mentioned above,the heating rate of C40stayed approximately the same as M12.5.The secondary reactions of volatiles took place significantly during the process of IOS pyrolysis when certain temperature reached[23].Compared with conventional pyrolysis,secondary cracking reactions were minimized in microwave pyrolysis due to the reduction of excessive temperature rise of volatiles.Volatile pyrolysis products were grouped into two components:(1)non-condensable gases of a fixed composition of H2,CO,CO2and small amounts of hydrocarbons,and(2)a“coke”fraction.That is to say secondary cracking reactions had a great Influence on the product distribution,causing liquids to crack further into coke and noncondensable gases.The reduction of excessive temperature rise could avoid the cracking of volatile matters in microwave pyrolysis,leading to a relatively high liquid yield.This phenomenon was bene ficial for the increase of liquid yield.

Fig.5.Product distribution in conventional and microwave pyrolysis.
3.3.2.Liquid product characterization
As the mentioned in Section3.2,the heating rate of C40stayed approximately the same as M12.5.Since we focused on the heat–mass transfer in both conventional pyrolysis and microwave pyrolysis at the same heating rate,the products from C40and M12.5were selected for product distribution analysis and product chemical characterization which represented the product of conventional and microwave pyrolysis,respectively.
3.4.Heat–mass transfer model proposal
To better explain the differences of heat and mass transmission between microwave pyrolysis and conventional pyrolysis,a heat–mass transfer model proposal is presented,shown in Fig.6.This model is conducive to analyze the pyrolysis product distribution and characterization from the perspective of heat and mass transmission.
In the microwave pyrolysis,the carbon powder was initially heated by absorbing microwave radiation and transfer thermal energy to the IOS particles[24].Subsequently,heat transferred from the inside of IOS mixed with carbon to the outside part in the same direction of mass transfer.The sample(IOS and carbon powder)was heated directly,so that it reached a high temperature in a short time,while the reactor walls remained at a lower temperature than the IOS sample.The heat generated inside the IOS sample by the microwaves caused the organic matter to vaporize and crack before it left the sample bed[25].The same direction of heat and mass transfer during microwave pyrolysis made a contribution to reducing excessive temperature rise of volatiles after leaving the sample bed,resulting in the inhibition of volatile secondary cracking reactions.
In conventional heating,the heat flow went from the walls of the reactor to the sample(IOS only),so the temperature was higher in the reactor than inside the sample.The countercurrent flow of heat and volatiles led to continuous temperature rise of the organic matters until they entered the condensing system[26].Thus,the volatile compounds generated had more possibilities to react in the gas phase,undergoing secondary cracking reactions.This gave rise to more favorable conditions than in the microwave pyrolysis process for the cracking and condensation of the oil components,which in turn would increase the yields of gas and solid product.Besides,the secondary reactions conduced to lighter compounds in conventional than in microwave heating.

Fig.6.Heat–mass transfer model proposal for conventional and microwave heating.
3.4.1.Distillation characteristics and carbon number distribution
The distillation curves for bitumen and pyrolysis-derived oil are provided graphically in Fig.7.The shapes of all three curves were of the linear type indicative of a highly complex substance with many components,distributed over a large range of relative molecular masses.The transition from low to the high boiling region continued with no large temperature jumps.The overall boiling points decreased from the maximum in bitumen,to their minimum in conventional pyrolysis-derived oil,with microwave pyrolysis-derived oil providing a middle result.Samples used in the present study differed greatly in carbon number distribution.As shown in Fig.8,the result indicated that the carbon numbers of hydrocarbon in liquid product ranged from C27–C92,C5–C60,and C8–C70,respectively.Gaussian distribution had been observed in the liquid products after pyrolysis.Solvent extraction does not involve a pyrolysis reaction,so there is a difference in the boiling point and carbon distribution between the liquid product and the bitumen.The overall carbon distribution and distillation curves proved that microwave pyrolysis led to much heavier liquid product which possesses larger carbon numbers and higher boiling points than conventional pyrolysis result[27].This result indicated that microwave irradiation effectively reduced the secondary cracking reactions to make the liquid product much heavier.

Fig.7.Distillation characteristics of liquid products of conventional and microwave pyrolysis vs.solvent extraction.

Fig.8.Carbon number distribution of liquid products of conventional and microwave pyrolysis vs.solvent extraction.
3.4.2.Elemental analysis
A CHNO elemental analysis was performed on samples derived from solvent extraction and liquid products of conventional pyrolysis and microwave pyrolysis.Since solvent extraction does not involve a reaction,there is a difference in the content of elements in the liquid product and the bitumen.The pyrolysis left behind coke in the solid residue,which was mostly composed of carbon,hence the liquid product decreased in concentration of carbon than the bitumen,as seen in Table 1.Because of the decarburization effect of pyrolysis,the hydrogen to carbon ratio presentin the products of the reaction obviously increased from what it was in the raw bitumen.All the experiments were conducted in inert atmosphere so no other oxygen added to the sample[28].It is worth mentioning that microwave pyrolysis liquid product showed an obviously increase of oxygen content, whereas the atomic H/C ratio of microwave pyrolysis liquid decreased compared to conventional pyrolysis. As known, the dielectric constant describes the ability of a dielectric material to store electrical potential energy under the influence of an electric field. The relative volatility of the substances in a mixture can be affected by microwaves. The effect of microwave upon the relative volatility may depend on the dielectric properties of the mixture. The liquid products after conventional pyrolysis and microwave pyrolysis were very complex, which contained a lot of components. As known, a number of factors contributed to the dielectric constant values in microwave field, such as temperature, power density and space coordinates. In this paper, dielectric constants were considered as fixed values to simplify the complex analysis of liquid products. The oxygen-bearing organic compounds in liquid products had higher dielectric constants, compared with hydrocarbon, whose relative volatility might be improved by microwave irradiation. Low atomic H/C meant low saturation. High unsaturation substances were more favorable to microwave absorption and more likely to generate in microwave pyrolysis since they had higher dielectric constants. The increase of oxygen content and the reduction of the atomic H/C after microwave pyrolysis might be caused by the effect of microwave irradiation on the relative volatility of liquid products which had higher dielectric constants.

Table 1 Elemental composition of Indonesian bitumen before and after pyrolysis(wt%on oil base)
3.4.3.GC–MS analysis
Chemical compositions of liquid products from conventional pyrolysis and microwave pyrolysis were analyzed by means of GC–MS,and more than 40 compounds were identified.To better understand the pyrolysis oil compositions,the detected compounds were classified into four groups[29],i.e.,aliphatic,aromatic hydrocarbons,oxy-organics and others.The percentage contents of component types are shown in Fig.9.The substance with a higher dielectric constant was more likely to obtain a larger amount of energy from the microwaves,and such energy would encourage the substance to escape from the liquid phase to the gas phase,and then condensed,leading to an improvement of relative volatility.In order to evaluate the effect of microwave irradiation for relative volatility,contrast analysis results are given.Aliphatic and aromatic hydrocarbons comprised over 86%of oil sand pyrolysis oil from conventional pyrolysis.This result was in a good agreement with previous studies.The composition of oil from microwave pyrolysis was similar to those from their parents in chemical family,but the concentration was different due to the effect of microwave irradiation.Oil from conventional pyrolysis contained 48.4%of aliphatic hydrocarbons,38.1%of aromatic hydrocarbons and 7.7%of oxy-organics.In general,the dielectric constants of oxy-organics were greater than 10 at 25°C,much larger than the dielectric constants of aliphatic hydrocarbons(less than 2 at 25°C)and aromatic hydrocarbons(less than 4 at 25°C).The relative areas of aromatic hydrocarbons and oxyorganics showed an increase in microwave pyrolysis.This suggested that microwave pyrolysis enhanced the relative volatility of both aromatic hydrocarbons and oxy-organics since they had relatively higher dielectric constants.Moreover,the relative area of aromatic hydrocarbons and oxy-organics in microwave pyrolysis was increased about 2.7%and 4.6%,respectively,compared to the results in conventional pyrolysis.It should be noted that the generation of oxy-organics was much better promoted by microwave irradiation.In oxy-organics,it was polar functions(phenolic hydroxyl and ester)containing oxygen that significantly increased the polarity of liquid products,which led to an increased relative volatility in microwave pyrolysis.This result indicated that microwave irradiation was beneficial for the generation of oxy-organics and aromatic hydrocarbons due to enhancement of relative volatility.

Fig.9.Percentage contents of component types in conventional and microwave pyrolysis oil.
3.5.Gaseous product characterization
The volume percentages of H2,CO,CH4,and CO2of gaseous products determined using GC are given in Fig.10.The composition of the gases from conventional and microwave pyrolysis with carbon as absorber can be explained by the different systems of heating.The gas produced from oil sands pyrolysis was mainly composed of H2and CH4for both CP and MP.After MP,H2and CO contents increased,whereas CH4and CO2contents decreased.It can be inferred that the dry-reforming of hydrocarbons with CO2would be favored during MP,where carbon powder served as catalyst to promote this reaction.

Moreover,it was known that MP favors heterogeneous reactions between the pyrolysis gases and the remnants of coke.The catalytic reaction may therefore have been favored by the MP[30].This would explain the lower CO2and CH4content and the higher H2and CO content in the gases obtained from the MP compared to those obtained by CP at the same final temperature.
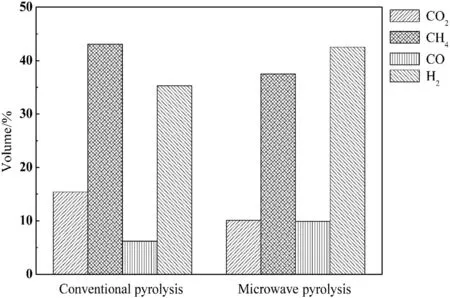
Fig.10.Gaseous component volume percentages in conventional and microwave pyrolysis.
4.Conclusions
In this study,pyrolysis of Indonesian oil sands was investigated by the conventional and microwave-assisted pyrolysis,showing the significant difference in both quantity and quality of the liquid product.It was found that the microwave power density could affect the liquid product yield,i.e.the liquid yield was favored by the low microwave power density.A 19.7%yield was obtained by a power density of 7.5 W·g−1in microwave-assisted pyrolysis,while that of M12.5and M17.5were 18.1%and 15.8%,respectively.A heat–mass transfer model was proposed to explain the difference in the liquid product yield and heavy component content at the same heating rate by two different heating methods.The relative volatility was suggested to be improved during microwave heating process based on the elemental analysis and GC–MS analysis.The content of oxy-organics in microwave pyrolysis was increased by about 4.6%,compared to the results from the conventional pyrolysis,which revealed the existence of a major effect on the substance with high polarity by microwave irradiation.
杂志排行

Chinese Journal of Chemical Engineering的其它文章
- High efficiency production of ginsenoside compound K by catalyzing ginsenoside Rb1 using snailase☆
- Selective aerobic oxidation of p-cresol with co-catalysts between metalloporphyrins and metal salts☆
- Degradation and mineralization of aniline by O3/Fenton process enhanced using high-gravity technology☆
- Three-liquid-phase extraction and separation of V(V)and Cr(VI)from acidic leach solutions of high-chromium vanadium–titanium magnetite☆
- Insight into the degradation mechanism of cefixime under crystallization condition☆
- Experimental and simulation of the reactive dividing wall column based on ethyl acetate synthesis☆