A Heavy Rainfall Event in Autumn over Beijing—Atmospheric Circulation Background and Hindcast Simulation Using WRF
2018-07-23XiangruiLIKeFANandEntaoYU
Xiangrui LI, Ke FAN,3*, and Entao YU
1 Nansen–Zhu International Research Centre, Institute of Atmospheric Physics, Chinese Academy of Sciences, Beijing 100029
2 University of Chinese Academy of Sciences, Beijing 100049
3 Collaborative Innovation Center on Forecast and Evaluation of Meteorological Disasters,Nanjing University of Information Science &Technology, Nanjing 210044
4 Joint Laboratory for Climate and Environmental Change at Chengdu University of Information Technology, Chengdu 610225
ABSTRACT Heavy rainfall events often occur in Beijing during summer but rarely in autumn. However, during 3–5 September 2015, an exceptionally heavy rainfall event occurred in Beijing. Based on the reanalysis data and the Weather Research and Forecasting (WRF) model simulations, the main contributing factors and the predictability of this heavy rainfall event were examined through comprehensive analyses of vorticity advection and water vapor transport/budget. The results indicate that a “high-in-the-east–low-in-the-west” pattern of 500-hPa geopotential height over the Beijing area played an important role. The 850-hPa low-level jet (LLJ) provided a mechanism for rising motion and transported abundant water vapor into the Beijing area. Two-way nested hindcast experiments using WRF well reproduced the atmospheric circulation and LLJ. Quantitative analysis indicates that the WRF model with the rapid update cycle (RUC) land surface scheme and the single-moment 6-class (WSM6) microphysics scheme exhibited the best skill, and the model performance improved with a higher resolution. Further analysis indicates that the bias in the precipitation forecast was caused by the bias in water vapor transport.
Key words: heavy rainfall, WRF model, water vapor supply, autumn, Beijing area
1. Introduction
Beijing, with its complex terrain, generally has a rainy season in summer, with relatively more precipitation in late-July and August, and an annual precipitation of more than 500 mm (Wang J. L. et al., 2012). Heavy rainfall events can cause serious losses of life and damage to property; for instance, the “7.21” heavy rainfall event,which occurred in Beijing on 21 July 2012, caused the deaths of 76 people and incurred substantial adverse economic effects. Considering the level of disaster caused by heavy rainfall events in the Beijing area, researchers have carried out extensive studies from different aspects to investigate the mechanisms involved and the predictability of such events. On the synoptic scale, several studies have focused on the water supply, instability mechanism,and evolution of weather systems (Sun, 2005; Liu et al.,2007; Li and Dolman, 2016). Furthermore, some researchers have analyzed the development and maintenance of rainfall resulted from topographic forcing, the low-level jet (LLJ), gravity waves, and interaction with multiscale systems (Sun, 2005; Chen et al., 2012; Sun J.H. et al., 2013; Wen et al., 2015). As a specific example,Sun J. H. et al. (2013) studied the heavy rain that happened in Beijing on 21 July 2012, and found that this event was caused by different scale weather systems such as vortex, shear line, cold front, and LLJ.
With the development of high-performance computing technology in recent years, the resolution and simulation effects of NWP models have improved markedly.However, the performance of NWP models in forecasting heavy rainfall events depends on a number of factors(Tao and Zheng, 2013; Jiang et al., 2014; Zhu and Xue,2016), such as model configuration, model resolution,quality of the initial conditions, spin-up strategy, and so on. As a specific example, Wang S. Z. et al. (2012) used Weather Research and Forecasting (WRF) model to hindcast a heavy rainfall that occurred in the Yangtze River region during 3–7 June 2011, and found that the model can reasonably predict the features of precipitation. Similarly, Fan et al. (2008) found that the performance of a triple-nesting (27/9/3 km) WRF model in simulating a convective rainfall event was reliable, although further improvements were needed.
The abovementioned studies focused mainly on the heavy rainfall events that occurred in summer, based on analysis of the synoptic situation and the underlying mechanism. On the contrary, few studies have investigated the impacts of the climatological background of the atmospheric circulation to heavy rain events that happen in autumn and whether NWP models can successfully predict heavy rainfall events in autumn over North China.
On 4 September 2015, a heavy rainfall event occurred in Beijing. From 0100 UTC 4 to 0900 UTC 5 September 2015, 26 weather stations observed accumulated rainfall greater than 100 mm. Generally, most heavy rainfall events in Beijing last for 2–6 h (Sun J. H. et al., 2013; Jin et al., 2015; Sun J. S. et al., 2015) and mainly occur in summer. However, this event lasted for about 30 h.Therefore, this event is unusual not only in terms of its duration, but also for its time of occurrence. Regarding this event, Zhao et al. (2016) found that a “low-in-thewest–high-in-the-east” pattern played an important role,associated with the role of the LLJ and shear line.However, more details in terms of the atmospheric background and model simulation skill have yet to be investigated.
The objective for this study is twofold. First, we want to explore the processes and the underlying mechanism for this unusual heavy rainfall event from the perspective of the climate background of atmospheric circulation as well as the synoptic situation. Second, we attempt to investigate the capability of a mesoscale numerical weather prediction model, such as the WRF model, in forecasting such an extreme heavy rainfall event over the Beijing area.
In Section 2, we describe the data and model configuration used in the study. In Section 3, the results from investigating the underlying mechanism and processes of this unusual heavy rainfall are presented, followed by the retrospective forecast results in Section 4. Section 5 is a summary of our key findings.
2. Model, data, and experimental design
Version 3.7 of the Advanced Research WRF dynamic core (Skamarock et al., 2008) was chosen in this study.The WRF model is a non-hydrostatic mesoscale weather prediction system, with high flexibility in its resolution and parameterization schemes. The model simulation domains, named Domain 01, Domain 02, and Domain 03,are outlined in Fig.1. The spatial resolutions are set at 10, 3, and 1 km in a two-way nesting mode. Many previous studies (e.g., Wang et al., 2011) have suggested that using nested domains can lead to a more accurate simulation.
Nine simulations with three land surface schemes and three microphysics schemes (see Table 1) were carried out on the three domains. Previous studies indicate that different choices of microphysics can influence the simulation of precipitation by modulating the structure of temperature and humidity field (Jankov et al., 2005), and the choice of land surface schemes can make significant influences on the precipitation’s simulation (Jin and Miller, 2007). Other schemes used in this study include the Rapid Radiative Transfer Model scheme for longwave radiation, the Dudhia scheme for shortwave radiation, the Yonsei University planetary boundary layer parameterization, and the Noah land surface model with four layers of soil.

Fig.1. Simulation domains and topography (shading; m) for the outer domain (Domain 01), middle domain (Domain 02), and small domain(Domain 03), outlined by the black boxes.

Table 1. Combinations of land surface schemes and microphysics schemes
The NCEP Global Forecast System (GFS) 6-hourly model forecast data (http://www.nco.ncep.noaa.gov/pmb/products/gfs/) with a horizontal resolution of 0.5° × 0.5°are used as initial and boundary conditions for the WRF model experiments. To simulate the whole precipitation process, experiments are run from 0000 UTC 3 to 0000 UTC 6 September 2015. Validation for the forecast is based on the daily ERA-Interim data (http://apps.ecmwf.int/datasets/data/interim-full-daily/levtype=sfc/) on a horizontal resolution of approximately 0.5° × 0.5°, and the hourly precipitation data provided by the China Meteorological Administration, which were collected from 46 surface weather observation stations in Beijing and had been quality controlled with the inconsistent records removed.
We also used the ERA-Interim data to analyze the atmospheric circulation background and the performance of WRF. The vertically integrated water vapor was calculated from the surface to 300 hPa. The vertically integrated moisture flux (Q) can be expressed as

wheregis gravitational acceleration (9.8 m s–2in this study),pt(ps) is the top (bottom) level pressure,qis the relative humility, andVis the wind vector.
In addition, the vertically integrated moisture fluxes across the four boundaries surrounding Beijing were calculated as follows:

Here,λW(λE) represents the longitude of the western(eastern) boundary; andφN(φS) represents the latitude of the northern (southern) boundary, in which the mean radius (a) of earth is 6.37 × 10⁶m. The net moisture flux budget (QT) was calculated by

Vorticity advection (VD) was calculated by

whereδgrepresents the relative vorticity.
The threat score (TS) was calculated as

where NA represents the number of grids that have correct forecasts, NB represents the grids that are falsely predicted, and NC represents the grids that are missing(NC = 0 in this study). Hourly precipitation data at 46 surface weather observation stations in Beijing were used for verification of the model results.
3. Atmospheric circulation background
On 3 September, a strong high-pressure ridge at 500 hPa dominated the high latitudes over Siberia, with a center over northern Baikal, accompanied by a low-pressure trough to its right (Fig.2a). Meanwhile, a small ridge controlled the Beijing area. Accordingly, northwesterly winds prevailed over Beijing, bringing cold and dry air from the high latitudes. At the same time, at 850 hPa, high pressure dwelled over the north of the Beijing area. Meanwhile, dry air with low relative humidity prevailed over Beijing (Fig.2b). In sum, the Beijing’s weather then was fine, referred to as “clear and crisp autumn air,” on 3 September 2015.
On 4 September, the small trough at 500 hPa moved eastwards to a position near Beijing. The atmospheric circulation at 500 hPa exhibited a small high ridge located over the east of the Beijing area and a small low trough over the west of the Beijing area at 500 hPa on 4 September (Fig.3a), which was characterized by a “highin-the-east–low-in-the-west” pattern. Such an atmospheric circulation pattern was favorable for a slow-moving and even stationary low trough (Sun J. H. et al., 2013).

Fig.2. Atmospheric circulation at 0000 UTC 3 September 2015, including geopotential height (contours; gpm), wind vector (m s–1), and relative humidity (shading; %) at (a) 500 and (b) 850 hPa, based on the ERA-Interim data. The black triangle represents the location of Beijing.

Fig.3. As in Fig.2, but at 0000 UTC 4 September 2015.
Correspondingly, at 850 hPa, a closed low-pressure system was generated over Mongolia and North China(Fig.3b) on 4 September, which controlled North China along with southerly wind. Moreover, with the developing and southerly moving flow of this closed low-pressure system at 850 hPa, the north–south pressure gradient became greater, causing stronger winds with speeds of 12 m s–1reaching the criterion of LLJ. As the LLJ was located on the right side of the exit area of the upperlevel jet at 200 hPa (figure omitted), with the axis of the jet located over the area from Shanxi to Gansu provinces,the air converged at low altitude and diverged at high altitude and was very favorable for ascending motion.The LLJ also transported abundant water vapor and caused convergence, resulting in an environment very favorable for the occurrence of heavy rain. A warm shear line was also found (Fig.3b), which had a weak temperature gradient below 850 hPa over Beijing. This shear line was also favorable for ascending motions under the unstable condition
Considering abundant moisture supply is an essential condition for the occurrence of heavy rainfall, we calculated the integrated moisture flux from the surface to 300 hPa (Fig.4). At 0000 UTC 4 September, water vapor was transported from South China to Beijing, leading to abundant moisture in the area. Note that there was an obvious convergence of moisture flux over Hebei Province and the Beijing area.
In addition, the atmospheric stratification also caused a favorable environment for ascending motion during the heavy rainfall event. Figure 5 shows the latitude–height cross-section of pseudo-equivalent potential temperature(θse) along 117°E. At 0000 UTC 4 September, the vertical distribution ofθseshowed an instability between 850 and 700 hPa at 40°N (i.e.,indicates convective instability). Under this unstable condition, the ascending motion appeared and facilitated the overlay of warm air on cold air to further increase the convective instability.The adequate supply of water vapor and unstable convective condition over Beijing favored the occurrence and lasting of the heavy rainfall.

Fig.4. Integrated moisture flux (vectors; kg s–1 m–1) and divergence of integrated moisture flux [shading; kg (hPa m2 s)–1] from surface to 300 hPa at 0000 UTC 4 September 2015, derived from the ERAInterim data. The red dot represents the location of Beijing.
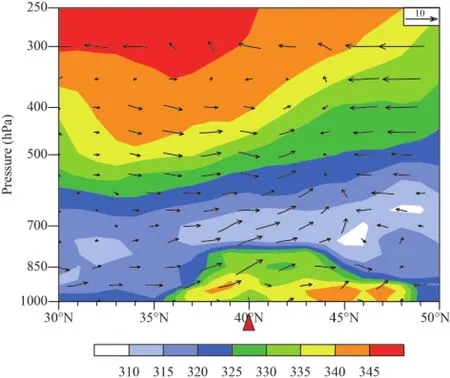
Fig.5. Cross-section along 117°E at 0000 UTC 4 September 2015,showing pseudo-equivalent potential temperature (shading; K) and meridional circulation (vectors; v, m s–1; w, Pa s–1), derived from the ERA-Interim data. The red triangle represents the location of Beijing.
The abovementioned key small low trough over the west of the Beijing area at 500 hPa (Fig.2a) can be traced back to 3 September. To illustrate the development process of the low trough, the vorticity advection at 500 hPa is shown in Fig.6. The results show that the positive VDs dominated over the region ahead of the low trough, whereas negative VDs dominated over the region behind. As a result, the low trough shifted eastwards and intensified (Wang et al., 2013). Meanwhile,according to theωequation, ascending motion will be formed if there is a positive difference of VD between the upper level (500 hPa) and the lower level (850 hPa).At 0000 UTC 3 September, as positive VDs occurred over the region ahead of the trough line (red line) at 500 hPa while negative VDs occurred behind the trough line,the small trough at 500 hPa moved eastwards and reached Hebei (south of Beijing) at 0000 UTC 4 September (black line). Subsequently, a low-pressure system at 850 hPa was formed and influenced Beijing from 1800 UTC 3 to 1200 UTC 4 September.
Based on the above, a schematic illustration of the weather situation for the heavy rainfall event in Beijing is provided in Fig.7. The difference in VD between 500 and 850 hPa led to the development and movement of the small trough at 500 hPa and cyclogenesis at 850 hPa, respectively. As a result, the north–south oriented pressure gradient between the low-level cyclone and subtropical high over the western North Pacific could be further enhanced to strengthen the LLJ. The LLJ transported abundant moisture flux from South China and the western North Pacific over Beijing, where it met cold air derived from high latitudes. In addition, with a low-level warm shear line and the local topography causing strong ascending motion, the heavy rain event occurred over Beijing.
Climatologically, rainfall over Beijing mainly occurs in late-July and early August, and it gradually diminishes after mid-August. Extremely heavy rainfall rarely happens in autumn. Therefore, we speculate that the studied “9.4” extreme rainfall event may be related to the abnormal climate background, such as the atmospheric circulation and water vapor budget conditions.

Fig.6. Vorticity advection (shading; 10–6 s–2) at 500 hPa at 0000 UTC 3 September, derived from the ERA-Interim data. The red(black) line represents the trough line at 0000 UTC 3 (4) September 2015. The red dot represents the location of Beijing.
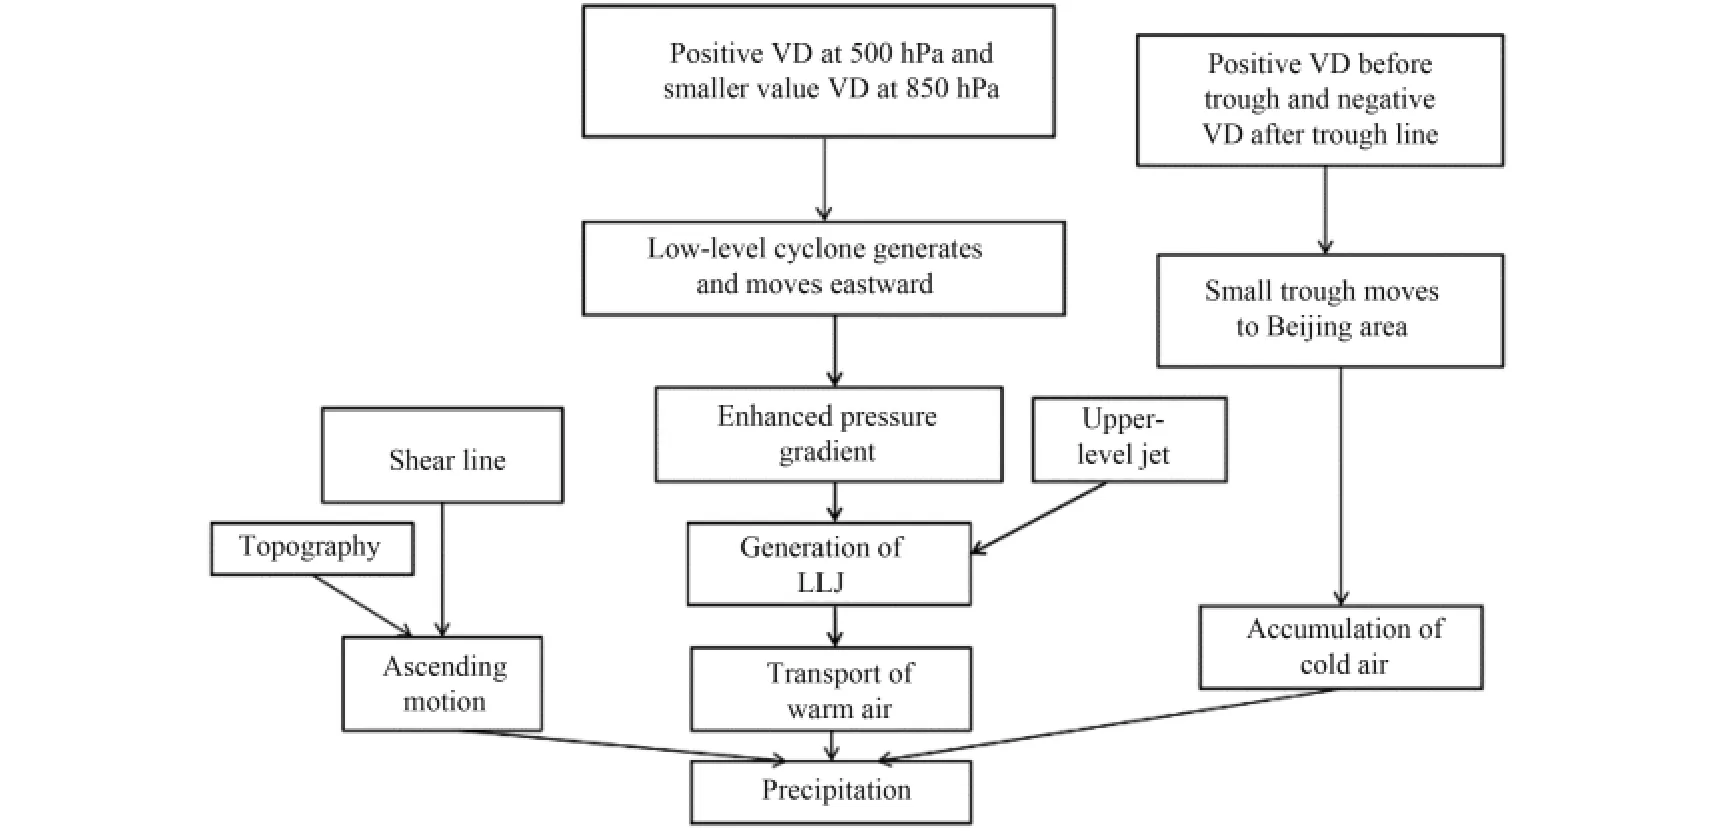
Fig.7. Schematic illustration of the atmospheric circulation background for the heavy rainfall event in Beijing in autumn 2015.
The water vapor transport fluxes at the four boundaries of the Beijing area at 0000 UTC 4 September are shown in Fig.8a, where a positive value of the water vapor transport flux means transport of water vapor into Beijing while a negative value means transport of moisture out of Beijing. The water vapor flux across the western, eastern, northern, and southern boundaries of Beijing was 1.307, 4.501, –1.716, and –2.655 (× 107kg s–1), respectively (Fig.8a). This indicates that the gain in water vapor influx into Beijing came from the southern and western boundaries. The Beijing area was a sink for water vapor as the net budget of water vapor supply over the area was an income of 1.436 × 10⁷kg s–1, eventually leading to a moist environment favorable to the heavy rainfall. Figure 8b depicts the evolution of the water vapor transport from 1800 UTC 3 to 1800 UTC 4 September 2015 (blue line), and the average water vapor budget for 1986–2015 (red line). Apparently, the water vapor budget for the heavy rainfall event was much larger than the corresponding climatological mean. The peak value of the water vapor budget (2.4 × 10⁻³kg m–2s–1) at 0600 UTC 4 September 2015 was nearly 8 times the 30-yr averaged value of 0.3 × 10⁻³kg m–2s–1. Therefore, the abnormal abundance of water vapor transported to the Beijing area caused an abundant water vapor supply for this heavy rainfall event.
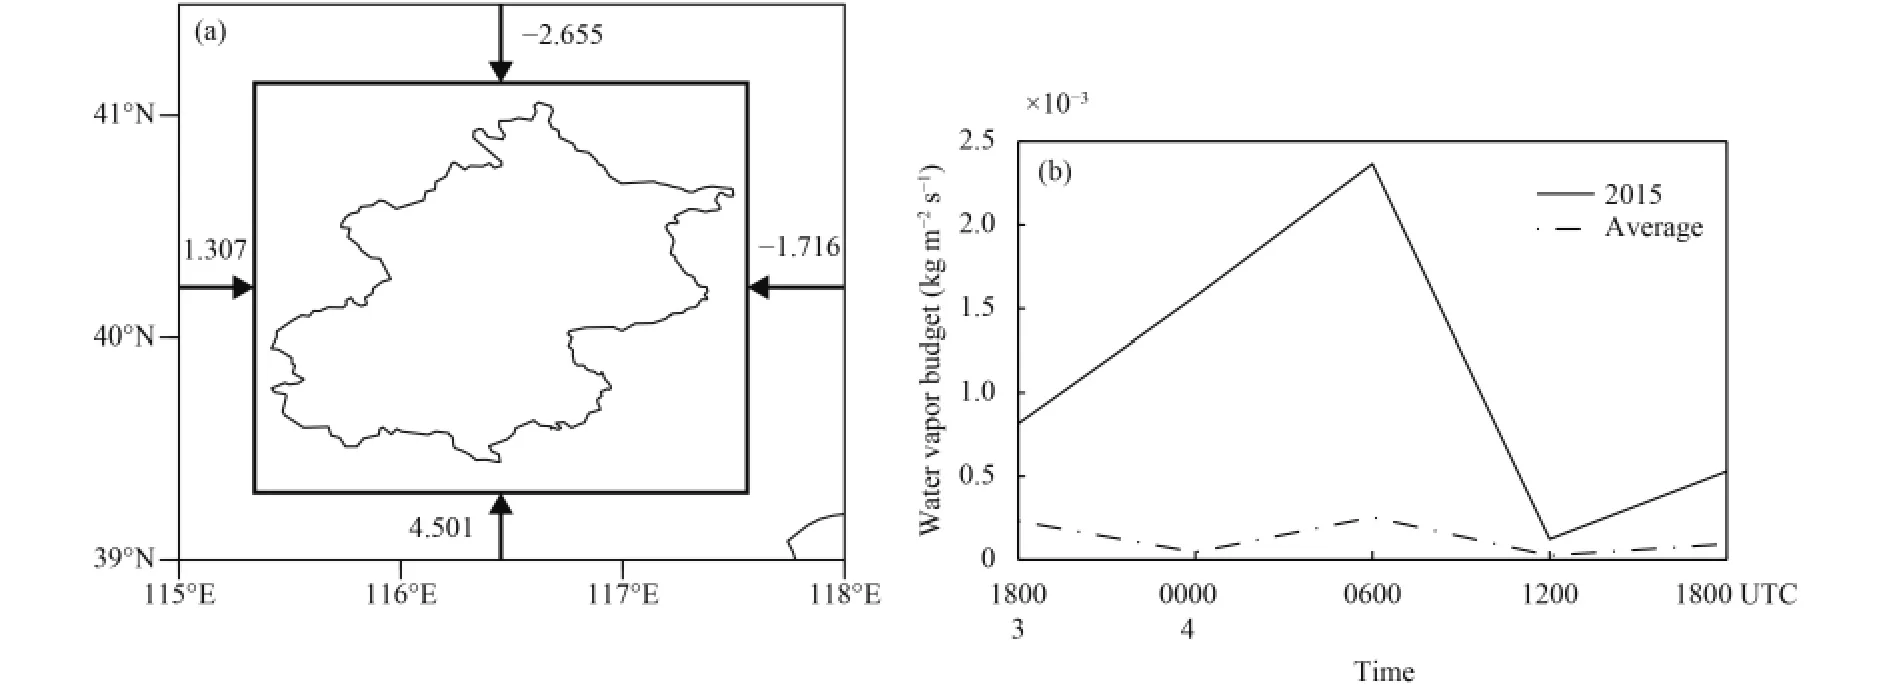
Fig.8. (a) Water vapor transport (107 kg s–1) across the four boundaries of the study region at 0000 UTC 4 September 2015 and (b) water vapor budget (kg m–2 s–1) from 1800 UTC 3 to 1800 UTC 4 September (solid line), along with the average water vapor budget during 1986–2015 (dotdashed line), based on the ERA-Interim data.
But why was so much water vapor transported into Beijing in autumn 2015? We compared the atmospheric circulation before the occurrence of this heavy rain event(average of three days during 1–3 September 2015) with the corresponding 30-yr climatological value (Fig.9). It was found that a significant positive anomaly of geopotential height occurred over the high latitudes, expanding from Baikal to North China, and a negative anomaly occurred over the coast of East Asia, manifesting as a“high-in-the-east–low-in-the-west” pattern. This indicates that the intensities of the high-pressure system and the East Asian trough were much stronger than their climatological means, causing strong cold air advection to the Beijing area via the anomalous northerly wind. On 4 September, with the abovementioned systems shifting eastwards, a negative anomaly formed over Inner Mongolia and North China at 850 hPa. The deepened lowand high-pressure systems together reinforced the prevailing southerly over North China at 850 hPa (Fig.10).As a result, anomalous warm and wet air was transported and advected to Beijing, leading to abnormally wetter and warmer conditions over the area.
The anomalous climate background of this event is depicted in Fig.11. The strong positive anomaly of geopotential height over the high latitudes, expanding from Baikal to North China, and the negative anomaly over the coast of East Asia at 500 hPa, persisted from 1 to 3 September, along with persistent strong advection of cold air to the Beijing area via the northerly wind anomaly.On 4 September, the negative anomaly of the low-pressure system and positive anomaly of the high-pressure system at 850 hPa together caused the southerly wind anomaly. As a result, the anomalous southerly transported warmer and wetter air to the Beijing area, resulting in a positive anomaly of relative humility over the area. As increasingly more cold and wet air and water vapor converged over Beijing, this unusually heavy rain event unfolded.
4. Retrospective forecasts with WRF
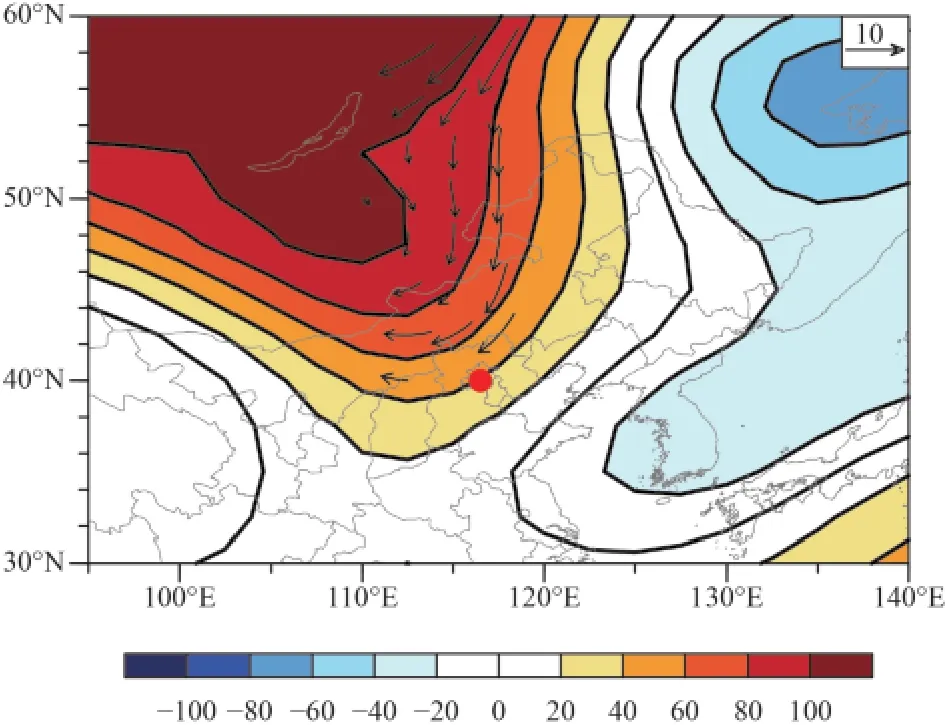
Fig.9. Geopotential height anomaly (shading and contours; gpm) and wind anomaly (vectors; m s–1) at 500 hPa from 1 to 3 September 2015,from ERA-Interim data. The anomaly refers to departure from the 1986–2015 mean, and the red dot denotes the location of Beijing.
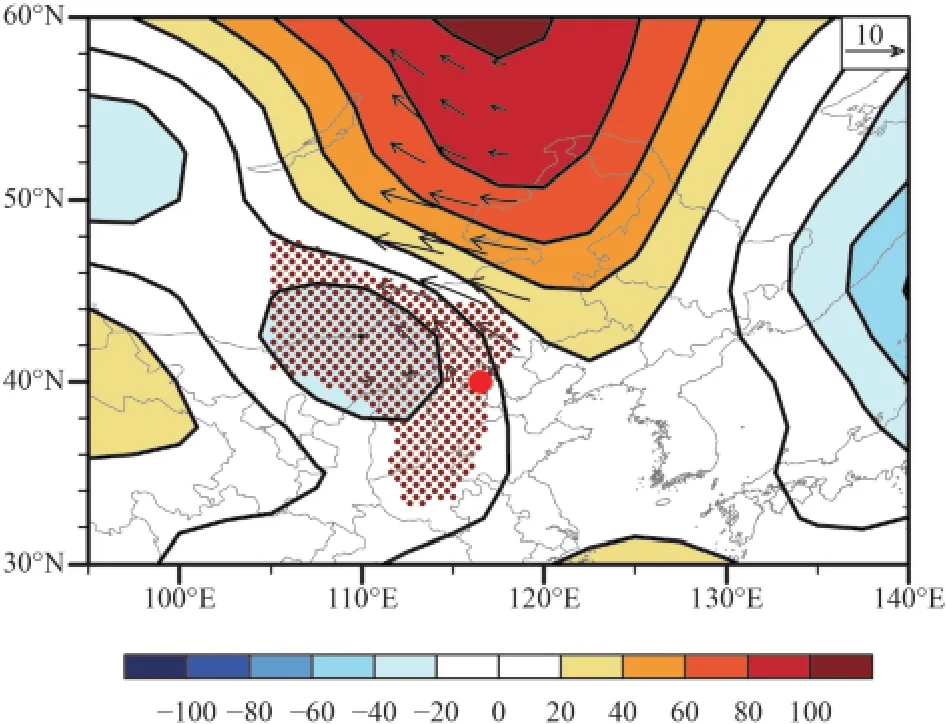
Fig.10. As in Fig.9, but at 850 hPa at 0000 UTC 4 September 2015.The red dotted areas represent positive anomalies of relative humidity(%).
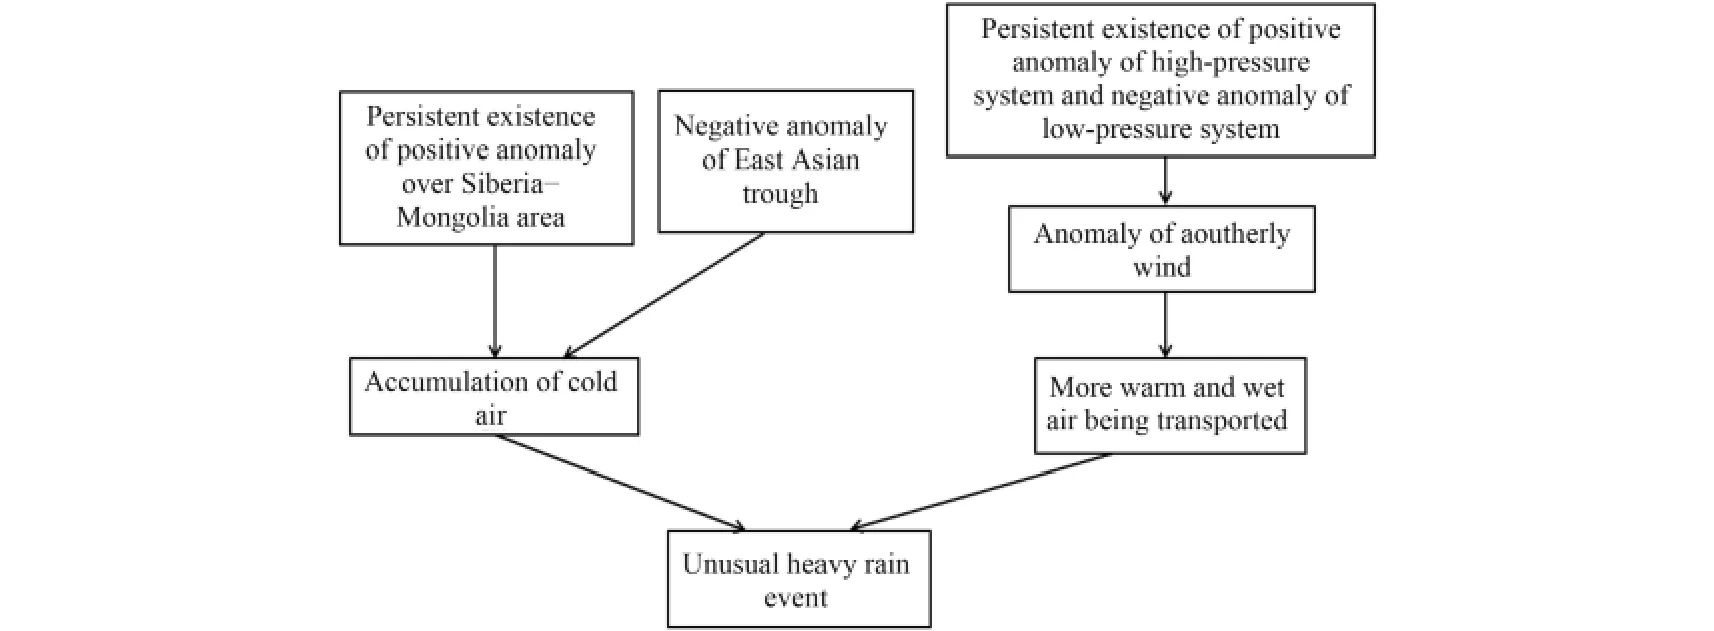
Fig.11. Schematic illustration of the climate background for the “9.4” heavy rainfall in Beijing in 2015.
Next, to what extent the WRF model can simulate this heavy rainfall event was investigated. Before comparing the performance of the WRF precipitation simulations,we chose the stations located within the Beijing area and interpolated the precipitation observations onto a 61 × 61 grid meshes. The main factors contributing to this heavy rainfall event, as simulated by the model, were also analyzed.

Fig.12. (a) Observed and (b) Domain 01-simulated, (c) Domain 02-simulated, and (d) Domain 03-simulated 24-h accumulated precipitation(mm).

Table 2. Spatial correlation coefficients (values passing the 95% confidence level are denoted by asterisks), root-mean-square error, bias, and threat score (TS) between the observed and the Domain 03-simulated 24-h accumulated precipitation
First, we compare the observed rainfall data with the RUC_WSM6 simulation results. The main features of the precipitation distribution in the Beijing area were captured by all three domains (Fig.12) under this physics scheme combination, and the spatial correlation coefficient between Domain 03 and the observation was 0.41(Table 2). The observed 24-h accumulated precipitation from 1800 UTC 3 to 1800 UTC 4 September presented a rain band distributed in the north–south direction, and maximum rainfall of more than 100 mm. The simulation captured this spatial feature, with the precipitation located over northwestern Beijing and a maximum value exceeding 100 mm day–1. However, WRF failed to simulate the rainfall center over southwestern Beijing. Taking the Domain 03 result as an example, the main difference between the observation and the simulation was that the precipitation areas were located in eastern Beijing. The observation presented a relatively large-value area, with average precipitation greater than 30 mm, in the eastern part, whereas the simulations in this part showed a small value with precipitation less than 30 mm. In northeastern Beijing, the observation was much higher than the simulation. Another obvious difference was that, in the observation, there was an obvious north–south oriented maximum-precipitation region, comprising three maximumvalue centers; the largest region, with the maximum exceeding 100 mm, was located in the south, and the other two were located in northern Beijing; the Domain 03 result, however, showed that the model failed to simulate the largest area located in the south, and there was a near northeast–southwest oriented precipitation band. Overall,while the model can capture the main feature of the precipitation distribution, bias was found in its reproduction of the location and amount of the precipitation center.
Comparing the results over the three domains finds that there were obvious differences between Domain 01 and the other two domains. The values of precipitation simulated by Domain 01 were generally smaller than the observed, so was it in the other two simulations. Domain 01 simulated a precipitation amount smaller than 30 mm in most parts of Beijing, except the two precipitation centers, where it showed values larger than 35 mm. The other two domains showed better model performance in both a better simulated maximum-value center location in the north of Beijing and a maximum precipitation amount of larger than 70 mm. Although both the results of Domain 02 and Domain 03 failed to reflect accurately the location of the precipitation center, the maximum value simulated by Domain 03 was more reasonable than that of Domain 01. Thus, it is inferred that the model skill in terms of the precipitation forecast improved with increased spatial resolution.
Figure 13 describes the results of RUC_WSM6 simulations, ensemble mean simulations, and the observed precipitation. The distributions of precipitation in RUC_WSM6 and ensemble mean are similar. The locations of the largest value center are also similar. But there are biases with the observed. The model results have a large value center of precipitation in Guangxi Region while the observations do not show this center. The same situation can be found in Domain 02. The model results wrongly simulated two large-value centers of precipitation in Shanxi Province and Inner Mongolia Region of China. But the ensemble mean results missed the largestvalue center in the Beijing area and Hebei Province while the RCU_WSM6 results successfully simulated this center. In the situation of Domain 03, the RCU_WSM6 results also have a better distribution of precipitation than the ensemble mean results.
Next, a quantitative analysis of model performance among the different scheme combinations was conducted to investigate the influence of the physical parameterization schemes on the simulation results. Taking the Domain 03 results as an example, Table 2 shows the results for all combinations. It was found that there were large differences between the different schemes. Among all combinations, RUC_WSM6 (RUC land surface scheme and WSM6 microphysics scheme) showed the best skill,with a spatial correlation coefficient of 0.41 and a TS score of 046. For the ensemble mean, the spatial correlation coefficient was 0.47, but the ensemble mean failed to reproduce the precipitation center, and the model bias was larger than that of RUC_WSM6. Thus, in the following analysis, we only show the result of RUC_WSM6.
The results reported in the above highlight that there were some biases between the observation and model results. Thus, a simple investigation on circulation and water vapor budget was conducted next. Figure 14a shows the simulation of geopotential height and wind circulation at 500 hPa on 3 September 2015. Comparing the reanalysis with simulation reveals that the Domain 01 simulation captured the main factures of the slow-moving circulation. Both the pattern and magnitude of geopotential height were reproduced well. The ridge and trough at 500 hPa at 0000 UTC 3 September were successfully simulated, and the circulation and relative humility at 850 hPa were also captured by WRF. The model reproduced the geopotential height and wind over the whole domain well. Both the pattern and magnitude were also successfully simulated.
Figure 15 presents the simulated circulation at 0000 UTC 4 September. The “high-in-the-east–low-in-thewest” pattern was reproduced well by the model. The small trough was behind the small ridge, causing the cold air and the warm air advection into the Beijing area. The wind fields at 500 hPa were also captured well by the model. In short, the model successfully captured the large-scale circulation patterns.
Additionally, the distribution of 850-hPa geopotential height and wind are also shown in Fig.15b. The lowpressure system over the northwestern part of Beijing was captured well. But a small high-value center east of the Beijing area (Fig.14b, 15b) appeared in the simulation but not in the reanalysis data. The LLJ had a large influence on the convergence and water vapor transport,and this was reproduced by the model. However, the model underestimated the LLJ with less strength than the observed. Furthermore, in the Beijing area, there was a small area of large values in the reanalysis wind data that the simulation did not capture. This may be a factor related to the precipitation bias.

Fig.13. The (left) Domain 01, (middle) Domain 02, and (right) Domain 03 simulated precipitation under (top) the RUC_WSM6 scheme combination and (middle) the ensemble mean, in comparison with (low) the observed 24-h accumulated precipitation (mm).
The distributions of geopotential height and wind were simulated reasonably well by the model. To reveal the model skill in simulating the event’s dynamic process,vorticity advection and instability conditions are shown in Fig.16. In Fig.16a, the distribution of VD was similar to that of the reanalysis. There were positive VD ahead of the low trough line and negative VD at the rear of the trough line. Figure 16b shows the distribution ofθsesimulated by the model. The unstable area between 850 and 700 hPa at 40°N was successfully reproduced. However,the value ofθsebetween 500 and 850 hPa was smaller than in the reanalysis, and there was a large-value area with a maximum value greater than 335 K that the model failed to produce. In this unstable stratification area, the weak ascending motion was generally captured by the model, but the velocity of the wind was smaller than in the reanalysis.
In summary, the model successfully simulated the main systems of influence that caused this heavy rainfall event. The “high-in-the-east–low-in-the-west” pattern,the 850-hPa LLJ, and the warm shear line were reproduced well. The distributions of vorticity advection andθsewere also successfully captured. The difference that may have caused the bias in the simulated precipitation was probably the location and magnitude of the LLJ,which influenced the transport of water vapor into the Beijing area.

Fig.14. WRF simulated atmospheric circulation at 0000 UTC 3 September 2015, including geopotential height (contours; gpm), wind vector(m s–1), and relative humidity (shading; %) at (a) 500 and (b) 850 hPa. The black triangle represents the location of Beijing.

Fig.15. As in Fig.14, but at 0000 UTC 4 September 2015.

Fig.16. WRF simulated (a) vorticity advection (shaded; 10–6 s–2) at 500 hPa and (b) cross-section along 117°E of pseudo-equivalent potential temperature (shaded; K) and meridional circulation (vectors; v, m s–1; w, Pa s–1) at 0000 UTC 4 September. The black slanted line in (a) denotes a trough. The black dot in (a) and the red triangle in (b) represent the location of Beijing.
Although the main circulation systems were captured well by the model, an important factor that caused bias in simulating this heavy rainfall event was water vapor supply. Figure 17 shows the simulated integrated moisture flux. Compared with the reanalysis data, the model systematically underestimated the amount of water vapor supply. Although the model successfully simulated the main path of moisture flux, the magnitude was grossly underestimated. A serious underestimation of water vapor supply by the model was located over the southwest of the Beijing area (see Table 3). The observed maximum water vapor budget appeared at 0600 UTC 4 September;however, in the simulation, a negative water vapor budget appeared over the Beijing area, and the bias was quite large. As a result, the water vapor supply over Beijing was reduced to some extent, and this lesser supply of water vapor led to less precipitation, which was an important factor causing the precipitation bias in the simulation.

Fig.17. As in Fig.4, but from the WRF simulation.
5. Summary
During 3–5 September 2015, an exceptionally heavy rainfall event occurred over Beijing, China. Additionally,this extreme heavy rain event occurred in autumn, which is unusual. Thus, it was necessary to understand the key processes involved in this event, as well as its predictability by using numerical weather prediction models. First,we analyzed the atmospheric circulation background and weather conditions to understand the mechanism involved. Then, we used the WRF model to run retrospective hindcasts of the event to understand the level of predictability. The main conclusions are as follows.
(1) In this event, the main system of influence was the“high-in-the-east–low-in-the-west” pattern at 500 hPa,which refers to a small trough in the west of the Beijing area and a small ridge in the east. The 850-hPa low-pressure system, warm shear line, and LLJ were also important systems for this event. These systems together set up a favorable environment. The distribution of vorticity advection on 3 September caused the small trough at 500 hPa to move eastwards and reached Beijing at 0000 UTC4 September. The difference in vorticity advection between 850 and 500 hPa led to the development of the lowpressure system at 850 hPa. With the development and movement of the low-pressure system at 850 hPa, an LLJ formed and transported abundant water vapor, providing abundant moisture supply to the heavy rainfall.

Table 3. Water vapor budget of the observed and WRF simulated results (10–3 kg m–2 s–1), and the ratio of observed to simulated water vapor budget over the Beijing area from 1800 UTC 3 to 1800 UTC 4 September. The maximum value of the ratio is in bold
(2) Studies on the climatological anomalies found that there were a positive anomaly located in Mongolia at 500 hPa and a negative anomaly in the east on 3 September.Consequently, the north wind anomaly brought more cold and dry air to Beijing. On 4 September, as this southerly wind anomaly at 850 hPa brought more and more warm and wet air, the positive anomaly of relative humidity concentrated over there. Consequently, the water vapor budget over Beijing was many times more than the 30-yr average; this may be the reason why this heavy rainfall event happened.
(3) The hindcast experiment results indicate that the WRF model was generally successful in forecasting this event, especially with respect to the simulation of geopotential height and wind, as well as the vorticity advection.However, the distribution of precipitation was reproduced by the WRF model with some bias, in which the model primarily showed an underestimation—especially over southern Beijing. Different scheme combinations and spatial resolutions had a different influence on the model performance. The RUC_WSM6 scheme combination showed the best skill, and the model performance improved with a higher resolution. Water vapor budget analysis showed that it was the bias in water vapor transport that caused the bias in precipitation.
In the hindcast experiments, the uncertainty in the precipitation forecast was still large, and the results showed obvious biases compared with the observation. These aspects require additional investigation through further experiments.
Acknowledgments.The authors thank Professor Hui Gao at the National Climate Center of the China Meteorological Administration and the anonymous reviewers for helpful comments.
杂志排行
Journal of Meteorological Research的其它文章
- Near-Term Projections of Global and Regional Land Mean Temperature Changes Considering Both the Secular Trend and Multidecadal Variability
- Influences of the 11-yr Sunspot Cycle and Polar Vortex Oscillation on Observed Winter Temperature Variations in China
- Influence of Springtime Atlantic SST on ENSO: Role of the Madden–Julian Oscillation
- Impact of 10–60-Day Low-Frequency Steering Flows on Straight Northward-Moving Typhoon Tracks over the Western North Pacific
- Using a Hidden Markov Model to Analyze the Flood-Season Rainfall Pattern and Its Temporal Variation over East China
- Effect of Mesoscale Land Use Change on Characteristics of Convective Boundary Layer:Semi-Idealized Large Eddy Simulations over Northwest China
