Experimental Investigation on Motion Responses and Sectional Wave Loads of a Moored Semi-submersible in Deepwater
2018-06-27XIONGLingzhiYANGJianminKOUYufengWEIHandiZHANGZeyu
XIONG Ling-zhi,YANG Jian-min,KOU Yu-feng,WEI Han-di,ZHANG Ze-yu
(State Key Laboratory of Ocean Engineering,Shanghai Jiao Tong University,Shanghai 200240,China)
0 Introduction
As the exploitation of oil and gas resources steps into ever deeper waters,the application of semi-submersibles have become more prevalent due to its excellent hydrodynamic response.Semi-submersibles(SEMIs)are considered to be exposed to harsh environment often and to withstand extreme environmental loads.Therefore,it is crucial to have an accurate prediction of the SEMIs’motions,internal sectional forces and the mooring line tensions for the sake of safety.
Oo and Miller[1]discussed different perspectives of the heave motion and responses of dif-ferent types of SEMIs’ design based on Morison’s equation.Pinkster and Huijsmans[2]investigated the SEMI’s first-order oscillation motions and mean second-order forces and moments through experiment and compared them with the results calculated by the near-field method.Incecik et al[3]quantified the influence of various design parameters and analysis methods on the motion responses of a SEMI.Zhang et al[4]carried out an experiment on a SEMI with truncated mooring system to investigate its motion performances in different environment conditions.The corresponding SEMI model with full depth mooring system was built up in the commercial software.The comparison between experiment results and numerical results demonstrated that the maximum mooring line tensions could not match due to the dissimilarity of the mooring line’s dynamic responses during truncation.Yang et al[5]carried out both numerical and experimental studies to investigate the low-frequency response of a semi-submersible’s vertical motions.It is concluded that the low-frequency response will be significant due to the slowly varying wave drift force.Matos et al[6]studied the wave induced resonant motions of SEMIs in heave,roll and pitch.In the research,different models were established to calculate the second-order hydrodynamic forces and induced motions.The results were compared to those measured in wave basin tests.It is considered that the methodology proposed in the study is suitable for preliminary design.Shan et al[7]conducted both experimental and numerical studies on a drilling SEMI to obtain the air gap and external wave loads when the model was fixed and moored.Zhang et al[8]proposed three different design wave methods,including deterministic method,stochastic method and long-term response method,to calculate the wave loads of a deep-water SEMI.Priyanto et al[9]utilized the Weibull distribution to estimate the wave run-up for SEMIs and conducted experiment to validate the numerical simulations.Bai et al[10]carried out model tests to investigate the Vortex Induced Motions(VIM)of a deep draft SEMI platform.Conclusions show that the VIM in sway direction is predominant and the response amplitude depends on not only the current directions but also the reduced velocity.
Numerous experiments have been conducted to investigate the performance of SEMIs.However,the wave loads in the SEMI’s longitudinal mid-section are seldom measured or recorded during the experiment.The wind,wave and current loads in storm can induce the SEMI’s extreme responses and internal loads that endangers the human’s life,facilities on the SEMI or even the SEMI itself.In the present study,a comprehensive experimental investigation is conducted to obtain the motion responses,mooring line tensions and the internal loads at the SEMI’s longitudinal mid-section.
1 Experimental setup
To investigate the wave loads and motion response of the SEMI,an experiment program was carried out in the State Key Laboratory of Ocean Engineering(SKLOE)of Shanghai Jiao Tong University.The basin is 50 m in length,40 m in width and 10 m in depth.The water depth can be adjusted from 0 to 10 m.The scale ratio between the model and the prototype is 1:60.Fig.1 illustrates the SEMI moored in the basin.
Tab.1 shows the main particulars of the SEMI.Six DOF motion responses of the SEMI were tracked and recorded by a non-contact optical motion capture system at the reference point(center of gravity,COG).Force transducers and accelerometers were utilized to measure the mooring line tensions and the acceleration of the SEMI respectively.Particularly,to measure internal loads in the longitudinal mid-section,the SEMI body was divided into two parts at the longitudinal mid-section.Three six-component force sensors were assembled to connect the two parts,two of which were located in the deck.And the third one was inserted into a transverse brace.Fig.2 shows the detailed configuration of the six-component force sensors.

Fig.1 Setup of the SEMI moored in the basin

Tab.1 Main particulars of the SEMI
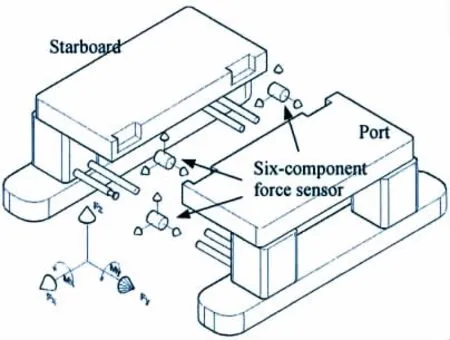
Fig.2 Configuration of the six-component force sensors
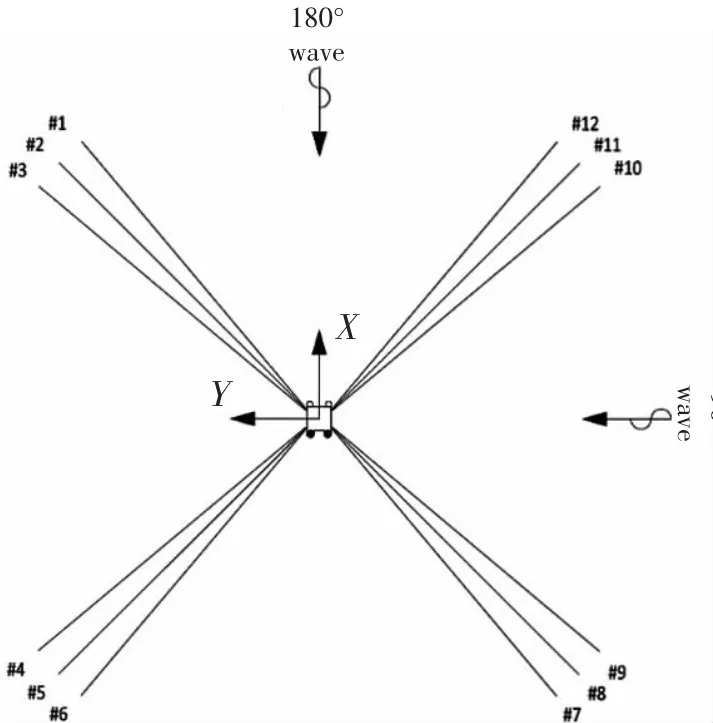
Fig.3 Mooring configuration of the SEMI

Tab.2 Truncated mooring line properties
The SEMI is moored by 12 mooring lines,which are divided into 4 clusters,as shown in Fig.3.The operation water depth is 1 500 m in the South China Sea.Due to the limited conditions in the basin,the mooring lines were truncated to a water depth of 588 m,correspond-ing to 9.8 m in the experiment.The truncated mooring line properties are tabulated in Tab.2.
2 Wave calibration and static tests
Waves were calibrated prior to the model tests.Three irregular waves,the white noise wave(WHN)and ten regular waves were employed in the test.The extreme wave,corresponding to a 100-yr return period wave in South China Sea,was generated by a typical JONSWAP spectrum with Hs=13.3 m,Tp=15.5 s and a peakedness parameter of 3.3.Calibration results are presented in Fig.4.The wave test cases considered in the experiment are showed in Tab.3.The sampling frequency is 25 Hz in the model scale and the time duration of each irregular wave test case is approximately 23.5 min corresponding to 3 hours in prototype.

Fig.4 Target and measured wave spectra

Tab.3 Wave cases considered in the experiment
Static tests,including static offset tests and free decay tests,should be conducted to verify the modeling.This is the basic requirement for the regular and irregular wave tests.The comparison between the measured data and the target value is shown in Fig.5.

Fig.5 Static offset stiffness curve of mooring system
Free decay tests were conducted in calm water to obtain the natural periods and linear damping coefficients of the 6 DOF.The decay of surge,sway and yaw was conducted with the mooring system while the other 3 DOF was conducted without the mooring system.Results are presented in Tab.4.The natural periods of roll,pitch and heave are away from the encountered wave period in the South China Sea,which can avoid the resonant motions.However,significant resonant motions in surge and sway direction can be excited by the second-order difference wave forces.It is widely considered that the linear damping can reduce the resonant motions significantly.The main contributions of the damping are hull viscous damping,wave drift damping and mooring line damping.

Tab.4 Results of free decay test
3 Results and discussion
3.1 Motion response
The motion response transfer function(Response Amplitude Operator,RAO)can be obtained from the white noise wave test and regular wave test.Four horizontal lines were used to moor the SEMI in order to avoid the effects of mooring line damping.As a matter of comparison and validation,numerical simulations were conducted as well in the commercial software HydroD.Fig.6 illustrates the comparison results.The surge,pitch and heave RAOs are derived from 180°incident wave,while the sway,roll and yaw RAOs are from 90°incident wave.Excellent agreement has been achieved,which means that both the experiment and the calculation can obtain reliable results.
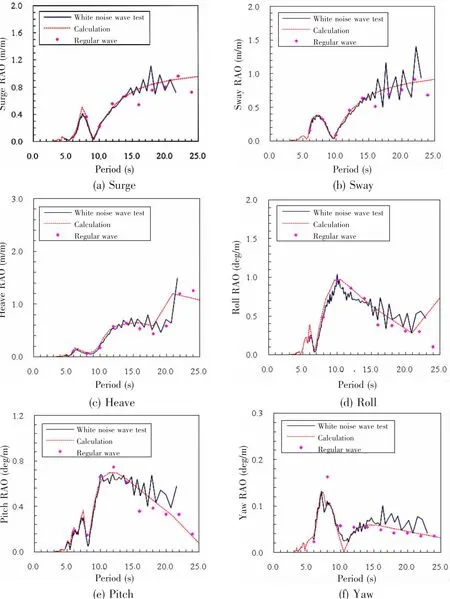
Fig.6 Comparison of RAO between experiment and calculation
The roll and pitch RAO curves reach their peaks at a wave period of 10 s and 12 s,respectively.The wave period is less than half of the natural period.This is because the incident wave will be superimposed,at the area between two pontoons,by the radiation wave and diffraction wave which are caused by the SEMI’s port part and starboard part.It is observed in the experiment that when the regular wave period is 10 s and incident angle is 90°,the superimposed wave will be enhanced due to the distance between the pontoons meet with the wave’s characteristic length.In return,the wave force would impose on the SEMI and stimulate a larger roll motion.The similar phenomenon of pitch can be observed when the regular wave period is 12 s and incident angle is 180°.
For surge and sway motions,when the wave period increases from 5 to 10 s,the RAO will increase to a peak value at wave period of 7.5 s and then it will decrease to nearly zero at wave period of 10 s.When the wave period is larger than 10 s,the RAO will monotonously increase with the period’s increase.
3.2 Wave load transfer function
The longitudinal and transversal mid-section suffer the shear force (Fl),separation force(Fs),the vertical bending moment(Mx)and the longitudinal bending moment(My).The forces were recorded during the experiment.In order to investigate the wave loads on the section,sensors were balanced prior to the test to eliminate the component induced by the weight and the buoyancy.The wave load transfer functions at 120°incident wave are illustrated in Fig.7.
As shown in Fig.7,the transfer function of Fl,Fsand Mymatches well between the experiment and the calculation,while transfer function of Mxshows a slight difference.But the difference is acceptable.It is shown in Fig.7 that all the transfer functions reach to their peak value when the wave period ranges from 8 to 12 s.For the Fl,the load transfer function has two peaks,corresponding to the period of 6.2 s and 10.3 s.All the wave load transfer functions tend to be zero when the wave period is larger than 25 s,which means that the low-frequency long waves and the different frequency waves seem to have little influence on the sectional loads.
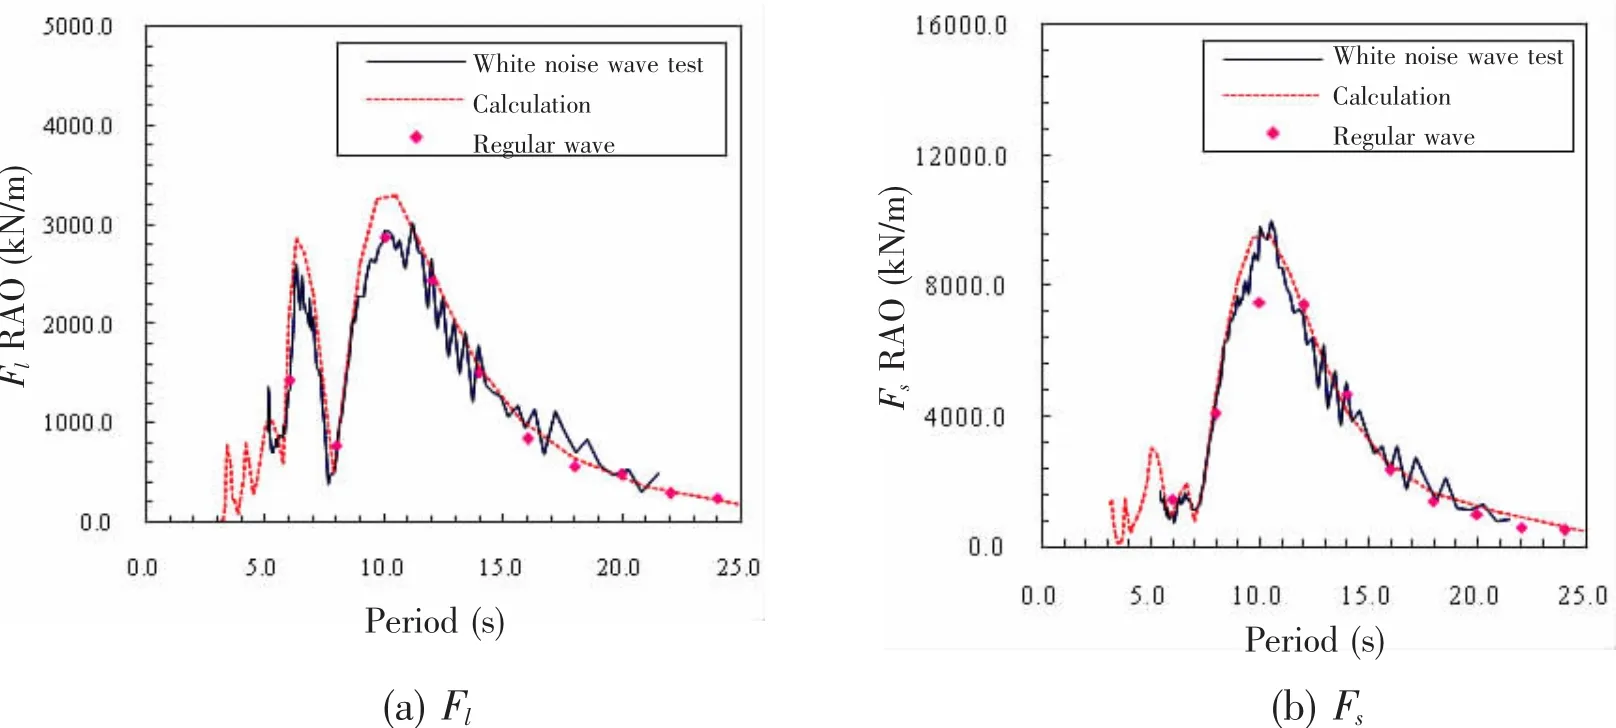
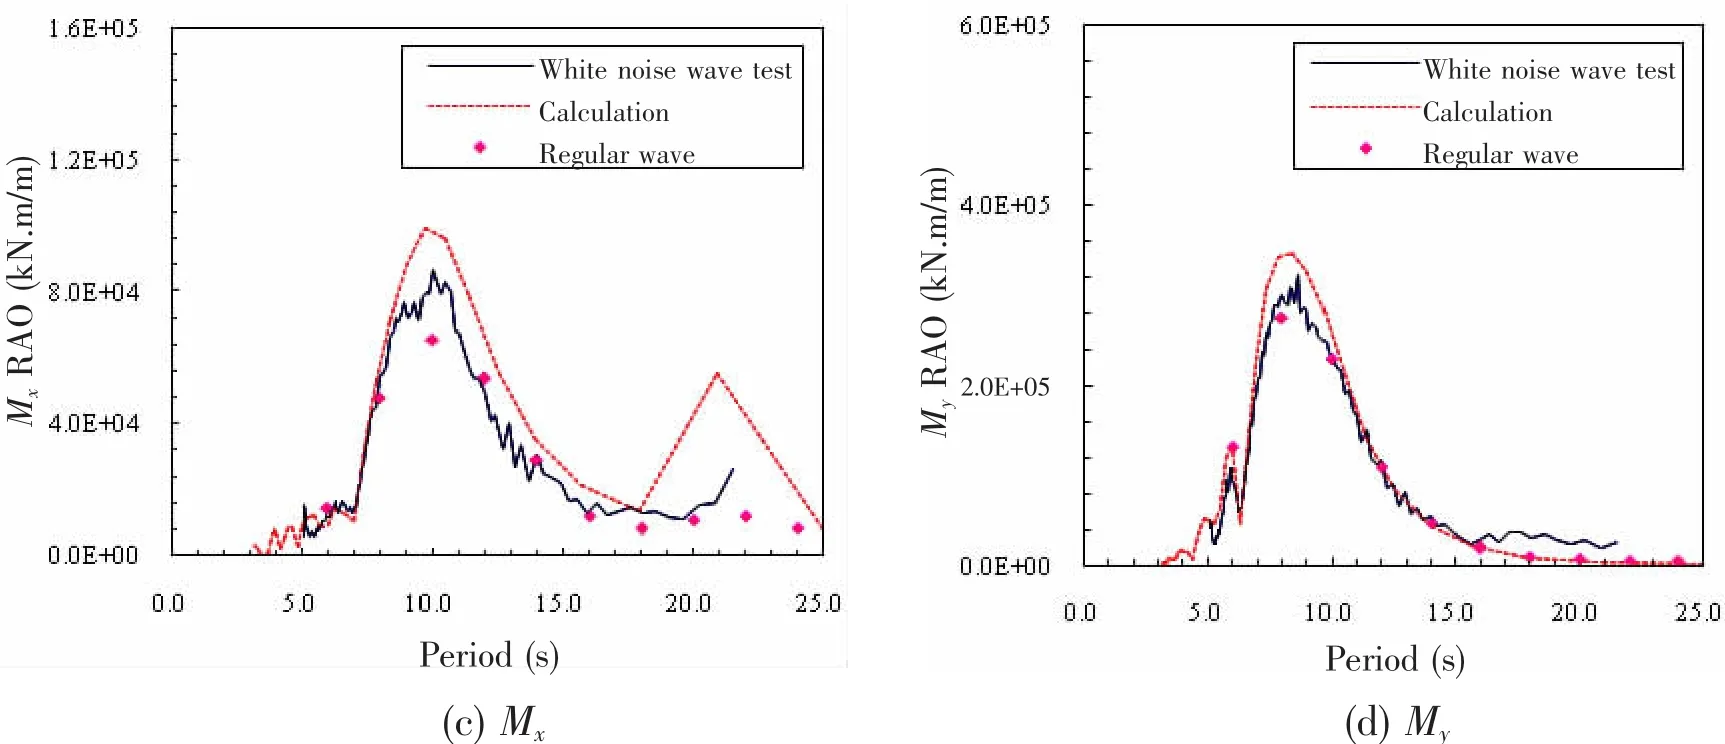
Fig.7 Wave load transfer function at longitudinal mid-section
3.3 Motion statistics in irregular wave
The SEMI’s motion responses and wave loads were investigated in irregular waves to have a comprehensive understanding of the SEMI’s characteristics.Two random sea conditions have been investigated in this study.Case 1 is the wave only condition and Case 2 employs the wave in Case 1 and combines it with collinear steady current(Vc=1.97 m/s)and wind(Vw=55 m/s).A 100-yr return period wave spectrum was selected to generate the encountered wave in the South China Sea.

Tab.5 Motion responses in irregular wave
The statistics of motion responses in extreme conditions is tabulated in Tab.5,wheremaxrepresents the maximum absolute value,the absolute significant value,the absolute mean value and Astdthe standard deviation value.
Although the mooring system is symmetric about the x and y axes,the maximum surge motion in Case 1 at 180°incident angle is 81.60 m and much larger than the sway motion(49.37 m)at 90°incident angle.This is due to the fact that the first-order wave excitation forces in surge direction are larger than those in sway motion.However,when the SEMI is exposed to the combined wave,wind and current loads,the surge at 180°incident angle is close to the sway motion at 90°incident angle.
The heave motion statistics in different incident wave angles are close.It means that the heave motion is not sensitive to the incident wave angle.The maximum heave motion is 9.98 m in Case 1 and 10.23 m in Case 2.
The roll and pitch motion shows a similar response to the extreme wave.For example,in Case 1,when the incident angle is 135°,the maximum roll is close to the maximum pitch,while the absolute significant roll and the standard deviation of roll are slightly larger than those of the pitch.The roll motion in Case 1 at 90°incident angle and the pitch motion at 180°incident angle are at the same level(9.47°and 9.29°,respectively),and vice versa.
Motion responses contributed by the wind and current can be obtained by the comparison between Case 1 and Case 2.It is noted that the wind and current have little influence on the wave-frequency motion(roll,pitch and heave).For the low-frequency motion(surge,sway and yaw),the contributions of the wind and current outweigh those of the wave.Taking the surge motion as an example,the SEMI drifts 80.60 m,47.67 m and 4.46 m corresponding to the incident angle of 180°,135°and 90°while 192.32 m,122.59 m and 25.81 m in Case 2.The extreme surge and sway motion in Case 2 has exceeded the distance of 10%water depth and reached up to 12.82%and 13.23%,respectively.
The response spectra present the distribution of the energy,as illustrated in Fig.8.It is shown that the energy of the three horizontal plane motion concentrates in the low-frequency area,while the energy of the three vertical plane motion focuses in the incident wave frequency area.


Fig.8 Response spectra in Case 2
The low-frequency different frequency wave components in deep water can cause large motions in the horizontal plane motion.In the surge and sway spectra,there is a peak at the frequency of 0.4 rad/s.Although the peak is relatively small,the fairlead’s wave-frequency motion will magnify the mooring line damping by a factor in the range of 2-4[11],thus significantly reducing the SEMI’s resonant motion and hence peak line tensions.
3.4 Wave loads statistics in irregular wave
The longitudinal mid-section is vulnerable and of great concern due to the wave loads in extreme wave condition.The maximum and significant wave loads are presented in Tab.6.It should be noted that the SEMI’s weight and buoyancy are eliminated.The following discussions focus on the sectional force induced by the irregular wave,steady wind and current.
The maximum and significant shear forces induced by the environmental loads at 180°and 90°incident angles are relatively small when compared with those induced by at 135°incident angle.The maximum Fsand Mxoccur at 90°incident angle and the value is 8 345.0 MT,63 437.5 MT·m in Case 1 and 8 664.0 MT,64 379.8 MT·m in Case 2.The maximum Myis 113 720 MT·m and 144 543.8 MT·m at 90°incident angle.

Tab.6 Wave loads in irregular wave
It is revealed that with the appearance of the wind and current,the maximum and significant wave loads will increase.However,the influence is limited except for the maximum Flat 180°incident angle and maximum Fsand Mxat 135°incident angle.The growth reaches up to 127.07%,51.87%and 45.77%,respectively.
3.5 Mooring line tensions
The relatively high failure rate of mooring systems is increasingly concerned in offshore industry.It is reported by Ma et al[12]that more than 20 mooring incidents occurred from 2001 to 2011 and many cases were involved with mooring line broken in extreme condition.
The mooring line tensions in Case 1 are presented in Tab.7.The ratio between the maximum mooring line tension and the line’s broken strength is denoted by λ.The maximum mooring line tension occurred at Line#11 at 135°incident angle and the ratio λ is 24.3%.
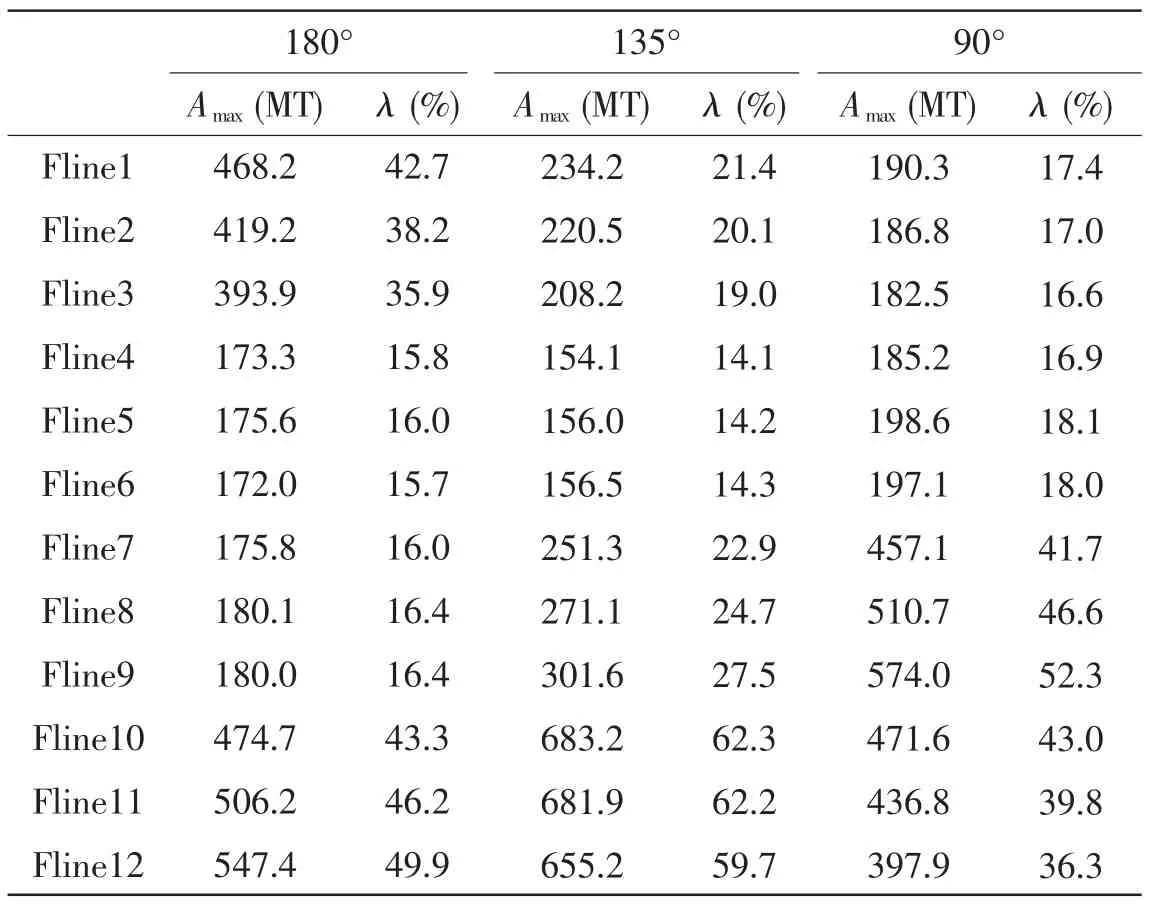
Tab.8 presents the mooring line tensions in Case 2.Fig.9 shows the time series of mooring tensions in Line#10.It is noted that the mooring tensions grow fast with the appearance of the wind and current.The most loaded line is Line#10 and Line#11 with the ratio λ of 62.3%and 62.2%.It nearly reaches to the limitation of offshore standards,66.6%.The reason for the fast growth of the mooring tensions is that the steady wind and current can be considered as a constant force acting on the SEMI.Therefore,mooring line tensions increase to prevent the SEMI from drifting away and keep it at a new equilibrium position.

Tab.7 Mooring line tensions in Case 1
Tab.8 Mooring line tensions in Case 2

Fig.9 Time series of tensions in line#10(Case 2,135°)
4 Conclusions
A comprehensive experimental investigation to a typical semi-submersible has been conducted in the present study.The characteristics of the SEMI’s motion responses,wave loads in the longitudinal mid-section and the mooring line tensions have been clarified.Some conclusions can be drawn and summarized as follows:
(1)The experiment results agree well with the calculated data,validating the reliability of the experiment.
(2)There exists a peak in the roll and pitch RAO curve at the wave period of 10 s and 12 s while the roll and pitch natural periods are 26.5 s and 28.2 s.This is induced by the wave component that is superimposed of the radiation wave,diffraction wave and incident wave at the area between two pontoons.
(3)The low-frequency long waves and the different frequency waves seem to have little influence on the sectional loads.
(4)The wind and current loads have little influence on the wave-frequency motion(roll,pitch and heave)but significantly influence the low-frequency motion.And the influence of the wind and current to the low-frequency motion outweighs that of the wave.
(5)With the appearance of the wind and current,the maximum and significant wave loads increase.The maximum shear force,the separation force and the vertical bending moment in the longitudinal mid-section increase 127.07%,51.87%and 45.77%,respectively.
[1]Oo K,Miller N.Semi-submersible design:The effect of differing geometries on heaving response and stability[R].1976.
[2]Pinkster J,Huijsmans R.The low frequency motions of a semi-submersible in waves[C].In Proceedings of the 3rd International Boss Conference,MIT,1982:447-466.
[3]Incecik A,Wu S,Soylemez M.Effect of different mathematical models in calculating motion and structural response of offshore platforms[C]//In Proceedings of the 3rd Intl.Symposium on Integrity of Offshore Structures.Glasgow,UK,1987:115-125.
[4]Zhang W,Yang J M,Hu Z Q,et al.The experimental and numerical analysis for a deep-water semi-submersible platform[J].Journal of Shanghai Jiao Tong University,2007,41(9):1429-1434.
[5]Yang L J,Xiao L F,Yang J M.Low-frequency response of vertical motions of a semi-submersible[J].Ocean Engineering,2010,28(2):1-7.
[6]Matos V L F,Simos A N,Sphaier S H.Second-order resonant heave,roll and pitch motions of a deep-draft semi-submersible:Theoretical and experimental results[J].Ocean Engineering,2011,38(17-18):2227-2243.
[7]Shan T B,Yang J M,Xin L,et al.Experimental investigation on wave run-up characteristics along columns and air gap response of semi-submersible platform[J].Journal of Hydrodynamics,Ser.B,2011,23(5):625-636.
[8]Zhang C Y,Liu J,Bai Y B.Study on design wave methods of calculating the wave loads of a deep-water semi-submersible platform[J].China Offshore Platform,2012,27(5):34-40.
[9]Priyanto A,Maimun A,Kader A,et al.Probability distribution of wave run up and dynamic response on a large volume semi-submersible[J].Ocean Engineering,2014,76:52-64.
[10]Bai Z N,Xiao L F,Cheng Z S,et al.Experimental study on vortex induced motion response of a deep draft semi-submersible platform[J].Journal of Ship Mechanics,2014,18(4):377-384.
[11]Huse E,Matsumoto K.Mooring line damping due to first-and second-order vessel motion[C].In Offshore Technology Conference,1989:135-148.
[12]Ma K T,Shu H,Smedley P,et al.A historical review on integrity issues of permanent mooring systems[C].In Offshore Technology Conference,2013:OTC-24025-MS.
杂志排行
船舶力学的其它文章
- Experimental Study on Interaction of Low Cycle Fatigue and Accumulative Plastic Damage of AH32 Steel in Uniaxial Cyclic Loading
- A Probability Distribution Model for SCFs in Multi-planar Circular Hollow Section DT-joints Subjected to Axial Loading
- A Preliminary Study on the Buoyancy Materials for the Use in Full Ocean Depth Manned Submersibles
- Low-Cycle Dwell-Fatigue Life and Failure Mode of a Candidate Titanium Alloy Material TB19 for Full-Ocean-Depth Manned Cabin
- Seakeeping Prediction of SWATH with Three Dimensional Translating-pulsating Source Green Function
- Analysis of Effective Height of Green Water Loading for Tension Leg Platform Based on Statistical Process Control
