Interannual Variability of Late-spring Circulation and Diabatic Heating over the Tibetan Plateau Associated with Indian Ocean Forcing
2018-06-20YuZHAOAnminDUANandGuoxiongWU
Yu ZHAO,Anmin DUAN∗,3,and Guoxiong WU
1 State Key Laboratory of Numerical Modelling for Atmospheric Sciences and Geophysical Fluid Dynamics,Institute of Atmospheric Physics,Chinese Academy of Sciences,Beijing 100029,China
2 University of Chinese Academy of Sciences,Beijing 100049,China
3 Collaborative Innovation Center on Forecast and Evaluation of Meteorological Disasters,Nanjing University of Information Science and Technology,Nanjing 210044,China
1.Introduction
Monsoons originate from the thermal contrast between the land and ocean.The Asian Summer Monsoon(ASM)is the strongest and one of the most complicated monsoon systems in the world.The Indian Ocean serves as an important source of energy and moisture for the ASM and has consequently received much attention in studies focused on its interannual variability.Yang et al.(2007)pointed out that the Indian Ocean Basin Mode(IOBM)functions as the signal capacitor of El Niño and that it can influence the Northwest Pacific Anticyclone through a Gill–Matsuno-type response,strengthening the South Asian High.Although the IOBM can be affected by many other factors,it has been accepted as the response pattern of El Niño(Li et al.,2008b;Wu et al.,2009;Xie et al.,2009;Huang et al.,2011).More specifically,the winter phase-locked El Niño–Southern Oscillation(ENSO)influences the ASM mainly by prolonging the IOBM.Regardless of other factors that might change the interannual variability of the IOBM,the ASM can be significantly influenced by the IOBM during the spring and summer(Liu and Duan,2017).
A key feature of the ASM is its role in nearby large-scale orography;namely,for the Tibetan Plateau(TP),which is located in the eastern subtropical region of Eurasia.The effects of mechanical and thermal forcing from the TP on the general circulation and ASM have been well documented(Yeh,1950;Flohn,1957;Li et al.,2001;Wu et al.,2011).In particular,the air column over the TP changes from an atmospheric heat sink in the winter to a heat source in the spring,with the dominant contribution involving land surface sensible heating(SH)(Ye and Gao,1979;Yanai and Li,1994;Zhao and Chen,2001).Huang(1985)pointed out that,under ideal conditions,the TP heat source can markedly influence East Asian circulation.Wan and Wu(2007)suggested that persistent spring rain over southeastern China results from mechanical and thermal effects of the TP.As the effect of TP heating can last from spring to summer,SH in late spring is closely related to summer precipitation anomalies in eastern China(Duan et al.,2005).
Despite the fact that numerous studies have been devoted to the effects of TP thermal forcing(Luo and Yanai,1983,1984;Abe et al.,2005;Duan and Wu,2005;Wu et al.,2007,2015;Lee et al.,2015),little attention has been paid to factors that control variability in diabatic heating over the TP.For example,the Arctic Oscillation is thought to be the main source of anomalous southerly winds observed over the southwestern region of the TP in winter(Gong and Wang,2003).Li et al.(2005,2008a)showed that temperature variability in early spring is connected with the North Atlantic Oscillation(NAO)event of the preceding winter.Moreover,the NAO is also considered to be responsible for much of the precipitation variability over the plateau at the interannual timescale(Liu and Yin,2001).Cui et al.(2015)found that the North Atlantic sea surface temperature anomaly(SSTA)in early spring(March to April)can change the wind speed and circulation over the TP through the eastward propagation of Rossby waves,and thus influence the in-situ SH variability.Based on a different method applied to reanalysis data,Jin et al.(2016)proposed that the TP heat source might be influenced by the decaying ENSO and wave train triggered by the Indian Ocean SSTA.Hu and Duan(2015)further investigated the relative contribution of the summertime IOBM and TP thermal forcing to the interannual variability of the East Asian Summer Monsoon(EASM)circulation system,and concluded that both TP thermal forcing and the IOBM help to enhance the EASM,with the former being more important with regards to the main rainfall belt.Given the substantial changes in background circulation through the spring–summer period across the ASM region,it is worth exploring the dominant controlling factors shaping circulation and diabatic heating over the TP on a month-by-month basis.
This paper is organized as follows:In section 2,the data and methods of analysis used in the study are briefly introduced.Based on statistical analyses of observations and reanalysis data,section 3 discusses the potential mechanism through which the IOBM influences the TP heating.In section 4,a corresponding numerical experiment is performed to illustrate this interpretation.Finally,in section 5,a summary is presented and potential limitations of the present work and avenues of future research are discussed.
2.Data and model
2.1.Data
The data used in this study are as follows:
(1)Meteorological observations at 73 stations over the TP collected by the China Meteorological Administration(CMA).Variables such as surface air temperature,ground surface temperature and wind speed at 10 m above the surface are included(Duan and Wu,2008).Quality-control procedures have been applied to eliminate erroneous data and to ensure homogeneity.
(2)Based on high-quality data from 2472 stations over China,a high-resolution(0.5◦×0.5◦)precipitation dataset provided by the National Meteorological Information Center of the CMA(Zhao et al.,2014;Zhao and Zhu,2015)is used.
(3)Monthly sea surface temperatures(SSTs)collected by the Hadley Center(Rayner et al.,2003),with a resolution of 1.0◦×1.0◦.
(4)Variables such as temperature,wind,humidity,radiation flux and cloud amount from the Modern-Era Retrospective Analysis for Research and Applications(MERRA)(Rienecker et al.,2011),with a resolution of 1.25◦×1.25◦.These data are employed to support our analysis of circulation,moisture transportation and radiation.The above datasets cover the period 1980–2014.
(5)Cloud cover data of the International Satellite Cloud Climatology Project(ISCCP)and radiation flux from the Global Energy and Water Cycle Experiment(GEWEX)surface radiation budget satellite radiation datasets.Both datasets cover 1984 to 2007,with horizontal resolutions of 2.5◦×2.5◦and 1◦×1◦,respectively.More information on these data can be found at http://isccp.giss.nasa.gov/projects/flux.html and https://eosweb.larc.nasa.gov/project/srb/srb_table.
Following Duan and Wu(2008),the Atmospheric Heat Source(AHS)is calculated as:

in which the Sensible heating(SH)is estimated using the bulk aerodynamic method:

whereC pis the specific heat of dry air at constant pressure;ρ is air density,which decreases exponentially with increasing elevation;CDHis the drag coefficient for heat;V0is the mean wind speed measured at 10 m above the ground;andTs−Tais the difference between surface temperature and air temperature.A drag coefficient ofCDH=4×10⁻³is chosen for the TP,following Li and Yanai(1996)and Wang et al.(2012).
Latent heat release(LH)is estimated from the precipitation rate(Pr)using

whereLw=2.5×10⁶J kg−1is the condensation heat coefficient.
The net radiation flux of the air column(RC)is obtained from

whereR∞andR0are the net radiation values measured at the top of the atmosphere(TOA)and at the surface,respectively.VariablesSandFdenote shortwave and longwave radiation fluxes,respectively,where the superscripts↓and↑represent downward and upward transport of the radiation flux,respectively.More specifically,F0andF∞denote the longwave radiation fluxes at the surface and at the TOA.
As this study focuses on interannual variability,and the EASM is an unstable nonlinear system,the Complete Ensemble Empirical Mode Decomposition with Adaptive Noise(CEEMDAN)high-pass filter(Torres et al.,2011)is applied to the data to eliminate any interdecadal trend.First,CEEMDAN is applied to continuous monthly data,as recommended by Wu et al.(2008),and the period of each Intrinsic Mode Function(IMF)is determined.IMFs with a period longer than 108 months are then filtered out,and the interannual signal of the original data is obtained by adding up all the remaining IMFs.The ensemble amount in this study is 500,and the standard deviation of the Gaussian random noise is 0.2,following Torres et al.(2011).
2.2.Model
The atmospheric general circulation model(AGCM)employed in this study is the Finite-volume Atmospheric Model of IAP/LASG(Institute of Atmospheric Physics’State Key Laboratory of Numerical Modeling for Atmospheric Sciences and Geophysical Fluid Dynamics),abbreviated as FAMIL(Zhou et al.,2012,2015;Yu et al.,2014).The resolution of FAMIL in this study is C48(1.875◦×1.875◦;about 200 km),and 32 vertical levels are used,with the top level at 2.16 hPa.The physical parameterizations of this model are consistent with the description in Hu and Duan(2015).
3.Relationship between TP thermal forcing and the Indian Ocean SSTA
From a climatological perspective,SH is the dominant component of the TP heat source during March and April,being as large as 60 W m−2(Fig.1,red curve),compared to an LH of 10–20 W m−2(Fig.1,green curve).However,accompanied by the advent of the rainy season on the southeastern TP,LH reaches 40 W m−2,which is a considerable amount.Comparing the variance of SH(Fig.1,red bars)and LH(Fig.1,green bars),it is noticeable that the variance of LH is much greater in May than in March and April.In fact,the variance of SH is as large as 3.52 times that of LH in March,but in May it is only 1.38 times that of LH(bar chart in Fig.1).It is therefore evident that May is a transitional month,during which the relative importance of SH decreases as LH becomes gradually more dominant.This is implied by both the climatic mean and the variance,as shown in Fig.1.Based on the above,we may infer that the mechanism of external factors influencing the TP heat source might change through March to May.
3.1.The IOBM and TP SH
For the seasonal-mean case,the spring AHS over the TP depends mainly on SH,so in this section we firstly investigate the relationship between the ocean and SH and attempt to provide a plausible explanation.
Simultaneous correlation coefficient maps of monthly SH and SSTAs show that the distribution of highly correlated areas differs significantly between March–April and May(Figs.2a–c).In March,the North Atlantic SSTA is closely related to SH.This phenomenon has been thoroughly discussed in Cui et al.(2015),in which an eastward propagating Rossby wave was proposed to be the bridge connecting the zonal wind speed over the TP with the tripole SSTA pattern over the North Atlantic.It is worth noting that there is no obvious signal over the Indian Ocean in March and April.However,when it comes to May,a high correlation area appears over the Indian Ocean and presents an IOBM warming pattern.Though the Pacific Ocean presents an ENSO-like correlation pattern in May,as Yang et al.(2007)and Xie et al.(2016)point out,ENSO impacts the ASM mainly through the capacitor effect of the IOBM.In fact,a numerical experiment performed by Wu and Liu(1992,1995)illustrated that the ASM region’s response is much stronger to a 2-K Indian ocean SSTA than to an East Pacific 4-K SSTA,which illustrates the significance of the IOBM.
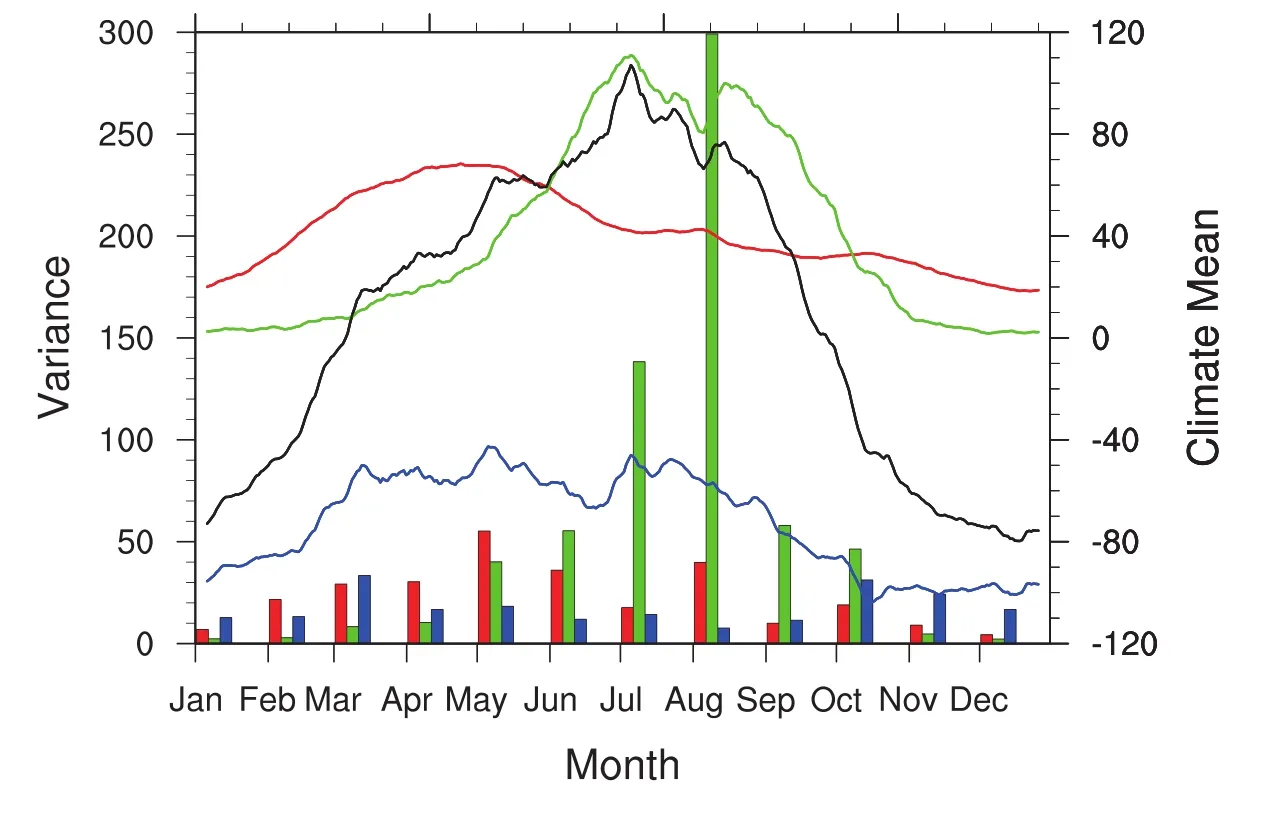
Fig.1.Climatic mean(solid line;units:W m−2)and monthly variance(bars)of each component of the TP heat source,determined by averaging observation data for 73 stations.Red denotes SH,green denotes LH,blue denotes RC,and black gives their sum.
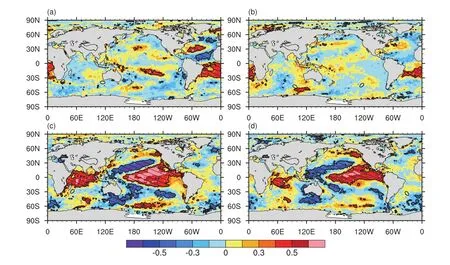
Fig.2.(a–c)Simultaneous correlations between the monthly SH and SSTA in March,April and May.(d)Correlations between the SH in May and SSTA in February.Slashed areas indicate statistical significance above the 95%confidence level.
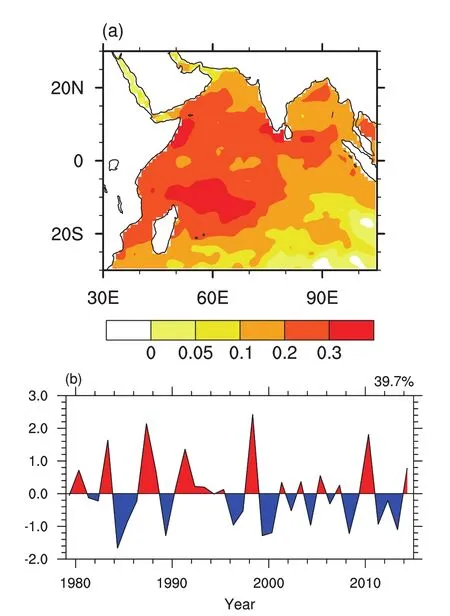
Fig.3.Leading EOF of the Indian Ocean(20◦S–20◦N,30◦–105◦E)SSTA in May(a)and the corresponding principle component(b).
Due to the large thermal inertia of sea water,the IOBM maintains strong persistence over intraseasonal timescales(Liu and Duan,2017).As the correlation distribution between the SH in May and SSTA in February closely resembles the simultaneous correlation pattern between the SH and SSTA in May,it is clear that the SSTA signal leads the SH for several months.In fact,when the SSTA leads the SH over the TP by between one and six months,the correlation distribution only varies marginally.Since Klein et al.(1999)proposed the IOBM as the response mode of ENSO,it is largely a consensus that the IOBM is mostly controlled by ENSO on the interannual timescale.Consequently,the IOBM is considered to influence the SH over the TP rather than the other way around.On the other hand,as mentioned above,along with the abrupt change in the climatological background circulation( figure shown in the supplementary material),the amount of LH becomes considerable in May.It is surely the case that abundant precipitation changes the surface temperature and leads to less solar radiation arriving at the plateau surface,which will have a substantial impact on the in-situ SH.
The IOBM index adopted in this study is the time series of the first empirical orthogonal function(EOF)of the Indian Ocean SSTA(20◦S–20◦N,30◦–105◦E)in May(Fig.3).The leading EOF mode(Fig.3a)and the correlations in Fig.2c share the same basic pattern.Although the leading mode is referred to as the IOBM,emphasizing its uniformity of variation,minor gradients still exist over the basin,reflecting the inhomogeneous change of the SSTA.
The IOBM and SH calculated from the observational data show positive correlations at most of the stations over the TP in May(Fig.4a),especially over the southeastern TP.To investigate which variable is most heavily impacted by the IOBM in this SSTA–atmosphere connection,all the variables in the defining function of SH are analyzed(Fig.4).The results show that surface wind speeds are well correlated with the IOBM,and that they show a similar correlation distribution over the TP.In addition,both surface temperatures and air temperatures exhibit significantly positive correlations over the southeastern TP.Although the land surface temperatures and air temperatures may both possibly arise during a positive IOBM phase,their differences show a much weaker relationship with the IOBM.In the following section,the response of the precipitation over the TP to the IOBM is investigated to shed light on the temperature-rise phenomenon.

Fig.4.Correlation between the indices of the IOBM and(a)SH,(b)10-m wind speed,(c)the difference between surface temperature and air temperature,(d)surface temperature,(e)air temperature,and(f)LH,in May.Circles in(a–e)indicate stations,and dotted areas in(f)indicate areas passing the 95%confidence level.The outline of the TP is shown by the 2000-m black contour line.Shading in(a–e)denotes the topographical altitude.

Table 1.Correlation coefficients and linear regression explained variance between the IOBM and observed variables over the TP in May(significance over 95%confidence level is indicated by double asterisk).
In May,the correlation coefficient between the average wind speed over the 73 stations within the TP and the IOBM index is 0.37(significant at the 95%confidence level,more details are shown in Table 1),and the corresponding explained variance is 13.7%.However,the correlation coefficient relating to the difference between surface temperatures and air temperatures is only 0.11,with an explained variance of 1.2%.Although the surface temperatures and air temperatures are closely correlated with the IOBM over the southeastern TP region,stations in other regions exhibit weaker correlations(Figs.4d and e),and thus the overall correlation is not high enough to pass the 95%confidence level of the Student’st-test.Therefore,considering the TP as a whole,SH is mainly influenced by the IOBM through wind speed changes.Comparing the climatological zonal winds over the TP,we find that in March and April a strong westerly jet travels across the south side of the TP(Figs.5a and b),cutting off the effects of the IOBM and transporting signals from upstream(e.g.,the Atlantic Ocean SSTA)(Cui et al.,2015).However,in May the TP is dominated by weaker and north-shifted westerly winds traveling across the subtropics(Fig.5c).Coincidentally,the IOBM-correlated zonal winds exhibit enhanced westerlies in the subtropical latitudes(20◦–45◦N),especially over and to the south side of the TP.On top of the background westerlies in May,anomalous winds associated with the IOBM(Fig.5d)explain the overall increases in wind speed shown in Fig.4b.
Cui et al.(2015)proposed that,during February–March–April,SH over the TP is mainly controlled by the SSTA tripole pattern in the North Atlantic,and their experiment showed that an eastward-propagating Rossby wave originating from the tripole SSTA region may change the wind field over the TP.These trends do not contradict the results presented here if we compare their relative importance as time progresses from March to May.Following Cui et al.(2015),a North Atlantic SST tripole index(NA_TRI)is defined.Correlation analysis is applied using the monthly data,and the results are presented in Table 2.In March,the correlation between the IOBM and SH over the TP is−0.12,explaining only 1.4%of the total variance of SH.However,the correlation between NA_TRI and SH over the TP is 0.31(significant at the 95%confidence level),and explains 9.6%of the total variance.This result complements those of Cui et al.(2015).In May,however,the correlation between NA_TRI and SH drops to−0.05,i.e.,they are barely related to each other.Conversely,the IOBM plays a much more important role than NA_TRIin May.The correlation between the IOBM and SH over the TP is 0.44,exceeding the 99%confidence level according to the Student’st-test,which explains 19.3%of the variance.Spatial variations in the correlation at each station over the TP(Fig.4a)provide more detailed information about the IOBM’s impact.April shows only a weak connection with NA_TRI,which can be regarded as a transitional month,as can also be concluded from Fig.2b.The influence of the ocean on SH over the TP in spring therefore varies from month to month.
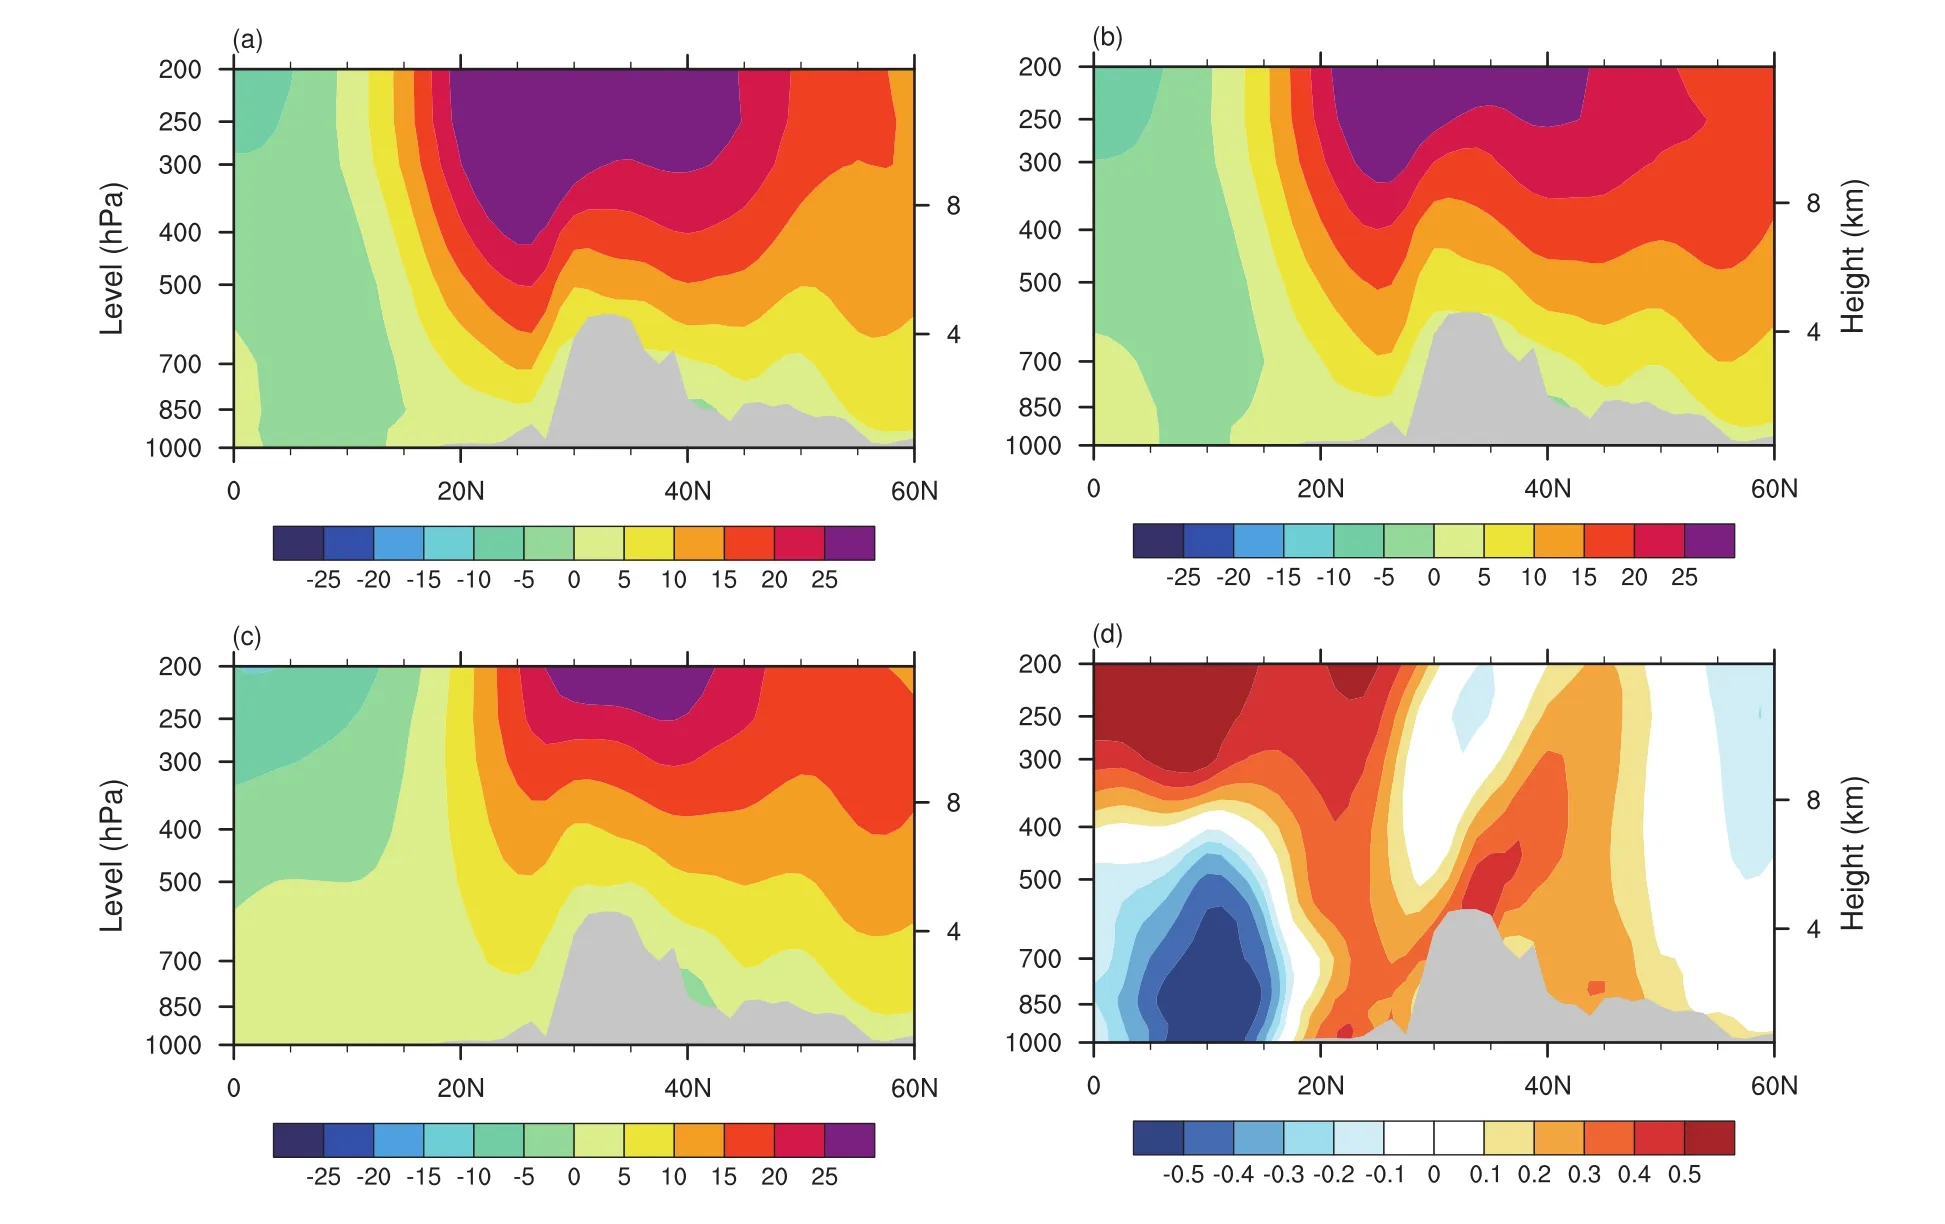
Fig.5.Climatological zonal wind(units:m s−1)averaged over 90◦–100◦E in(a)March,(b)April and(c)May.(d)Correlation between the IOBM and the zonal wind averaged over 90◦–100◦E in May.

Table 2.Correlation coefficients between SH over the TP and the IOBM/NA_TRI,and the corresponding explained variances,in March–May(significance over the 90%and 95%confidence level is indicated by a single and double asterisk,respectively).
3.2.The IOBM and TP LH
The preceding section describes the positive correlation between the IOBM and SH over the TP,and it is noted that the IOBM might reduce the precipitation over the TP in May.In this section,the potential mechanisms involved are investigated further.
Firstly,surrounding circulation related to the IOBM exhibits an anomalous current of ascending air over the southwestern Indian Ocean at the 850 hPa,500 hPa and even 200 hPa level(Figs.6a–c).Conversely,a descending branch is observed over the southeastern TP.The IOBM-induced circulation reduces the ascending current over the southeastern TP,and water flux divergence is enhanced over the TP(Fig.6d);a reduction in LH over the TP is therefore justifiable.Moreover,the anomalous circulation generated by the IOBM seems to oppose the background monsoon circulation.At the 850-hPa level,an anomalous easterly flow travels across the North Indian Ocean,conflicting with the climatological background southwesterly winds in May.At the 200-hPa level,a cyclone develops over the northwestern part of the Indian Peninsula,diluting the South Asian High in the upper troposphere.
Generally,the IOBM-induced circulation can be summarized as an anomalous Hadley cell circulation through which rising air from the southwestern Indian Ocean moves poleward in the upper troposphere,descending over the southern TP and returning near the surface.Due to the Coriolis effect,the northward flow in the upper troposphere is deflected to the east and the returning flow in the lower troposphere is oriented westward(Fig.6).Based on the climatological zonal and meridional wind speeds at 200 hPa and 850 hPa,the wind direction over the South Asian Monsoon(SAM)region,as defined by Wang and Ho(2002),is calculated.It is found that the angle of the Hadley cell is roughly 43◦–59◦from the north.To develop an intuitive understanding of this anomalous circulation,an area with a 45◦slant from the north is selected(green box in Fig.6b),and the vertical wind profile is regressed on the IOBM index(Fig.6e).From this,it is possible to identify an eastward-tilted meridional circulation with ascending air between 5◦S and 10◦S,northward flow at 200 hPa,and descending air between 20◦N and 30◦N.Feng et al.(2013)investigated the Indo-Pacific Warm Pool and found that in spring it can affect the Hadley cell,mainly in a zonally averaged asymmetric mode.Characteristics of this asymmetric mode include air ascending at roughly 10◦S and air descending between 5◦N and 15◦N,echoing the results presented here.Wu and Yeh(2010)also discussed this asymmetric structure and proposed that it can be attributed to the evolution of differential heating over the Indian Ocean.
In relation to the onset of the ASM,the results presented here are consistent with other relevant studies.For example,Joseph et al.(1994),Zhang and Sumi(2002),Mao and Wu(2007)and Liu et al.(2015)showed that the onset of the Bay of Bengal Summer Monsoon(BOBSM)is closely related to the former ENSO and to the Indian Ocean SSTA.In an IOBM positive phase,a warmer SSTA suppresses the land–sea temperature contrast between Eurasia and the Indian Ocean,thus delaying the onset of the BOBSM.The climatological-mean onset date for the BOBSM is 2 May,according to Mao and Wu(2007);before that,the Indian Ocean is dominated by northeasterly winds,and these winds are then largely replaced by southwesterly winds.The IOBM-induced anomalous easterly over the North Indian Ocean can be interpreted as a delayed BOBSM(Chen and You,2017).However,it can also result from the meridional gradient of the SSTA in the western Indian Ocean,according to inertial instability theory(Wu and Liu,2014).
3.3.The IOBM and TP radiation
The results presented in the preceding section suggest that the IOBM is associated with anomalous meridional circulation overlaying the Hadley cell,in which descending air is found to the south of the TP and influences the local surface heat fluxes and precipitation.In this section,we focus on corresponding impacts on the radiation flux budget over the TP,as the circulation changes will inevitably lead to changes in cloud and radiation flux.
The RC is regressed on the IOBM index and it reveals a slight warming effect over the southern and western part of the TP(Fig.7a).Further analysis of its components shows that the IOBM-induced circulation increases solar radiation both at the land surface and TOA.This may be associated with a reduction in cloud amount,as discussed later.The presence of fewer clouds causes less solar radiation to be reflected into space and more shortwave radiation to be trapped within the Earth system,while the transmission coefficient becomes greater than normal in the air column.This leads to more solar energy arriving at the land surface(Fig.7c),and thus an increase in the surface temperature(Fig.4d).According to Stefan–Boltzmann’s law(black-body radiant emittance is directly proportional to the fourth power of the black body’s thermodynamic temperature),the longwave radiation emitted by the land surface is increased(Fig.7b);and because of the higher transmission coefficient in the atmosphere with fewer clouds,it can penetrate the atmospheric column more easily.So,the outgoing longwave radiation at the TOA increases over the eastern part of the TP(Fig.7e).Therefore,a negative feedback mechanism appears in this process:greater incoming shortwave radiation heats the land surface and the warmer land surface emits more longwave radiation,which then penetrates through a clear sky and exits at the TOA.The net effect of the shortwave and longwave radiation flux is some kind of“small difference between two large terms”,and thus only results in a slight warming effect over the southern and western TP(Fig.7a).An equivalent statistical analysis of the satellite-derived GEWEX dataset rather than the MERRA reanalysis radiation dataset also supports these results.However,the satellite data period is limited(only from 1984 to 2007);such results may thus only serve as reference material and are therefore not listed here.
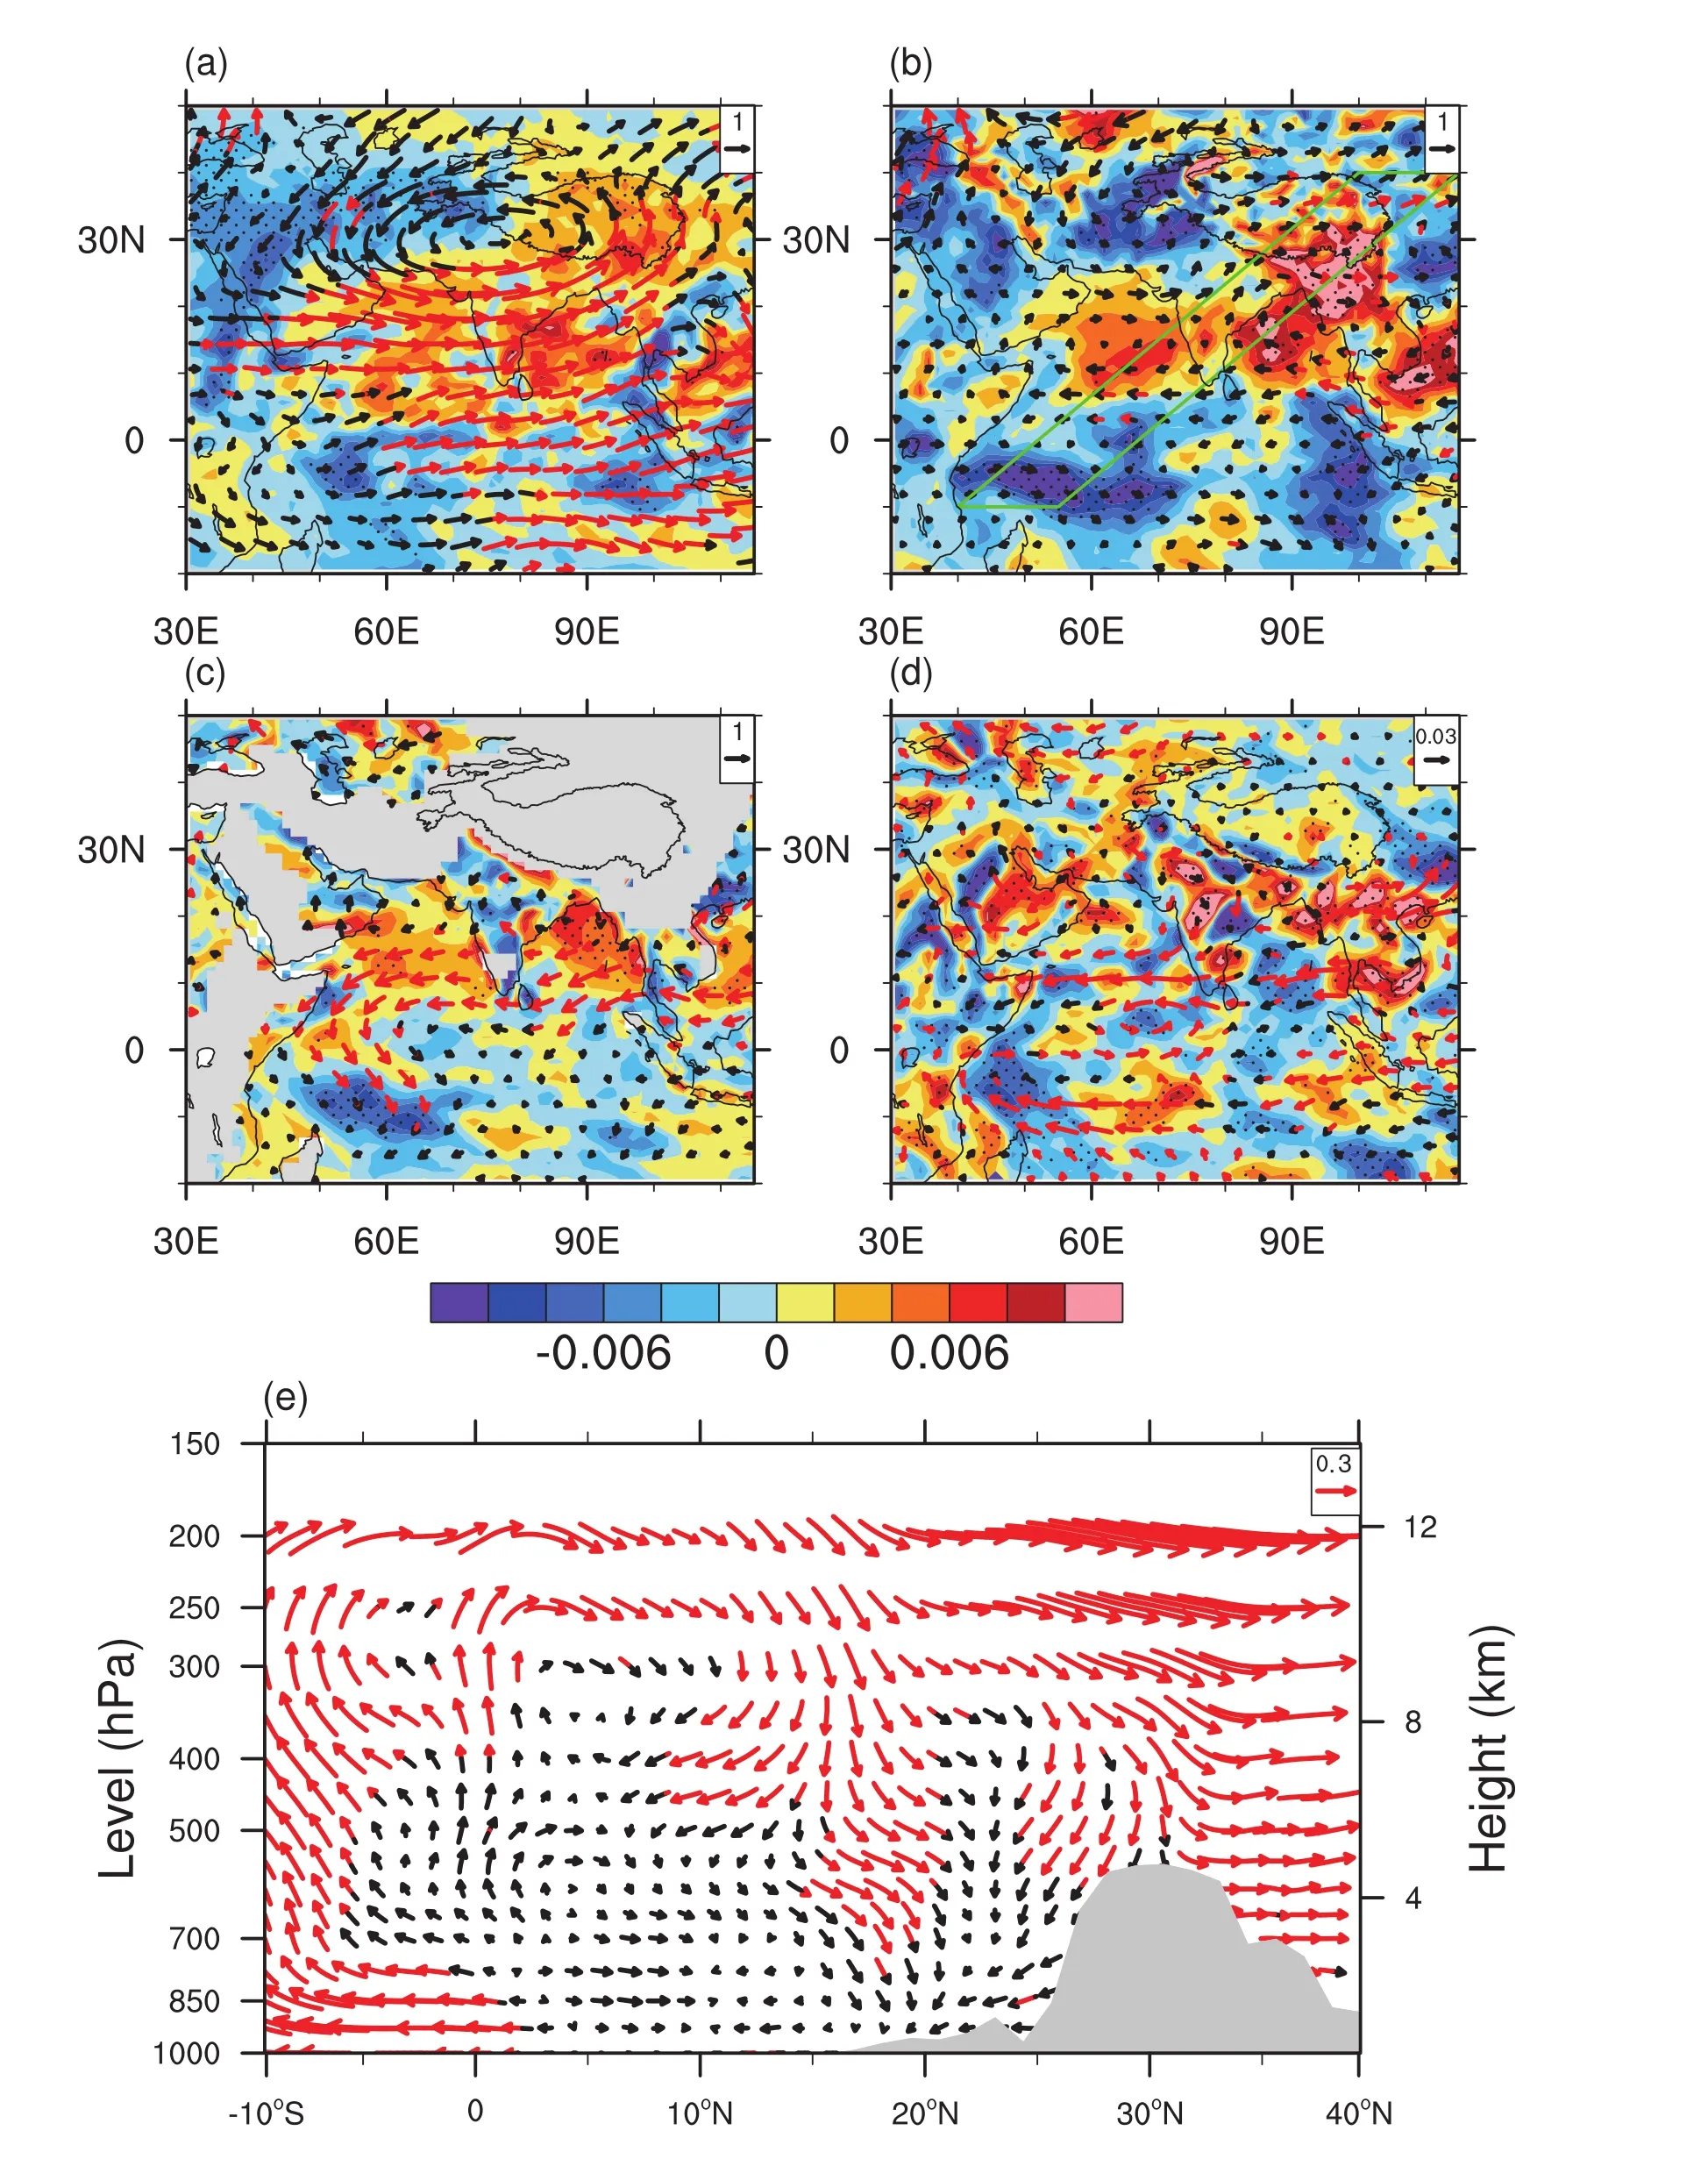
Fig.6.The(a)200-hPa,(b)500-hPa and(c)850-hPa wind(vectors)and vertical velocity(shading)regressed on the IOBM(units:m s−1).(d)Whole-level accumulated water vapor flux(units:2×10⁻⁵ kg m−1 s−1)and its divergence(units:2×10⁻⁵ kg m−2 s−1)regressed on the IOBM.Red vectors and dotted areas indicate significant at the 95%confidence level.(e)Regression of meridional circulation(units:m s−1;vertical speed is scaled by 150 to facilitate visualization)averaged over the green box shown in(b)on the IOBM.Grey shaded area indicates the terrain.All these regression maps reflect simultaneous relationships observed in May.The outline of the TP is shown by the 2000-m black contour line.
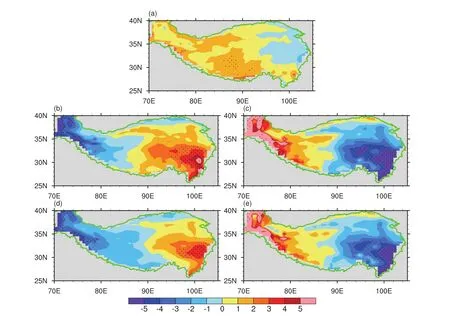
Fig.7.The(a)net radiation,(b)upward longwave radiation flux at the surface,(c)upward shortwave radiation flux at the surface,(d)downward shortwave radiation flux at the TOA,and(e)downward longwave radiation flux at the TOA(units:W m−2),regressed on the IOBM.Dotted areas are significant at the 95%confidence level.All these regression maps reflect simultaneous relationships observed in May.The outline of the TP is shown by the 2000-m green contour line.
In a similar manner we discuss the relationship between the IOBM and cloud amount based on a linear regression analysis.Because of the descending branch of the anomalous meridional circulation,the cloud amount is correspondingly reduced over the southeastern TP(Fig.8a),especially the mid-level cloud(Fig.8b).Mid-level cloud can reflect large quantities of solar radiation and thus reduce the level of solar radiation arriving at the land surface.We can therefore see that shortwave radiation is enhanced both at the land surface and the TOA over the southeastern TP(Figs.7c and d).Additionally,high-level cloud only shows a slight reduction over the southeastern TP,but increases considerably over the western TP(Fig.8c).Given the relative weakness of descending motion at 200–400 hPa compared to that observed at 400–700 hPa(Fig.6e),the generation of cloud is less affected at high levels.It should be noted that,due to the high altitude of the TP,its average surface pressure can reach 600 hPa,and thus the MERRA-produced mid-level cloud amount(400–700 hPa)can be regarded as low-level cloud in this study.The cloud amount data from the ISCCP are also used to test the reliability of our findings,and it is found that they yield a similar result(corresponding figures not shown here).
3.4.The IOBM and TP AHS
In this section,we summarize the overall impact of the IOBM on the total diabatic heating over the TP,which might be more valuable for future studies considering the TP heating as a source of external forcing to the atmosphere.
Earlier,in Fig.1,we showed the variability in SH,LH and RC.From this,it is simple to conclude that the SH and LH are equivalently important in May on the interannual scale,as they share the same magnitude,both in their climatological mean and variability.In addition,Fig.4 suggests that the correlation between the IOBM and SH is mainly positive,but is dominantly negative when it comes to the LH.In fact,the above analysis indicates that the descending motion over the southeastern TP will suppress precipitation and the cloud amount,and further reduce the amount of solar radiation arriving at the surface.It is therefore conceivable that the IOBM-related change in SH and LH cancel one another out.The correlation between the AHS and IOBM is illustrated in Fig.9.Although several stations in the southeastern TP show significantly negative correlations,most of the remaining stations exhibit positive correlations—especially over the northeastern TP.Considering SH and LH will cancel each other out and both have significant correlation with the IOBM(Figs.4a and f),it is reasonable that the distribution of the correlation between the AHS and IOBM(Fig.9)is a little weaker.The net effect shows a dipole pattern with positive correlation over the northeastern TP and negative correlation over the southeastern part.
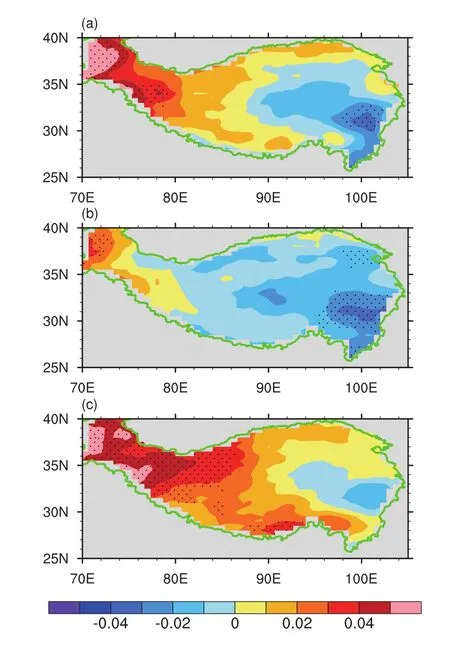
Fig.8.The(a)total cloud amount,(b)mid-level cloud amount,and(c)high-level cloud amount(units:0–10 tenths of sky cover),regressed on the IOBM.Statistical significance at the 95%confidence level is indicated by the dotted area.All these regression maps reflect simultaneous relationships observed in May.The outline of the TP is shown by the 2000-m green contour line.
In summary,the net response of the AHS over the TP to the IOBM is not as significant as its components,with most stations in the northeastern TP exhibiting a positive correlation and only a few stations in the southeastern TP showing positive correlation.In IOBM positive phases,the AHS is more likely to be stronger on an interannual scale,and vice versa.
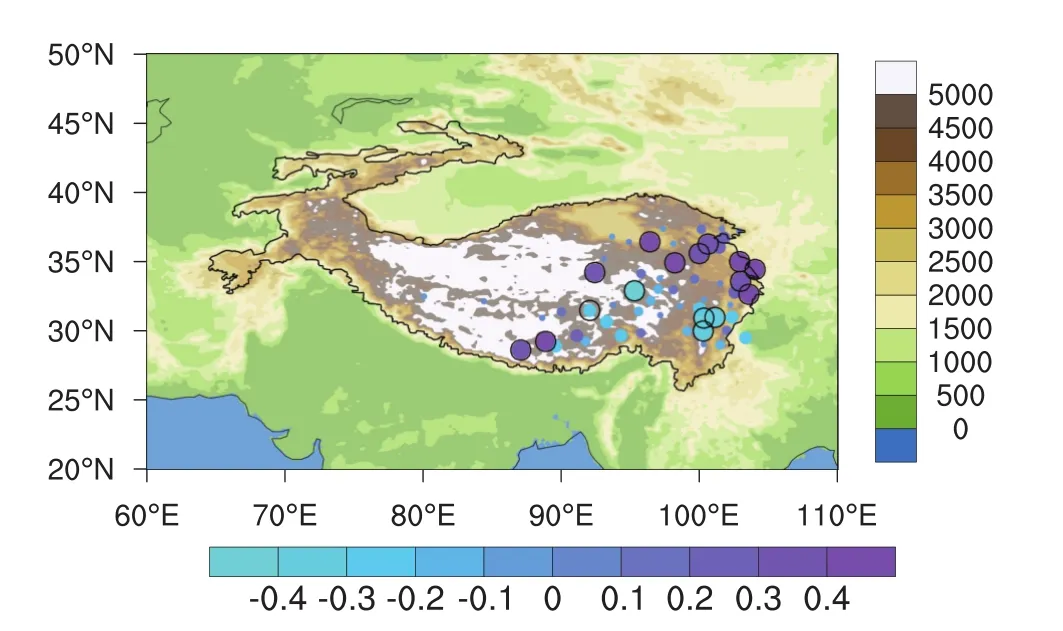
Fig.9.As in Fig 4.but for the AHS.
4.Simulation of the impacts of the IOBM on the TP AHS
4.1.Experimental design
We use FAMIL as our AGCM because of its state-of-theart simulation capability over the ASM region(Zhou et al.,2012,2015;Yu et al.,2014).The basic framework of our experiment is as follows:For the control run,the atmosphere is forced by the climatological SST and is integrated for 20 years as 20 ensembles.The sensitivity experiment is forced by the IOBM superimposed on the climatological SSTA—also integrated for 20 years.The IOBM SSTA is chosen as the first EOF of the tropical Indian Ocean(30◦S–30◦N,30◦–105◦E)in each month from March to August.Further details regarding the design of this experiment,as well as an evaluation of its validity,can be found in Liu and Duan(2017).
4.2.Simulation results
The difference fields for wind and vertical velocity between the sensitivity run and the control run are shown in Fig.10.In general,at the 200-hPa level,the atmosphere exhibits a Gill-pattern response(Fig.10a),with an anticyclonic anomaly over the Arabian Peninsula.It is worth noting that there is an anomalous cyclonic circulation over the TP,with its center located at(30◦N,85◦E),reflecting the negative anomaly of the South Asian High,just as illustrated in Fig.6a.Although the cyclonic anomaly failed to pass the Student’st-test at the 90%confidence level,it is a clear pattern produced by 20 ensembles and agrees with our regression analysis,and so we presume it is not a coincidence.In line with the statistical analysis based on observations,the southern tropical Indian Ocean is dominated by ascending motion,even at the 200-hPa level.However,lacking atmosphere–ocean interaction,the model is unable to reproduce a similar pattern over the Arabian Sea compared to the above regression analysis.Despite this disagreement,the anomalous westerly over the eastern Indian Ocean and descending motion over the Bay of Bengal and Maritime Continent correspond well with the observational results.At 500 hPa,the anomalous Hadley cell is clearly prominent.The ascending branch is situated over the southwestern tropical Indian Ocean,which lies in the maximum area of the IOBM(Fig.3a).On the other hand,the descending branch appears over the northern Arabian Sea,Bay of Bengal,and southeastern TP(Fig.10b).The southeastern TP descending area,which is characterized by less precipitation,higher SH,and a smaller cloud amount,has already been sufficiently discussed in section 3.The difference field at 850 hPa(Fig.10c)is basically similar to that at 500 hPa(Fig.10b).However,in the lower level,the difference field is less similar to that shown in the regression map in Fig.6c,probably due to the model bias and loss of air–sea interaction in the model near the surface.In agreement with the anomalous cyclonic circulation over the Arabian Sea and weak Somali Jet shown in Fig.6c,there is a cyclonic anomaly over the Arabian Sea that cancels out the cross-equatorial flow over the western Indian Ocean.The difference in the accumulated water vapor flux shows that the water vapor transport to the Northern Hemisphere is also suppressed over the western Indian Ocean because of the weaker southerly at lower levels.Besides,the negative vertical velocity anomaly over the southeastern TP also results in an increase of accumulated water vapor flux divergence.
Our experiment also successfully reproduces the SH anomaly,which reflects the difference in surface and air temperature(Figs.11a and b).Meanwhile,surface wind speed exhibits a dipole-mode anomaly(Fig.11c),in which the surface wind decelerates over the northern part of the TP but accelerates over the southern part.As the descending flow over the southeastern TP can be successfully simulated,our model results also show that precipitation is suppressed(Fig.11f)in this region,and that surface temperature increases(Fig.11d).This is highly coherent with the data analysis results.
In general,the numerical experiments suggest that the IOBM can influence the circulation and precipitation over and around the TP.As the vertical motion is suppressed over the southeastern TP,precipitation is also reduced,and thus the change in the SH can be further attributed to the difference between the surface temperature and air temperature.Although our statistical analysis indicates the SH anomaly mainly derives from the surface wind speed increment,in the bulk formula for estimating SH the multiplication of surface wind speed by the temperature difference implies a strong nonlinear effect,which is far beyond the capacity of our linear statistical method.On the other hand,although the increase in surface wind speed in the model is not significant enough to illustrate our interpretation based on observation,we must be clear that,despite the atmospheric model being able to simulate the ASM reasonably well,the capability of the land model still needs to be fur the rim proved.It is well-known that the near-surface processes associated with boundary layer parameterization over the TP are so complicated that AGCMs inevitably produce some errors(Wang et al.,2014;Wu et al.,2017).This may be the reason why the observational data analysis and sensitivity experiment do not generate exactly the same result.
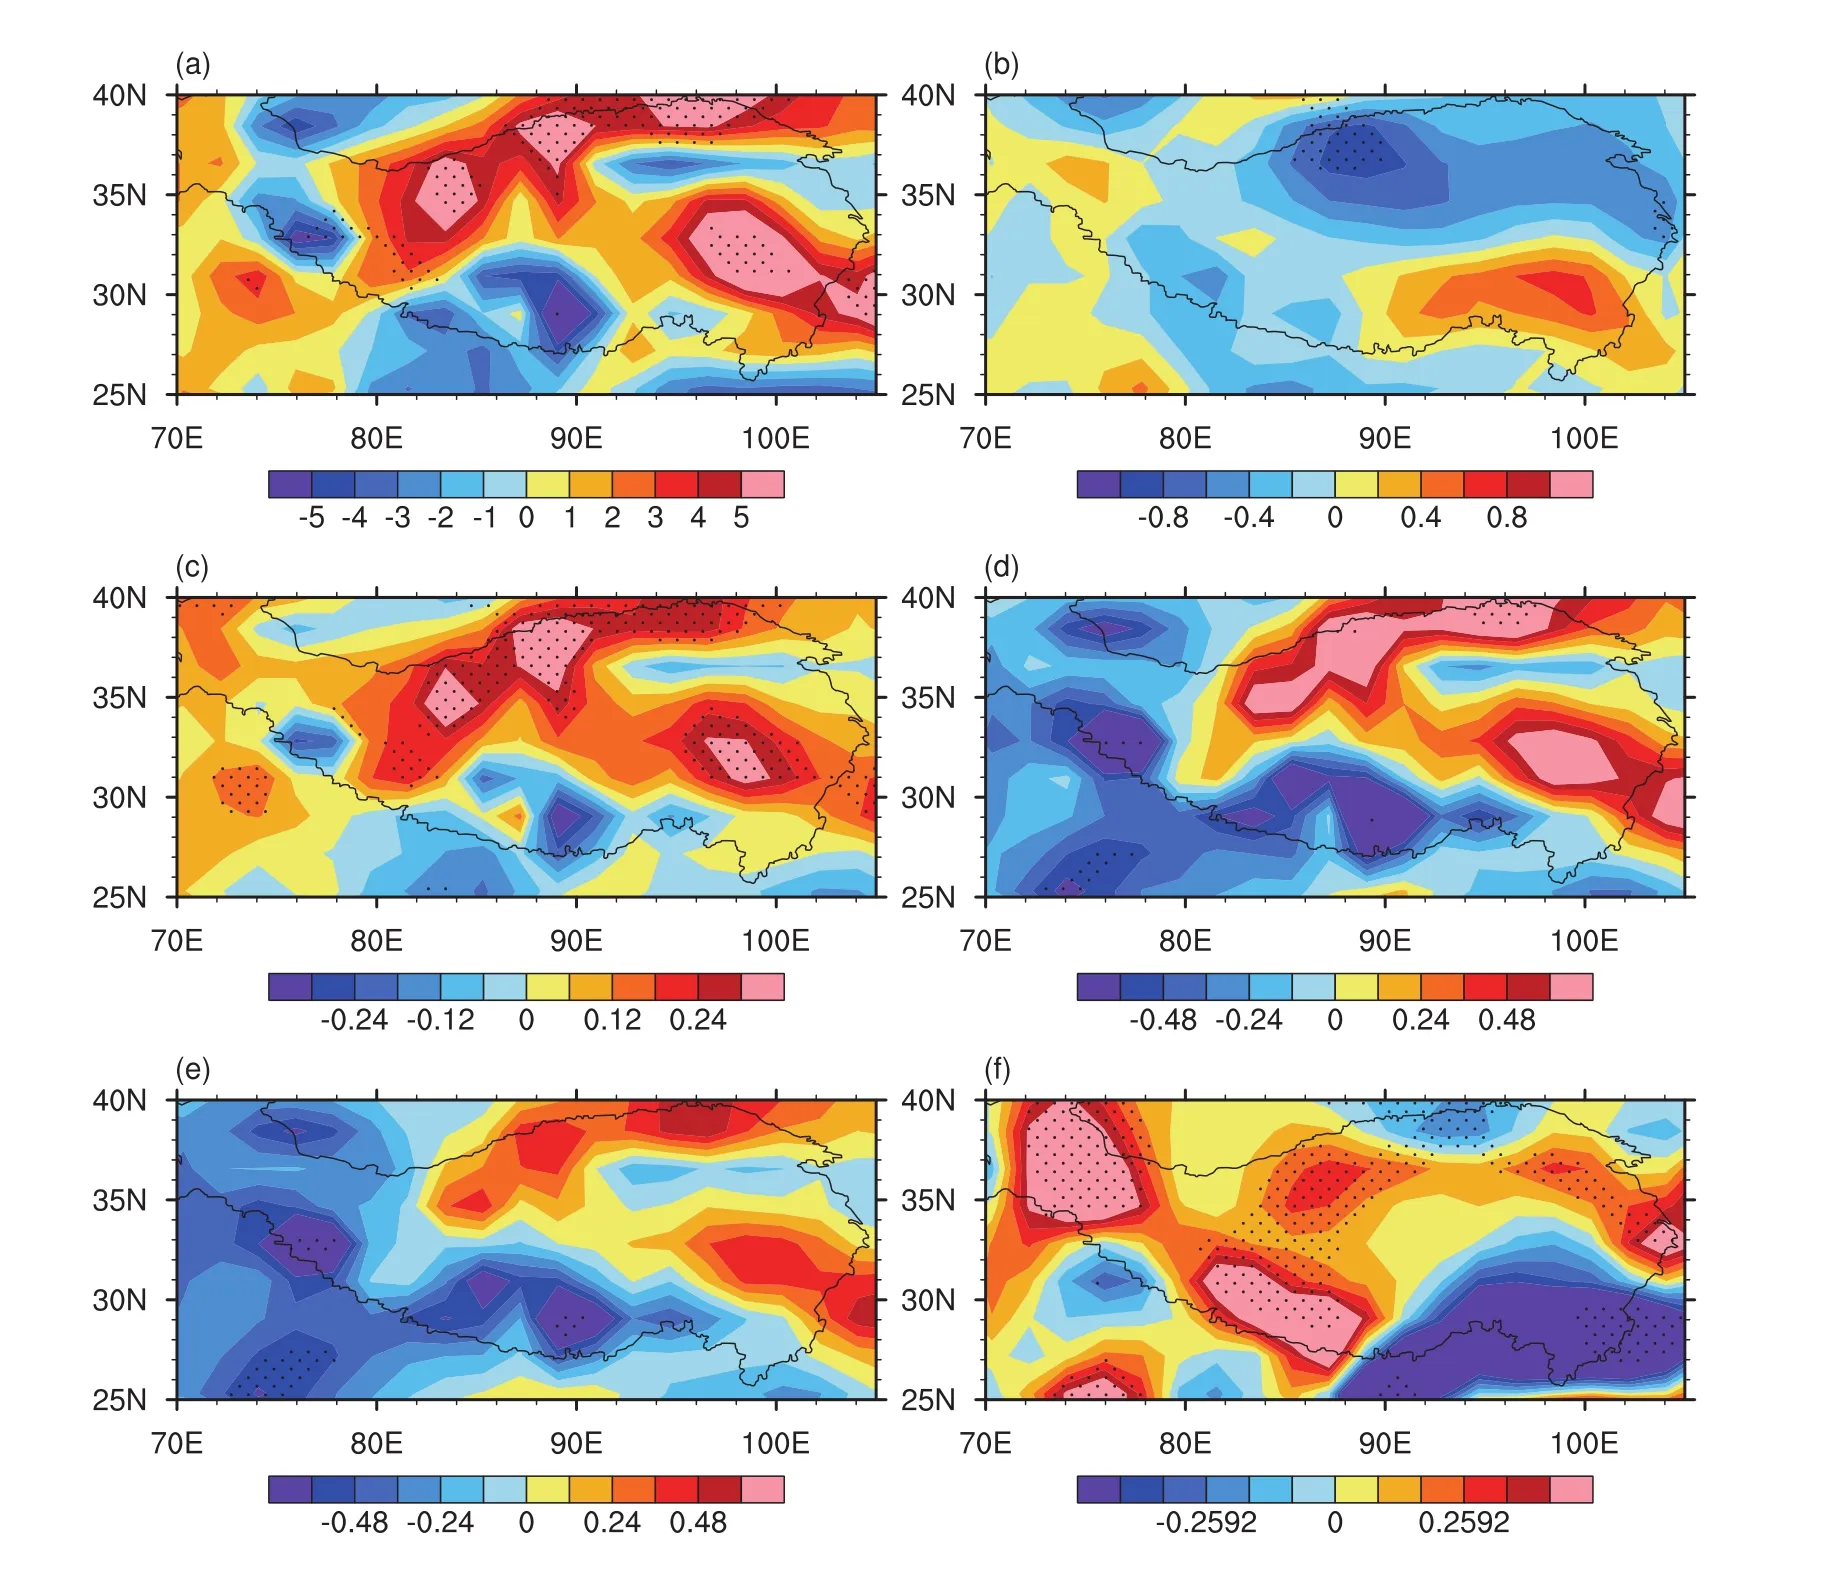
Fig.11.difference fields between the sensitivity experiment and control experiment:(a)SH(units:W m−2);(b)surface wind(units:m s−1);(c)difference between surface temperature and air temperature(units:K);(d)surface temperature(K);(e)air temperature at 2 m(units:K);(f)precipitation(units:mm d−1).Dotted areas indicate statistical significance at the 90%confidence level.The outline of the TP is shown by the 2000-m black contour line.
5.Summary and discussion
Based on historical records collected from 73 meteorological stations over the TP,MERRA reanalysis data,and SST from the Hadley Center during 1980–2014,we investigate the impacts of the late-spring IOBM on the AHS,which includes SH,LH and RC.In addition,numerical experiments are performed using the FAMIL AGCM to examine the possible underlying mechanisms.The main findings can be summarized as follows:
(1)In comparing the correlation between the SH over the TP and the global SSTA from March to May,we find that—unlike in the early spring(March to April),when the climatic anomaly over the TP is controlled mainly by the North Atlantic SSTA—in May,the IOBM plays a more direct role in alternating the interannual variability of circulation and diabatic heating over the TP.This might be related to the components of the AHS.Although the AHS is dominated by SH in March and April,SH and LH become equally important in May.
(2)In late spring,an El Niño event is always followed by a positive IOBM,which reduces the temperature contrast between land and ocean during the monsoon transition.On the one hand,this decrease in land–ocean thermal contrast suppresses the strength of the BOBSM and alters the surrounding circulation;on the other hand,the IOBM does not vary uniformly in the Indian Ocean Basin.In fact,there is a slight SSTA gradient over the tropical Indian Ocean,which might result in an anomalous Hadley cell.Both observation and model results suggest that the IOBM might induce ascending motion over the southwestern Indian Ocean,exactly over the maximum center of the IOBM,and descending motion over the southeastern TP,which will have a substantial influence on in-situ thermal conditions.
(3)Because of the IOBM-induced descending motion over the southern TP,the cloud amount and precipitation are significantly reduced.Meanwhile,as the cloud amount is closely related with the local radiation flux balance,its reduction causes more shortwave radiation to arrive at the surface,which in turn substantially heats the ground and influences the process of SH.Although a larger shortwave flux will raise the surface temperature,higher temperatures will result in the emission of a larger longwave flux to balance the total radiation budget.Therefore,the influence of IOBM-induced circulation on the radiation flux is relatively negligible.In summary,the influence of the IOBM on the AHS is dominated by both SH and LH,and the net effect shows a dipole pattern.However,as the northern part exhibits stronger positive correlation,in positive IOBM phases,the AHS over the TP is more likely to be stronger in May.
Although both the observational and model results reported in this study support our interpretation that IOBM-induced circulation is related with a larger SH over the TP,we must be cautious that some of the specific processes involved still remain unclear.For example,the statistical analysis based on observational data shows that the IOBM might increase the surface wind speed over the TP,thus enhancing the SH in-situ.However,the model results suggest that the change in the temperature difference between the surface and the air is more likely to be responsible for the reinforcement of the SH.Given the nonlinear relationship between wind,temperature and the SH,the linear statistical method is not entirely convincing.On the other hand,models currently still show considerable bias in simulating land surface processes,especially in high-altitude areas.It must also be noted that,in our experiments,atmosphere–ocean interaction is largely neglected,so the precipitation bias is inevitably enhanced in some SAM areas,which might undermine the reliability of our results.In the future,a well-developed land surface model integrated into a reasonable atmosphere–ocean coupled model is needed to solve these problems.Finally,in being limited by the duration of observations over the TP,this study focuses only on the interannual variability.Given the SAM features decadal changes,whether our interpretation remains valid on such a temporal scale warrants further investigation.
Acknowledgements.This work was supported by the National Natural Science Foundation of China(Grant Nos.91637312,41725018 and 91437219),the UK China Research&Innovation Partnership Fund through the Met Office Climate Science for Service Partnership(CSSP)China as part of the Newton Fund,the Key Research Program of Frontier Sciences,and the Special Program for Applied Research on Super Computation of the National Natural Science Foundation of China(NSFC)–Guangdong Joint Fund(second phase)under Grant No.U1501501.
REFERENCES
Abe,M.,T.Yasunari,and A.Kitoh,2005:Sensitivity of the central Asian climate to uplift of the Tibetan Plateau in the coupled climate model(MRI-CGCM1).Island Arc,14,378–388,https://doi.org/10.1111/j.1440-1738.2005.00493.x.
Chen,X.Y.,and Q.L.You,2017:E ff ect of Indian Ocean SST on Tibetan Plateau precipitation in the early rainy season.J.Climate,30,8973–8985,https://doi.org/10.1175/JCLI-D-16-0814.1.
Cui,Y.F.,A.M.Duan,Y.M.Liu,and G.X.Wu,2015:Interannual variability of the spring atmospheric heat source over the Tibetan Plateau forced by the North Atlantic SSTA.Climate Dyn.,45,1617–1634,https://doi.org/10.1007/s00382-014-2417-9.
Duan,A.M.,and G.X.Wu,2005:Role of the Tibetan Plateau thermal forcing in the summer climate patterns over subtropical Asia.Climate Dyn.,24,793–807,https://doi.org/10.1007/s00382-004-0488-8.
Duan,A.M.,and G.X.Wu,2008:Weakening trend in the atmospheric heat source over the Tibetan Plateau during recent decades.Part I:Observations.J.Climate,21(13),3149–3164,https://doi.org/10.1175/2007JCLI1912.1.
Duan,A.M.,Y.M.Liu,and G.X.Wu,2005:Heating status of the Tibetan Plateau from April to June and rainfall and atmospheric circulation anomaly over East Asia in midsummer.Science in China Series D:Earth Sciences,48,250–257,https://doi.org/10.1360/02yd0510.
Feng,J.,J.P.Li,and F.Xie,2013:Long-term variation of the principal mode of boreal spring Hadley circulation linked to SST over the Indo-Pacific Warm Pool.J.Climate,26,532–544,https://doi.org/10.1175/JCLI-D-12-00066.1.
Flohn,H.,1957:Large-scale aspects of the “summer monsoon”in South and East Asia.J.Meteor.Soc.Japan Ser.II,35A,180–186,https://doi.org/10.2151/jmsj1923.35A.0_180.
Gong,D.Y.,and S.W.Wang,2003:Influence of Arctic Oscillation on winter climate over China.Journal of Geographical Sciences,13,208–216,https://doi.org/10.1007/BF02837460.
Hu,J.,and A.M.Duan,2015:Relative contributions of the Tibetan Plateau thermal forcing and the Indian Ocean sea surface temperature basin mode to the interannual variability of the East Asian summer monsoon.Climate Dyn.,45,2697–2711,https://doi.org/10.1007/s00382-015-2503-7.
Huang,G.,X.Qu,and K.M.Hu,2011:The impact of the tropical Indian Ocean on South Asian high in boreal summer.Adv.Atmos.Sci.,28,421–432,https://doi.org/10.1007/s00376-010-9224-y.
Huang,R.H.,1985:The influence of the heat source anomaly over Tibetan Plateau on the northern hemispheric circulation anomalies.Acta Meteorologica Sinica,43,208–220,https://doi.org/10.11676/qxxb1985.026.(in Chinese)
Jin,R.,L.Qi,and J.H.He,2016:Effect of oceans to spring surface sensible heat flux over Tibetan Plateau and its influence to East China precipitation.Acta Oceanologica Sinica,38,83–95,https://doi.org/10.3969/j.issn.0253-4193.2016.05.008.(in Chinese)
Joseph,P.V.,J.K.Eischeid,and R.J.Pyle,1994:Interannual variability of the onset of the Indian summer monsoon and its association with atmospheric features,El Niño,and sea surface temperature anomalies.J.Climate,7,81–105,https://doi.org/10.1175/1520-0442(1994)007<0081:IVOTOO>2.0.CO;2.
Klein,S.A.,B.J.Soden,and N.-C.Lau,1999:Remote sea surface temperature variations during ENSO:Evidence for a tropical atmospheric bridge.J.Climate,12,917–932,https://doi.org/10.1175/1520-0442(1999)012<0917:RSSTVD>2.0.CO;2.
Lee,J.Y.,B.Wang,K.H.Seo,K.J.Ha,A.Kitoh,and J.Liu,2015:E ff ects of mountain uplift on global monsoon precipitation.Asia-Pacific Journal of Atmospheric Sciences,51,275–290,https://doi.org/10.1007/s13143-015-0077-2.
Li,C.F.,and M.Yanai,1996:The onset and interannual variability of the Asian summer monsoon in relation to land–sea thermal contrast.J.Climate,9,358–375,https://doi.org/10.1175/1520-0442(1996)009<0358:TOAIVO>2.0.CO;2.
Li,J.,R.C.Yu,and T.J.Zhou,2008a:Teleconnection between NAO and climate downstream of the Tibetan Plateau.J.Climate,21,4680–4690,https://doi.org/10.1175/2008JCLI2053.1.
Li,J.,R.C.Yu,T.J.Zhou,and B.Wang,2005:Why is there an early spring cooling shift downstream of the Tibetan Plateau?J.Climate,18,4660–4668,https://doi.org/10.1175/JCLI3568.1.
Li,S.L.,J.Lu,G.Huang,and K.M.Hu,2008b:Tropical Indian Ocean basin warming and East Asian summer monsoon:A multiple AGCM study.J.Climate,21,6080–6088,https://doi.org/10.1175/2008JCLI2433.1.
Li,W.,G.X.Wu,W.P.Li,and Y.M.Liu,2001:Thermal adaptation of the large-scale circulation to the summer heating over the Tibetan Plateau.Progress in Natural Science,11(3),207–214.
Liu,B.Q.,G.X.Wu,and R.C.Ren,2015:Influences of ENSO on the vertical coupling of atmospheric circulation during the onset of South Asian summer monsoon.Climate Dyn.,45,1859–1875,https://doi.org/10.1007/s00382-014-2439-3.
Liu,S.F.,and A.M.Duan,2017:Impacts of the leading modes of tropical Indian Ocean sea surface temperature anomaly on sub-seasonal evolution of the circulation and rainfall over East Asia during boreal spring and summer.J.Meteorol.Res.,31,171–186,https://doi.org/10.1007/s13351-016-6093-z.
Liu,X.D.,and Z.Y.Yin,2001:Spatial and temporal variation of summer precipitation over the eastern Tibetan Plateau and the North Atlantic Oscillation.J.Climate,14,2896–2909,https://doi.org/10.1175/1520-0442(2001)014<2896:SATVOS>2.0.CO;2.
Luo,H.B.,and M.Yanai,1983:The large-scale circulation and heat sources over the Tibetan Plateau and surrounding areas during the early summer of 1979.Part I:Precipitation and kinematic analyses.Mon.Wea.Rev.,111,922–944,https://doi.org/10.1175/1520-0493(1983)111<0922:TLSCAH>2.0.CO;2.
Luo,H.B.,and M.Yanai,1984:The large-scale circulation and heat sources over the Tibetan Plateau and surrounding areas during the early summer of 1979.Part II:Heat and moisture budgets.Mon.Wea.Rev.,112,966–989,https://doi.org/10.1175/1520-0493(1984)112<0966:TLSCAH>2.0.CO;2.
Mao,J.,and G.Wu,2007:Interannual variability in the onset of the summer monsoon over the Eastern Bay of Bengal.Theor.Appl.Climatol.,89,155–170,https://doi.org/10.1007/s00704-006-0265-1.
Rayner,N.A.,D.E.Parker,E.B.Horton,C.K.Folland,L.V.Alexander,D.P.Rowell,E.C.Kent,and A.Kaplan,2003:Global analyses of sea surface temperature,sea ice,and night marine air temperature since the late nineteenth century.J.Geophys.Res.,108,4407,https://doi.org/10.1029/2002JD002670.
Rienecker,M.M.,and Coauthors,2011:MERRA:NASA’s modern-era retrospective analysis for research and applications.J.Climate,24,3624–3648,https://doi.org/10.1175/JCLI-D-11-00015.1.
Torres,M.E.,M.A.Colominas,G.Schlotthauer,and P.Flandrin,2011:A complete ensemble empirical mode decomposition with adaptive noise.Proceedings of 2011 IEEE International Conference on Acoustics,Speech and Signal Processing(ICASSP),Prague,Czech Republic,IEEE,4144–4147,https://doi.org/10.1109/ICASSP.2011.5947265.
Wan,R.J.,and G.X.Wu,2007:Mechanism of the Spring Persistent Rains over southeastern China.Science in China Series D:Earth Sciences,50,130–144,https://doi.org/10.1007/s11430-007-2069-2.
Wang,B.,and L.Ho,2002:Rainy season of the Asian–Pacific summer monsoon.J.Climate,15,386–398,https://doi.org/10.1175/1520-0442(2002)015<0386:RSOTAP>2.0.CO;2.
Wang,M.R.,S.W.Zhou,and A.M.Duan,2012:Trend in the atmospheric heat source over the central and eastern Tibetan Plateau during recent decades:Comparison of observations and reanalysis data.Chinese Science Bulletin,57,548–557,https://doi.org/10.1007/s11434-011-4838-8.
Wang,Z.Q.,A.M.Duan,and G.X.Wu,2014:Time-lagged impact of spring sensible heat over the Tibetan Plateau on the summer rainfall anomaly in East China:Case studies using the WRF model.Climate Dyn.,42,2885–2898,https://doi.org/10.1007/s00382-013-1800-2.
Wu,G.X.,and H.Z.Liu,1992:Atmospheric precipitation in response to equatorial and tropical sea surface temperature anomalies.J.Atmos.Sci.,49,2236–2255,https://doi.org/10.1175/1520-0469(1992)049<2236:APIRTE>2.0.CO;2.
Wu,G.X.,and H.Z.Liu,1995:Neighbourhood response of rainfall to tropical sea surface temperature anomalies.Part I:Numerical experiment.Scientia Atmospherica Sinica,19,422–434,https://doi.org/10.3878/j.issn.1006-9895.1995.04.05.(in Chinese)
Wu,G.X.,and B.Q.Liu,2014:Roles of forced and inertially unstable convection development in the onset process of Indian summer monsoon.Science China Earth Sciences,57,1438–1451,https://doi.org/10.1007/s11430-014-4865-9.
Wu,G.X.,Y.M.Liu,B.He,Q.Bao,A.M.Duan,and F.F.Jin,2011:Thermal controls on the Asian summer monsoon.Sci.Rep.,2,404,https://doi.org/10.1038/srep00404.
Wu,G.X.,and Coauthors,2007:The influence of mechanical and thermal forcing by the Tibetan Plateau on Asian climate.Journal of Hydrometeorology,8,770–789,https://doi.org/10.1175/JHM609.1.
Wu,G.X.,and Coauthors,2015:Tibetan Plateau climate dynamics:recent research progress and outlook.National Science Review,2,100–116,https://doi.org/10.1093/nsr/nwu045.
Wu,R.G.,and S.W.Yeh,2010:A further study of the tropical Indian Ocean asymmetric mode in boreal spring.J.Geophys.Res.,115,https://doi.org/10.1029/2009JD012999.
Wu,Y.,Y.Q.Li,X.W.Jiang,and Y.C.Dong,2017:Parameters sensitivity analysis on simulation of rainfall in drought- flood year on Qinghai-Tibetan Plateau by WRF model.Plateau Meteorology,36(3),619–631,https://doi.org/10.7522/j.issn.1000-0534.2016.00057.(in Chinese)
Wu,Z.H.,E.K.Schneider,B.P.Kirtman,E.S.Sarachik,N.E.Huang,and C.J.Tucker,2008:The modulated annual cycle:An alternative reference frame for climate anomalies.Climate Dyn.,31,823–841,https://doi.org/10.1007/s00382-008-0437-z.
Wu,Z.W.,W.Bin,J.P.Li,and F.F.Jin,2009:An empirical seasonal prediction model of the East Asian summer monsoon using ENSO and NAO.J.Geophys.Res.,114,https://doi.org/10.1029/2009JD011733.
Xie,S.-P.,Y.Kosaka,Y.Du,K.M.Hu,J.S.Chowdary,and G.Huang,2016:Indo-western Pacific Ocean capacitor and coherent climate anomalies in post-ENSO summer:A review.Adv.Atmos.Sci.,33,411–432,https://doi.org/10.1007/s00376-015-5192-6.
Xie,S.-P.,K.M.Hu,J.Hafner,H.Tokinaga,Y.Du,G.Huang,and T.Sampe,2009:Indian Ocean capacitor effect on Indo-western Pacific climate during the summer following El Niño.J.Climate,22,730–747,https://doi.org/10.1175/2008JCLI2544.1.
Yanai,M.,and C.F.Li,1994:Mechanism of heating and the boundary layer over the Tibetan Plateau.Mon.Wea.Rev.,122,305–323,https://doi.org/10.1175/1520-0493(1994)122<0305:MOHATB>2.0.CO;2.
Yang,J.L.,Q.Y.Liu,S.P.Xie,Z.Y.Liu,and L.X.Wu,2007:Impact of the Indian Ocean SST basin mode on the Asian summer monsoon.Geophys.Res.Lett.,34,https://doi.org/10.1029/2006GL028571.
Ye,D.Z.,and Y.-X.Gao,1979:The Meteorology of the Qinghai-Xizang(Tibet)Plateau.Science Press,Beijing,278 pp.(in Chinese)
Yeh,T.C.,1950:The circulation of the high troposphere over China in the winter of 1945–46.Tellus,2,173–183,https://doi.org/10.1111/j.2153-3490.1950.tb00329.x.
Yu,H.Y.,Q.Bao,L.J.Zhou,X.C.Wang,and Y.M.Liu,2014:Sensitivity of precipitation in aqua-planet experiments with an AGCM.Atmos.Oceanic Sci.Lett.,7,1–6,https://doi.org/10.1080/16742834.2014.11447126.
Zhang,R.H.,and A.Sumi,2002:Moisture circulation over East Asia during El Niño episode in northern winter,spring and autumn.J.Meteor.Soc.Japan,80,213–227,https://doi.org/10.2151/jmsj.80.213.
Zhao,P.,and L.X.Chen,2001:Interannual variability of atmospheric heat source/sink over the Qinghai–Xizang(Tibetan)Plateau and its relation to circulation.Adv.Atmos.Sci.,18,106–116,https://doi.org/10.1007/s00376-001-0007-3.
Zhao,Y.F.,and J.Zhu,2015:Assessing quality of grid daily precipitation datasets in China in recent 50 years.Plateau Meteorology,34,50–58,https://doi.org/10.7522/j.issn.1000-0534.2013.00141.(in Chinese)
Zhao,Y.F.,J.Zhu,and Y.Xu,2014:Establishment and assessment of the grid precipitation datasets in China for recent 50 years.Journal of the Meteorological Sciences,34,414–420,https://doi.org/10.3969/2013jms.0008.(in Chinese)
Zhou,L.J.,Y.M.Liu,Q.Bao,H.Y.Yu,and G.X.Wu,2012:Computational performance of the high-resolution atmospheric model FAMIL.Atmos.Oceanic Sci.Lett.,5,355–359,https://doi.org/10.1080/16742834.2012.11447024.
Zhou,L.J.,and Coauthors,2015:Global energy and water balance:Characteristics from Finite-volume Atmospheric Model of the IAP/LASG(FAMIL1).Journal of Advances in Modeling Earth Systems,7,1–20,https://doi.org/10.1002/2014 MS000349.
杂志排行
Advances in Atmospheric Sciences的其它文章
- Increasing Flash Floods in a Drying Climate over Southwest China
- Comparison of a Manual and an Automated Tracking Method for Tibetan Plateau Vortices
- Collating Historic Weather Observations for the East Asian Region:Challenges,Solutions,and Reanalyses
- Further-Adjusted Long-Term Temperature Series in China Based on MASH
- Seasonal Forecasts of the Summer 2016 Yangtze River Basin Rainfall
- Assessment and Assimilation of FY-3 Humidity Sounders and Imager in the UK Met Office Global Model
