Surface chemical characterization of deactivated low-level mercury catalysts for acetylene hydrochlorination☆
2018-05-25ChaoLiuChenhuiLiuJinhuiPengLiboZhangShixingWangAiyuanMa
Chao Liu ,Chenhui Liu ,Jinhui Peng ,Libo Zhang ,*,Shixing Wang ,Aiyuan Ma
1 State Key Laboratory of Complex Nonferrous Metal Resources Clean Utilization,Kunming University of Science and Technology,Kunming,650093,China
2 National Local Joint Laboratory of Engineering Application of Microwave Energy and Equipment Technology,Kunming,650093,China
3 Faculty of Metallurgical and Energy Engineering,Kunming University of Science and Technology,Kunming,650093,China
4 Key Laboratory of Resource Clean Conversion in Ethnic Regions,Education Department of Yunnan Province,Yunnan Minzu University,Kunming 650500,China
1.Introduction
Acetylene hydro chlorination process is widely used in the polyvinyl chloride(PVC)industry in China due to the “rich coal and deficient oil”energy structure[1].The basic reaction of this process is as follows,

HgCl2supported on activated carbon(AC)is established as the most excellent catalyst for this reaction considering the catalytic activity,stability and costs.HgCl2/AC catalysts can be classified as high-level mercury catalysts(HMC)and low-level mercury catalysts(LMC),generally with HgCl2content being 10.5 wt%-12.5 wt%and 4.0 wt%-6.5 wt%,respectively.
The catalysts will deactivate after being used for a certain time.In order to develop new catalysts and regenerate spent catalysts,the mechanisms of catalyst deactivation have long been the concern of researchers[2,3].The decrease of mercury content is the main reason for the deactivation of HMC[4,5].According to the requirement of“The integrate prevention and treatment scheme for mercury pollution from PVC production industry using calcium carbide method”released by the Chinese Ministry of Industry and Information Technology in 2010,LMC should be fully used by the year 2015[6].In fact,composite LMC with the addition of some metal chlorides have been widely applied in most of the industries.The existing state of active elements in LMC and the deactivation mechanisms of catalysts may be different from those of HMC.However,only a few researchers studied the deactivation reasons of LMC.Yu et al.reported that about 50 wt%of HgCl2supported on new LMC was transformed into Hg2Cl2,which reduced the catalyst activity[3].Zhi etal.[2]compared the physical and chemical changes of LMC before and after deactivation,and the results showed that carbon deposition and sulfur poisoning were the main reasons for catalyst deactivation.
Industrial application of non-mercury catalysts is the final way to completely eliminate the mercury pollution from mercury-containing catalysts.Therefore,in recent years,many researchers focused on the development of mercury-free catalysts.The deactivation reasons of non-mercury catalysts were also investigated.Song et al.[7]reported that the deactivation of palladium-based catalysts was caused by the loss of active component,carbon deposition and the decrease of specific surface area.Dai et al.[8]found that the reduction of active Au3+to metallic Au0and Au nano-particle aggregation were responsible for the deactivation of AuCl3/AC catalyst.However,non-mercury catalysts are not widely applied commercially.Thus,the studies for commercial LMC are of importance at present.
This study intends to characterize the surface chemical properties of spent LMC with the combined use of multiple characterization techniques,i.e.X-ray Diffraction(XRD),Scanning Electron Microscopy-Energy Dispersive Spectrometry(SEM-EDS),Gas Chromatography-Mass Spectrometry(GC-MS),Fourier Transform Infrared(FTIR),X-ray Photoelectron Spectroscopy(XPS)and Brunauer Emmett Teller(BET)analysis.Physical and chemical changes of the catalysts before and after deactivation were compared.The deactivation mechanisms of catalysts were discussed.The results of this research may be helpful for designing new LMC and regenerating deactivated LMC.
2.Experimental
2.1.Samples and characterization
The samples,catalyst support activated carbon(AC),fresh low-level mercury catalyst(FMC)and spent low-level mercury catalyst(SMC)were obtained from a qualified firm for production and recovery of mercury catalysts,which is located in Guizhou province,China.SMC crushed to pass through a 75 μm sieve is marked as SMC-P.The columnar AC support is derived from coal.The catalyst tested is a new type of composite mercury-containing catalyst with the additions of some metal chlorides,i.e.,NaCl,KCl and BaCl2.The samples were dried at 80°C for 2 h before experiment.
This type of low-level mercury catalyst was used in the conventional VCM production equipment using high-level mercury catalysts before.An industrial catalytic reaction process was conducted in fixed bed reactors with Stage 1 and Stage 2 in series.FMC was first used in Stage 2 for about 4600 h,and then it were transferred to Stage 1 for secondary use for about3000 h.Therefore,the total running time of catalyst was about 7600 h.The reaction temperature was in the range of130-180°C,which was dependent on othero perating conditions(e.g.catalystactivity).The absolute pressure of catalytic reaction was 0.12-0.15 MPa.Gas hourly space velocity(GHSV,C2H2based)was in the range of 20-50 h-1.Specific GHSV value depended on the service condition of catalyst.The molar ratio of reactants HCl(>95.8%)and C2H2(>99%)is 1.05:1.In addition,other components of the feed gas contain H2O(<0.03%),O2(<0.4%),CO and N2(<2%).Though the feed gas was purified prior to reaction,trace of PH3and H2S from acetylene and trace of chlorine free radical from hydrogen chloride gas may cause catalyst poisoning.Conversion of acetylene in Stage 1 of>80%and in Stage 2 of>99%,and selectivity to vinyl chloride for both stages of>99.5%can be achieved using low-level mercury catalysts.
The powder XRD data was achieved by a Rigaku D/MAX-3B X-ray diffractometer with Cu Kαradiation at 40 kV and 40 mA.The surface morphology of samples was characterized by Scanning Electron Microscopy(SEM,Philips XL-30E)equipped with an EDS attachment.FT-IR spectroscopic studies were performed on a Nicolet avatar 360 FT-IR spectrophotometer using dry KBr pellets in the frequency of 400-4000 cm-1.XPS measurements were conducted on a Perkin-Elmer PHI-5300 spectrometer.The XPS spectra were calibrated by C 1s at 284.8 eV.
The textural properties of the samples were determined using an autosorb instrument(Quantachrome).The data for the samples were collected by obtaining nitrogen adsorption isotherms at 77 K after degassing at 423 K for 6 h.The surface area was achieved based on the BET method.The pore size distribution was determined using the Density Functional Theory(DFT)model.
SMC soaked with methanol was subjected to ultrasonic-assisted extraction for 30 min.The extracted solution was analyzed by GC-MS to study the nature of carbon deposition.GC-MS was conducted on a Thermo Finnigan Trace DSQ GC-MS coupled with a HP-5MS column(30 m×0.25 mm×0.25 μm).The temperature program for GC analysis was 40 °C for 3 min,increased to 90 °C at 10 °C·min-1and held for 5 min,increased to 100 °C at 2 °C·min-1and then increased to 200 °C at 20 °C·min-1.The carrier gas was 1.0 ml·min-1of Helium.The electron impact(EI)ion source temperature was 200°C.
2.2.Determination of mercury
The determination of total mercury content in the catalysts was based on the Chinese national standard“Low-level mercury catalyst for chloroethylene synthesis”[9].About 1 g of catalyst ground to less than 180 μm was dried at 80 °C for 2 h and then was digested by 15 ml of HCl,5 ml of HNO3and 20 ml of 100 g·L-1NaCl solution under slightly boiling for 15 min,after which the digestion solution was filtered and then the filtration residue,together with filter paper was subjected to another twice repeated digestion.Finally,the filtrates were merged and diluted with distilled water to 500 ml.A blank experiment was also conducted.The mercury concentration in the filtrates was determined by inductively coupled plasma optical emission spectrometry(ICP-OES)[10].
The mercury content in FMC was 4.51%±0.16%,which is a typical low-level mercury catalyst.After deactivation,the mercury content in SMC reduced to 3.41%±0.18%.Therefore,the loss of total mercury content during the catalytic reaction was not distinct.A similar conclusion was reported by Zhi et al.[2].
3.Results and Discussion
3.1.XRD analysis
The XRD patterns of the samples are shown in Fig.1.20°-26°and 40°-45°are assigned to the amorphous peaks of AC[11,12].The peaks which appeared at 20.9°,26.6°,36.5°and 50.1°are ascribed to the presence of SiO2[13],which is the nature of coal-based AC.No crystal peaks of active component HgCl2were found in both FMC and SMC(Fig.1).This may be due to the fact that HgCl2supported on AC is highly dispersed and/or amorphous[14].Active components also cannot be found on the Hg-Cs/AC catalyst with 4 wt%of HgCl2;CsCl and HgCl2supported on AC were found to interact and form cesium-mercuric chlorides[15].The active species were proved to disperse as a monolayer or submonolayer on the surface of AC[15].A similar phenomenon also was found on some commercial catalysts with high specific surface area[16].Therefore,it may be inferred that HgCl2is also highly dispersed on the surface of AC in the catalysts of this study.

Fig.1.XRD patterns of AC,FMC and SMC.
3.2.SEM analysis
Fig.2 shows a typical SEM image and element distribution maps of the exterior surface of SMC,and the corresponding EDS analysis for this region is shown in Table 1.High levels of Hg and Cl are widely scattered on the surface of AC,indicating the presence of highly dispersed HgCl2,which further confirms the results of XRD analysis.The distribution image of S is similar to that of Hg,which is likely due to the existence of HgS which originated from the sulfur poisoning of catalysts.The presence of HgS in spent catalysts has been validated in our previous work applying a sequential extraction procedure[10].In addition,Zhi et al.[2]also confirmed the presence of deactivation product HgS in used low-mercury catalysts using temperature programmed oxidation-mass spectrometry(TPO-MS).
The match of distribution maps of O and Si indicates the presence of SiO2,corresponding to the XRD analysis results.The mass ratio of O and Si(4.3%:1.4%)in EDS analysis(Table 1)is greatly higher than the ratio in SiO2(8:7).Thus O should also be combined with other elements.It can be seen from Fig.2 that most regions of the distribution for elements Al,Fe and Ca are overlapped with that of O,indicating the existence of Al2O3,Fe2O3and CaO.This can be ascribed to the nature of AC derived from coal[17].The content of Ba is low(0.5%)but is concentrated inseveral spots matched with high content of Cl,implying the presence of catalytic promoter BaCl2.Low levels of Mg,K and Na are uniformly distributed,which is consistent with the distribution of Cl.This is attributed to the presence of active additives MgCl2,KCl and NaCl.
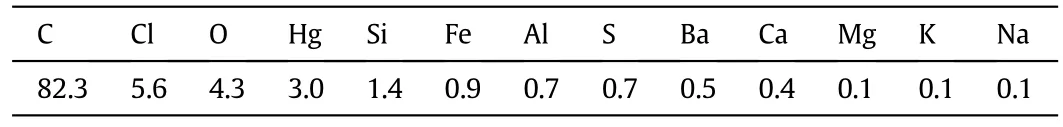
Table 1 Element content based on the EDS analysis related to maps of SEM in Fig.2(wt%)
In order to compare the change of inner surface of catalysts before and after deactivation,the representative SEM images of the internal micro structure ofFMC and SMC were obtained(Fig.3).The smooth surface of FMC is widely dotted with many white spots,ascribing to HgCl2and other additives according to the EDS analysis.Multiple layers of dense adsorbates cover the surface of SMC,leading to disappearance of the white spots.The relative content of Cl for SMC is higher than that of FMC based on EDS analysis,implying that the adsorbates are likely the carbon deposition.Therefore,the coverage of active sites caused by carbon deposition is responsible for the catalyst deactivation.In addition,no Hg was detected on SMC(Fig.3b).This may be explained by the loss of Hg in this region examined.Trace of phosphorus was found on the SMC,which was likely due to the presence of the impurities derived from feed gas during the catalytic reaction.It is reported that PH3from acetylene gas could lead to the generation of(HgCl)3P[18,19],reducing catalyst activity.
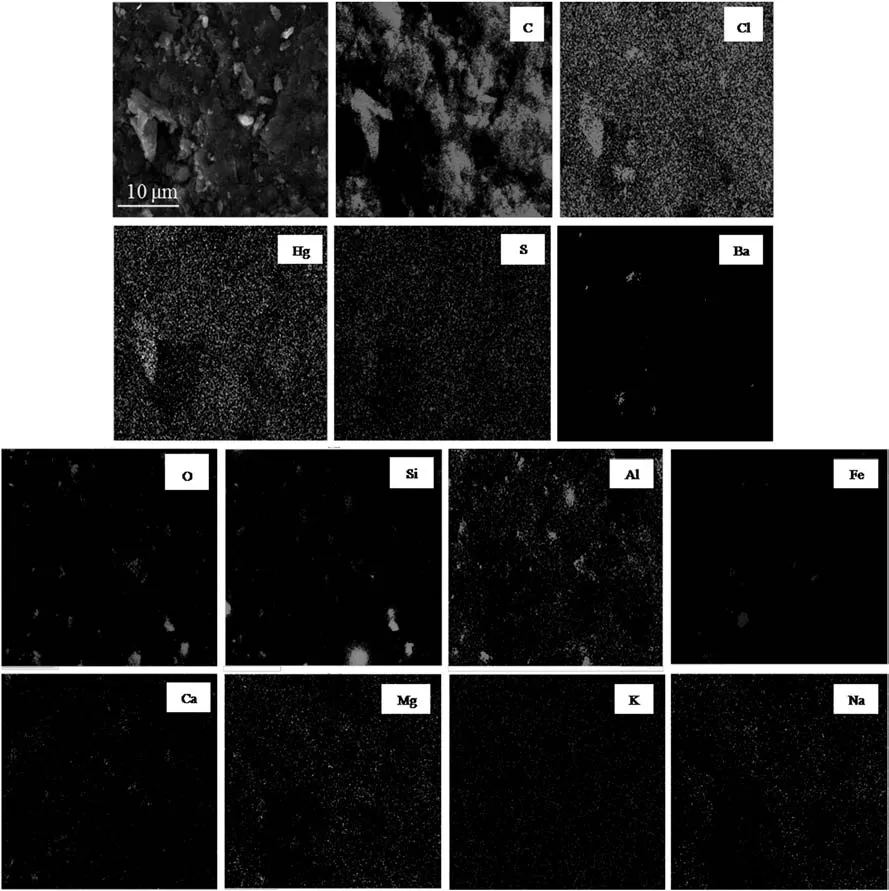
Fig.2.Elemental maps of the exterior surface of SMC showing the distribution of C,Cl,Hg,S,O,Si,Al,Fe,Ca,Mg,K and Na.
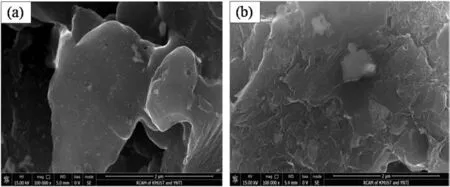
Fig.3.The internal microstructure of(a)FMC and(b)SMC.
3.3.FTIR and XPS analysis
The FTIR spectra of the samples are shown in Fig.4.The presence of many adsorption peaks on AC reveals the nature of AC.The peak at 1112.47 cm-1can be assigned to C--O stretching vibrations[20]and the stretching vibration of Si--O--Si in SiO2[21],corresponding to the XRD analysis.The spectrum of C=C stretching bands is 1617 cm-1[22].The characteristic absorption peak of the methyl group is presented at the band 1382 cm-1[20,23,24].The band at 2920 cm-1is attributable to C--H stretching vibrations[20,25].The peak at about 3430 cm-1can be associated with the--OH stretching mode[26].
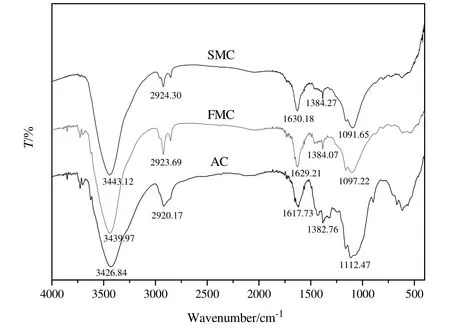
Fig.4.FTIR spectra of AC,FMC and SMC.
Obvious shifts and the decreases in intensity of the characteristic peaks representing the functional group on AC can be observed in FMC compared with the AC.This can be ascribed to the adsorption of HgCl2and other active additives on AC.The band at 1097.22 cm-1for FMC shifts to 1091.65 cm-1for SMC.This may be caused by the adsorption of some impurities(e.g.carbon deposition)on C--O and Si--O--Si groups,which has been validated by the presence of organics C8H17ClO2Si,C10H9ClO2and C7H9ClO in SMC based on the results of GC-MS analysis that will be discussed later.In addition,slight shifts of some functional groups are noted after catalyst deactivation,which is likely due to the adsorption of impurities(e.g.carbon deposit)on SMC,leading to the decrease of active sites.
Fig.5 shows the survey XPS spectra ofFMC and SMC.The relative content of elements detected is listed in Table 2.It can be seen that the main elements present in both FMC and SMC are C,O,Hg and Cl.The relative content of C and Cl increased after catalyst deactivation.This is likely due to the adsorption of chlorine-containing organics on catalysts.The decrease in the content of O after catalyst deactivation can be ascribed to the hydrogenation of oxygen-containing species,e.g.Al2O3,CaO and C=O.This is easy to occur in the presence of the feed gas HCl during the catalytic reaction process.The relative content of Hg reduced from 2.53 at%for FMC to 0.37 at%for SMC,indicating the loss of Hg.Note that mercury may evaporate underultra-high vacuum ofXPS analysis.The occurrence of S and P on SMC can be ascribed to the adsorption of impurities from the feed gas,which is in accordance with the SEM-EDS results.
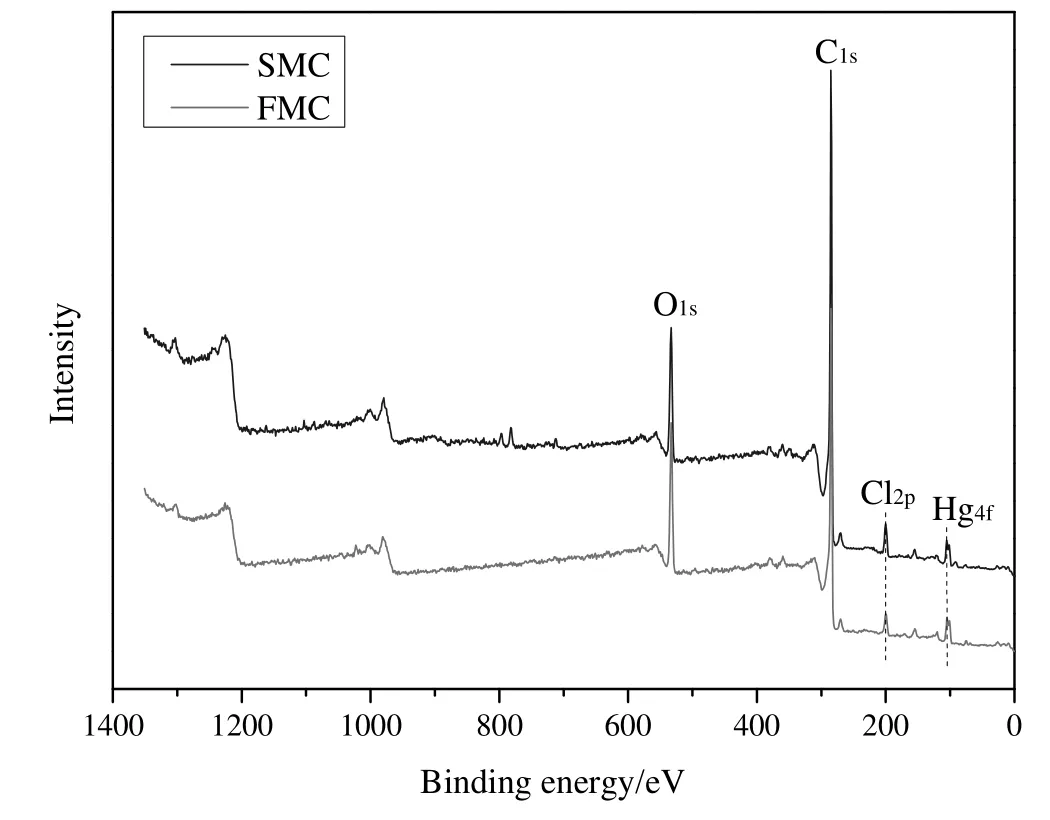
Fig.5.The survey XPS spectra of FMC and SMC.

Table 2 Relative contents of various elements according to the XPS spectra
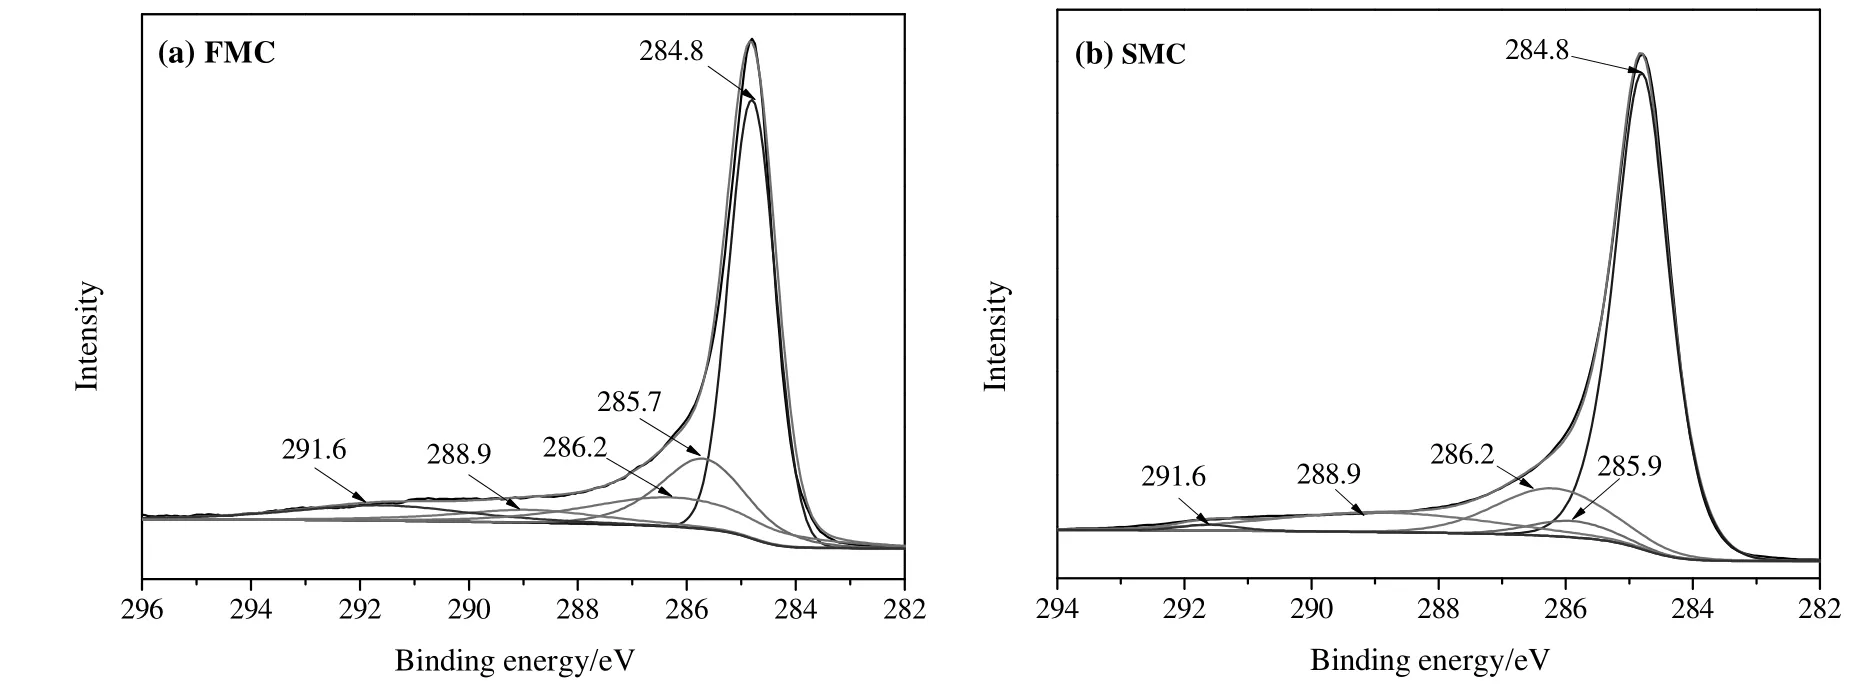
Fig.6.C 1s XPS spectra for the samples tested(a)FMC and(b)SMC.

Fig.7.O 1s XPS spectra for the samples tested(a)FMC and(b)SMC.
The high-resolution spectra of C 1s,O 1s,Cl 2p and Hg 4f were given in Figs.6-9,respectively.Corresponding assignments and relative contents of species related to carbon,oxygen,chlorine,mercury and silicon based on the XPS spectra were shown in Table 3.According to Fig.6 and Table 3,no obvious changes on the kinds of the carbon-containing species can be seen after catalyst deactivation.The intense peak at 284.8 eV is assigned to C--C/C=C/C--H groups,ascribing to the carboncontaining covalent bond in the aromatic structure on AC.The content of these groups increased from 54.4 at%for FMC to 70.6 at%for SMC,which was likely due to the adsorption of carbon deposition.The peaks at 285.9 eV and 288.9 eV can be assigned to C--O--C and O--C=O,respectively,which are the functional groups on AC,corresponding to the FTIR analysis.The peak at 286.2 eV is assigned to C--Cl group.Note that a C--Cl bond can be observed in both FMC and SMC.It was expected that C--Cl group was found on activated carbon impregnated with chlorine by the reaction ofC and Cl-[50].The peak at 291.6 eV is attributable to shake-up satellite due to π-π*transitions in aromatic rings.
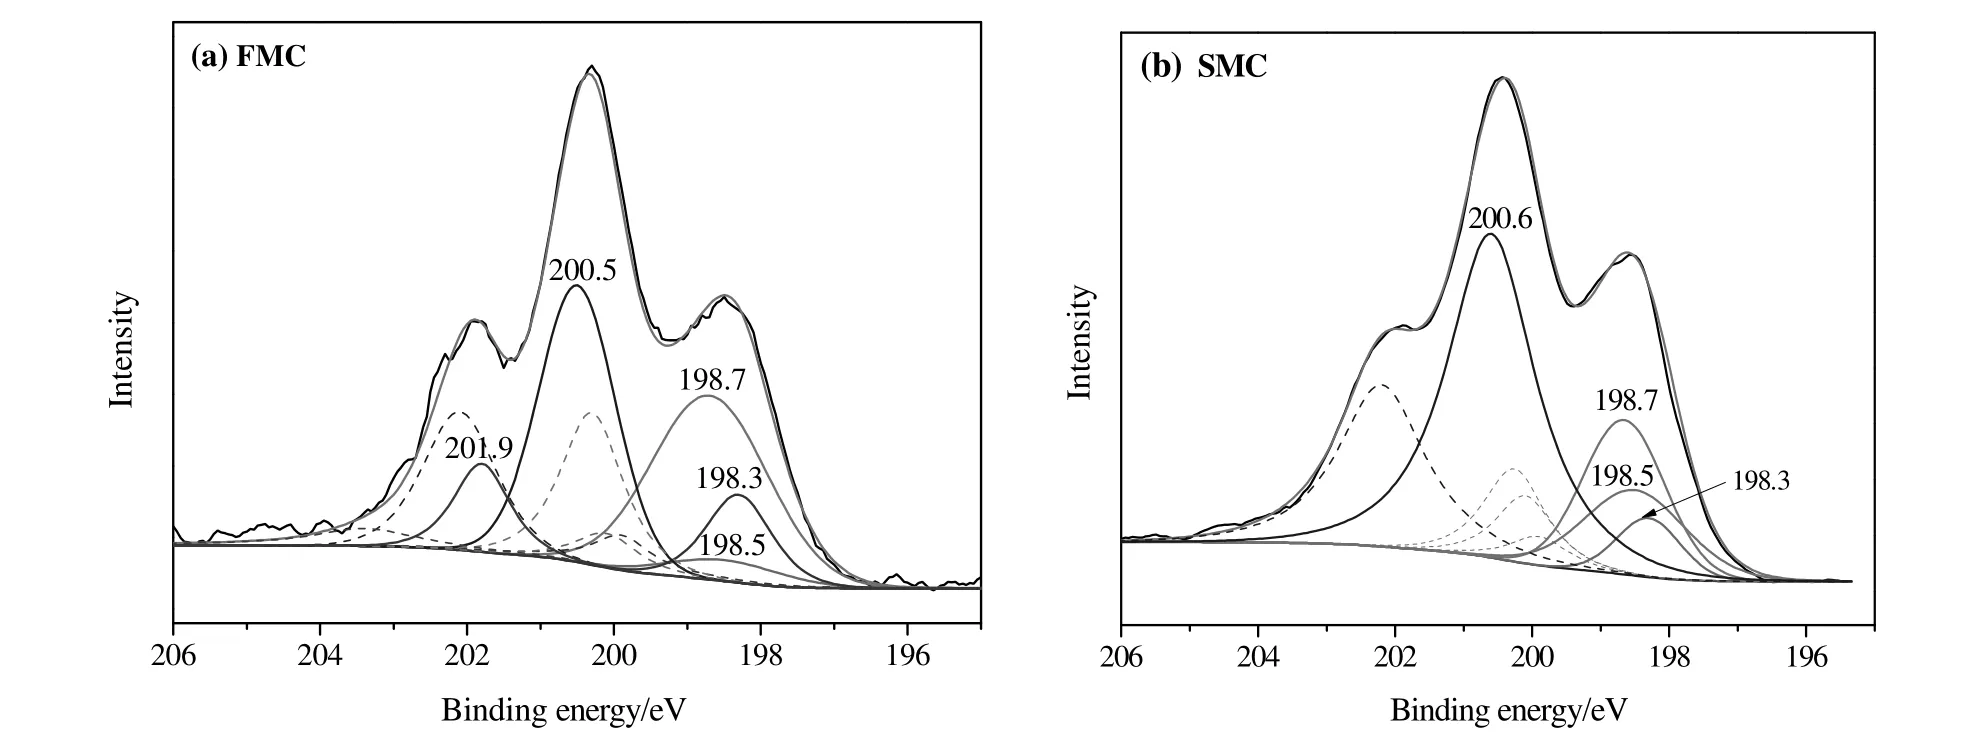
Fig.8.Cl 2p XPS spectra for the samples tested(a)FMC and(b)SMC.

Fig.9.Hg 4f(solid lines)and Si 2p(dash lines)XPS spectra for the samples tested(a)FMC and(b)SMC.
The XPS spectra of O 1s for FMC and SMC can be deconvoluted into four components Al2O3,SiO2,C--O--C and H2O(Fig.7 and Table 3).The presence of Al2O3and SiO2has been validated previously.C--O--C group is ascribed to the functional group on AC,corresponding to the analyses of FTIR and XPS spectra of C 1s.The existence of H2O is explained by the water absorbed by AC.
The Cl 2p spectra could be split into doublet-peaks(Cl 2p3/2 and Cl 2p1/2)with energy separation being 1.6 eVand intensity ratio being 2:1[51,52](Fig.8).According to Table 3,the contents of NaCl/KCl also slightly decreased after catalyst deactivation.The peak at 198.5 eV for FMC could be ascribed to Hg2Cl2.The presence of Hg2Cl2on the fresh HgCl2catalysts has been validated[53].In fact,based on the preparation conditions for FMC we can propose the following reaction,
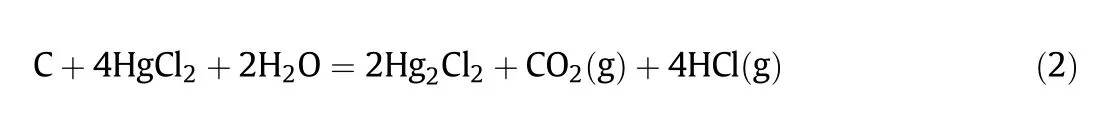
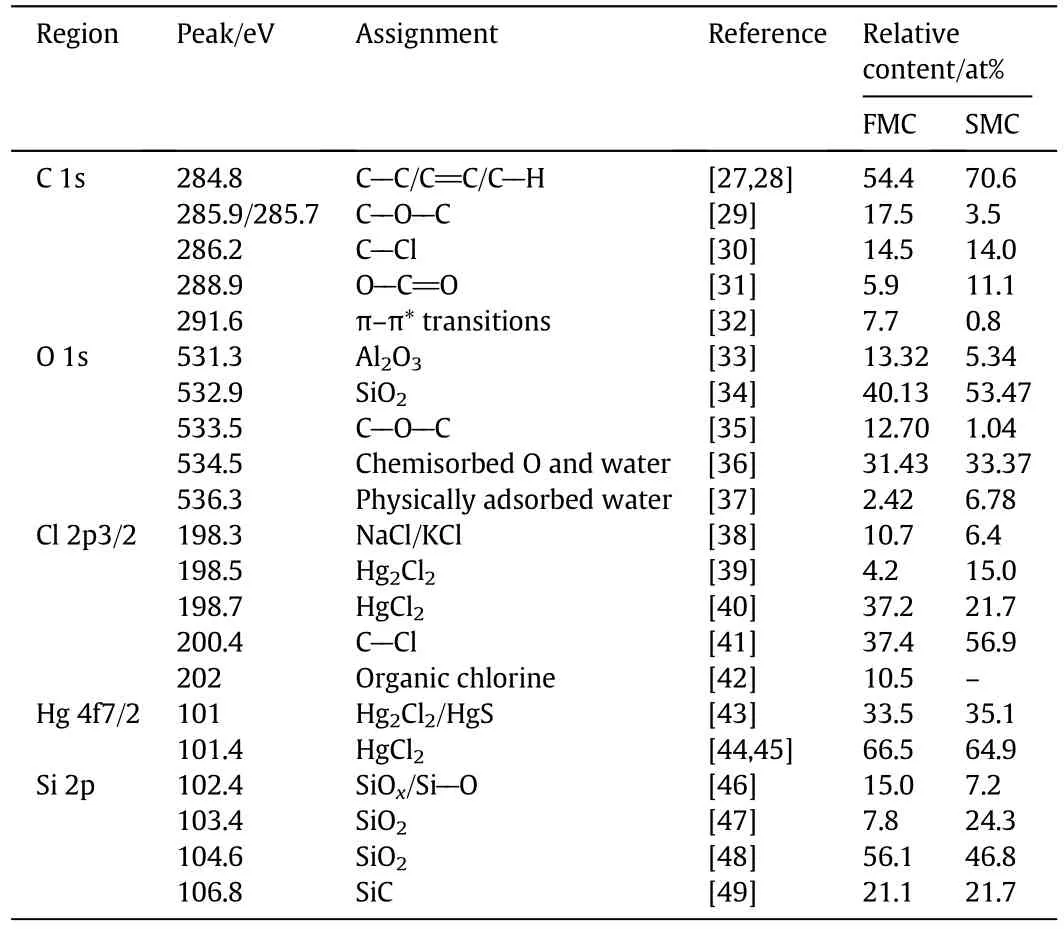
Table 3 Deconvolution results of the regions ofC 1s,O 1s,Cl2p3/2,Hg 4f7/2 and Si2p for FMC and SMC
Eq.(2)is feasible in thermodynamics when the temperature is higher than 50°C.In general,SMC was prepared by soaking AC with HgCl2solution at the temperature around 85-90°C[53].Thus,HgCl2may react with C and H2O to form Hg2Cl2during the preparation of catalysts.Compared with FMC,The relative content of Hg2Cl2for SMC increased around 10.8%,which was likely due to the reduction of HgCl2.This was also in accordance with the decrease of the content of HgCl2after catalyst deactivation.It has been reported that HgCl2could be reduced to Hg2Cl2by excess acetylene in the process of catalytic reaction[53].The peak at 200.4 eV was assigned to C--Cl species showing in both FMC and SMC,corresponding to the results of C 1s spectra.Significant increase(~20 at%)of the relative content of C--Cl group was observed after catalyst deactivation.This may be caused by the generation of organic carbon deposition.The peak at 202 eV was assigned to chlorine species associated with functional groups(e.g.carboxylic,phenyl,carbonyl)on AC[42].They were present on FMC but were not shown on SMC.The shifts of some functional groups on AC after catalyst deactivation based on the FTIR analysis may be related to the change of these chlorine species.
The photoelectron spectra of Hg4f clearly showed two doubletpeaks,the spin-orbit splitting of Hg4f was 4.1 eV and intensity ratio was about 4:3(Hg4f7/2:Hg4f3/2)[54,55](Fig.9 and Table 3).For FMC,the peak at 101 eV can be assigned to Hg2Cl2,which has been observed in the Cl 2p spectra of FMC.While for SMC,the peak at 101 eV may correspond to both Hg2Cl2and HgS as it is difficult to decon volute the peak areas for HgS and Hg2Cl2,which overlap at around 101 eV.The peak of Hg 4f7/2 at 101.4 eV was attributed to HgCl2.The relative content of HgCl2slightly decreased and simultaneously the relative content of Hg2Cl2/HgS increased after catalyst deactivation.Based on our previous study,around 56.4 wt%of total mercury for spent low-level mercury catalysts was ascribed to HgCl2using sequential extraction procedure[16].Only 64.9 at%of HgCl2was observed on SMC in this study,which further confirmed that HgCl2was not the single mercury compound on spent catalysts.
The spectra of Si 2p overlap with the spectra ofHg 4fas their binding energy was close.The Si 2p spectra could be further divided into four peaks.The peaks at102.4,103.4 and 104.6 eV were ascribed to SiO2,corresponding to the results of XRD and SEM-EDS analyses.
3.4.Textural property characterization
The N2adsorption-desorption isotherms of AC,FMC,SMC and SMCP are shown in Fig.10.It is worth noting that AC,FMC and SMC are the original cylindrical samples.In order to compare the difference of the exterior and inner surfaces of SMC,the powdery SMC(SMC-P)also was subject to BET analysis.It can be seen from Fig.10 that the four samples exhibited type I adsorption isotherms according to the IUPAC classification,indicating that the samples are micro porous[56,57].The N2uptakes for spent catalysts(SMC and SMC-P)were significantly lower than FMC,suggesting the serious blockage of pores on AC after catalyst deactivation.The N2uptake for SMC could hardly be found,implying that the exterior surface of SMC was nearly completely blocked.The slightly higher N2uptake for SMC-P than SMC indicated that some pores were still present in the inner surface of SMC.
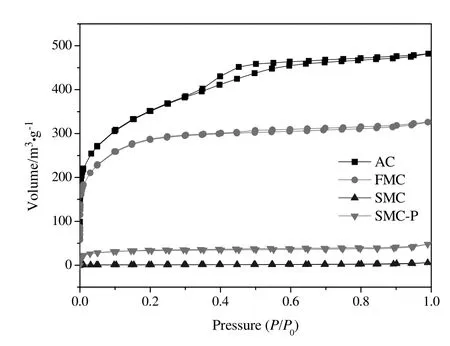
Fig.10.Nitrogen adsorption-desorption isotherms of the samples examined.
The textural properties of the samples are presented in Table 4.Compared with FMC,the specific surface area of AC decreased from 1244 to 1038 m2·g-1,total pore volume reduced from 0.75 to 0.50 cm3·g-1and average pore diameter decreased from 2.39 nm to 1.94 nm.This can be explained by the adsorption of HgCl2and other metal chlorides on AC.The surface area greatly decreased from 1039 m2·g-1for FMC to 3 m2·g-1for SMC,ascribing to the severe loss of pores on AC.This also can be seen from the change of pore parameters.The textural property of SMC-P was slight superior than that of SMC,indicating that some pores were not blocked in the inner surface of SMC.
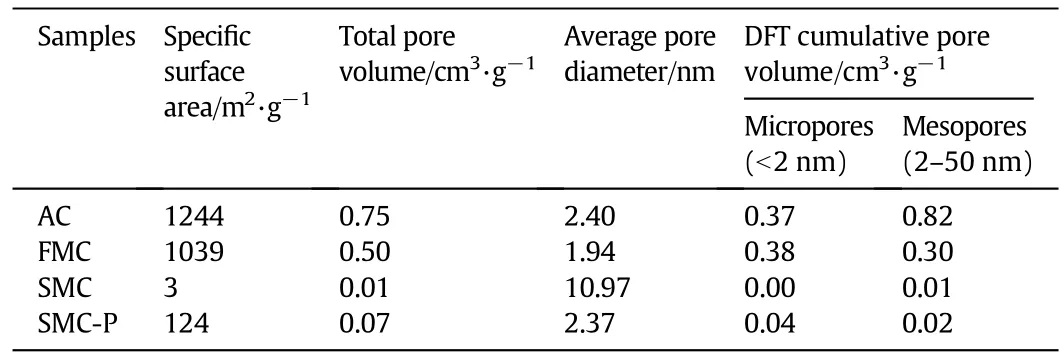
Table 4 BET surface and pore parameters of the four samples
The pore size distributions of the four samples are shown in Fig.11 and the DFT cumulative pore volume is shown in Table 4.The pores on AC mainly concentrated in the microporous range of 0.9-2 nm and mesoporous range of 2-5 nm.The pores on AC in the range of 2-5 nm reduced obviously after supporting with HgCl2,indicating that HgCl2was absorbed in the mesoporous range of 2-5 nm.Compared with FMC,both volumes of micropores and mesopores for SMC significantly decreased.
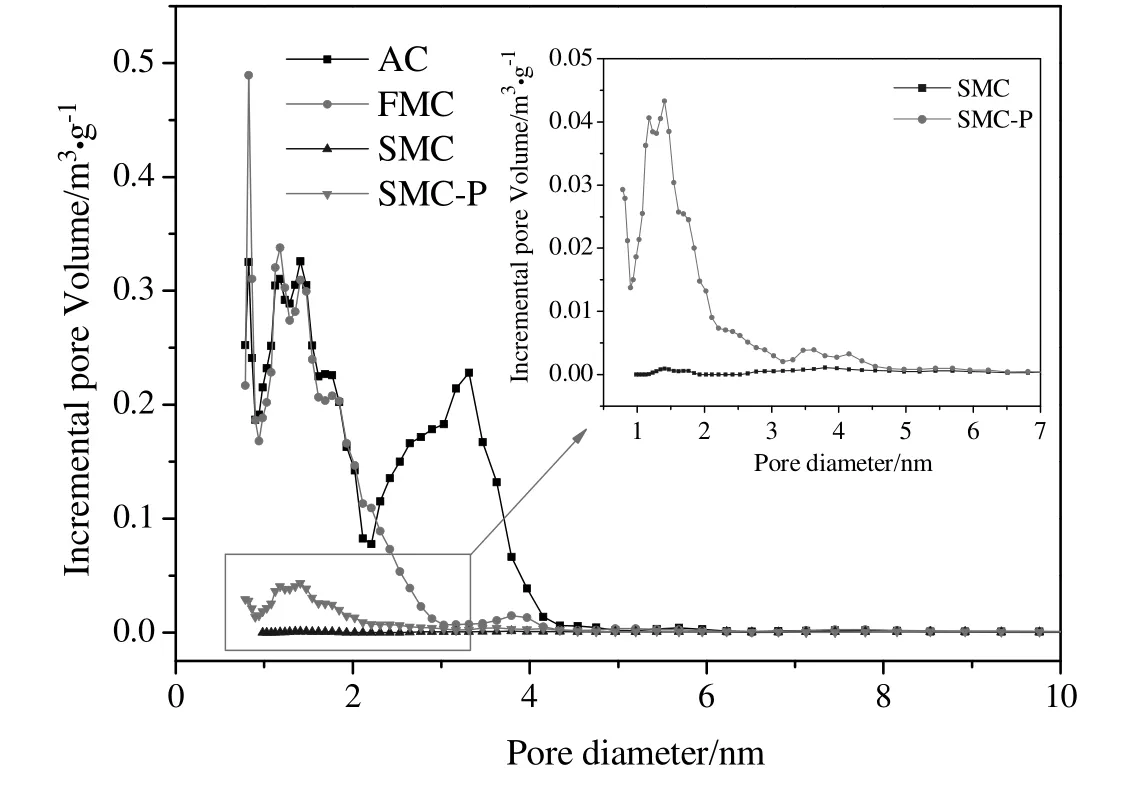
Fig.11.DFT pore size distributions of the samples AC,FMC,SMC and SMC-P.
The specific surface areas of both SMC and SMC-P decreased drastically compared with AC,indicating the serious pore blockage of both inner and exterior surfaces of catalysts.It can be observed that the specific surface area increased slightly from 3 to 124(m2·g-1)after the spent catalysts were grounded.In addition,it also can be seen from Fig.11 that some pores in 0.9-5 nm for SMC-P still can be observed,while there is nearly no remaining pores in SMC.This indicated that the pore blockage on the out layer of catalysts may hinder the adsorption of nitrogen especially in the pores of 0.9-5 nm in textural property analysis.
3.5.GC–MS analysis
According to previous analysis,it has been concluded that carbon deposition is mainly responsible for the pore loss of catalysts.Therefore,the GC-MS analysis was conducted to further study the nature of carbon deposition.The potential organic components based on GC-MS results are shown in Table 5.It can be seen that the main species extracted from SMC are chlorine-containing organics,which were due to the occurrence of side reactions during the catalyst reaction.The formation mechanisms of some organic products may be inferred by the following reactions,
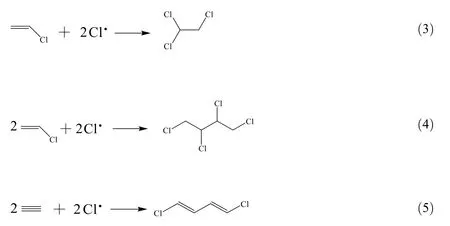
These three organics were derived from chloroethylene and acetylene.Chlorine free radical from the feed gas hydrogen chloride can trigger these side reactions.In addition,the presence ofC8H17ClO2Si,C10H9ClO2and C7H9ClO was related to C--O and Si--O--Si groups on catalysts.C4H6Cl5OP was associated with the phosphorous impurities from feed gas.The organics may be generated and embedded in the pores of AC.The side reactions also can happen outside the catalysts and the organic products were absorbed on the exterior surface ofcatalysts.This will obstruct the diffusion of reactants and products in the pores of AC.It is worth noting that the fine dust caused by mechanical failure of catalysts(e.g.attrition and erosion)and granular carbon formed by the reduction of acetylene may also contribute to the blockage of pores on AC.
4.Conclusions
Deactivated low-level mercury catalysts were characterized by the combined utilization of XRD,SEM-EDS,FTIR,XPS,BET and GC-MS analysis.HgCl2was absorbed on the mesopores ofAC in the range of2-5 nm.Morphologic analysis showed that active components were still uniformly distributed on the surface of spent catalysts.No distinct change on the kinds of functional groups on AC was seen after catalyst deactivation.Pore blockage,the coverage of active sites caused by carbon deposition and HgCl2loss caused by volatilization,reduction and poisoning of elements S and P are responsible for the catalyst deactivation.
[1]X.Li,X.Pan,L.Yu,P.Ren,X.Wu,L.Sun,F.Jiao,X.Bao,Silicon carbide-derived carbon nanocomposite as a substitute for mercury in the catalytic hydrochlorination of acetylene,Nat.Commun.5(2014)3688.
[2]L.Zhi,Y.Li,H.Tang,H.Liu,W.Pei,Deactivation mechanism of low-mercury catalyst for acetylene hydrochlorination,Chem.React.Eng.Technol.31(2015)343-351(in Chinese).
[3]T.Yu,D.Lu,J.Fu,Content analysis of mercurous chloride in low mercury catalysts,Ind.Catal.23(2015)219-221(in Chinese).
[4]G.J.Hutchings,Vapor phase hydrochlorination of acetylene:correlation of catalytic activity of supported metal chloride catalysts,J.Catal.96(1985)292-295.
[5]N.A.Prokudina,V.V.Chesnokov,B.P.Zolotolvskii,L.N.Yelesina,V.G.Yenakaeva,V.F.Tarasov,Stud.Surf.Sci.Catal.75(1993)2451-2454.
[6]Chinese Ministry of Industry and Information Technology,The report about the integrated prevention and treatment scheme for mercury pollution from PVC production industry using calcium carbide method,https://www.miit.gov.cn/n1146295/n1146592/n1146754/n1235000/n1235031/n1235032/n1235034/c3165244/content.html 2017(accessed 18.01.17).
[7]Q.L.Song,S.J.Wang,B.X.Shen,J.G.Zhao,Palladium-based catalysts for the hydrochlorination of acetylene:reasons for deactivation and its regeneration,Pet.Sci.Technol.28(2010)1825-1833.
[8]B.Dai,Q.Wang,F.Yu,M.Zhu,Effect of Au nano-particle aggregation on the deactivation ofthe AuCl3/AC catalyst for acetylene hydrochlorination,SciRep 5(2015)10553.
[9]Chinese National Standard,Low-level mercury catalyst for chloroethylene synthesis,2015(GB/T 31530-2015).
[10]C.Liu,J.H.Peng,A.Y.Ma,L.B.Zhang,J.Li,Study on non-isothermal kinetics of the thermal desorption of mercury from spent mercuric chloride catalyst,J.Hazard.Mater.322(2017)325-333.
[11]M.Bentley,M.Fan,B.Dutcher,M.Tang,M.D.Argyle,A.G.Russell,Y.Zhang,M.P.Sharma,S.M.Swapp,Catalytic regeneration of mercury sorbents,J.Hazard.Mater.262(2013)642-648.
[12]X.Xu,J.Zhao,C.Lu,T.Zhang,X.Di,S.Gu,X.Li,Improvement of the stability of Hg/AC catalysts by CsCl for the high-temperature hydro chlorination of acetylene,Chin.Chem.Lett.27(2016)822-826.
[13]J.W.Anthony,R.A.Bideaux,K.W.Bladh,M.C.Nichols,Handbook of Mineralogy,Mineral Data Publishing,Tucson,1990.
[14]V.N.Selivanov,G.M.Plavnik,E.D.Glazunova,I.I.Kurlyandskaya,V.I.Yakerson,X-ray study of the dispersion and pore structure of the HgCl2-active carbon catalytic system,Russ.Chem.Bull.38(1989)2222-2226.
[15]Y.C.Xie,Y.Q.Tang,Spontaneous monolayer dispersion of oxides and salts onto surfaces of supports:applications to heterogeneous catalysis,Adv.Catal.37(1990)1-43.
[16]Y.C.Xie,N.F.Yang,Y.J.Liu,Y.Q.Tang,Spontaneous dispersion of some active components onto the surfaces of carriers,Sci.China B 26(1983)337-350.
[17]S.Tong,M.Fan,L.Mao,C.Q.Jia,Sequential extraction study of stability of adsorbed mercury in chemically modified activated carbons,Environ.Sci.Technol.45(2011)7416-7421.
[18]Z.Xue,Mercury Pollution Control of PVC Production by Calcium Carbide Method,China Chlor-Alkali,2011,25-31(in Chinese).
[19]D.Lu,Study on Deactivation of the Mercuric Chloride Catalyst(Academic dissertation)Beijing Institute of Clothing Technology,2015(in Chinese).
[20]V.Gómez-Serrano,F.Piriz-Almeida,C.J.Durán-Valle,J.Pastor-Villegas,Formation of oxygen structures by air activation.A study by FT-IR spectroscopy,Carbon 37(1999)1517-1528.
[21]N.Muhammad,S.Maitra,I.Ul Haq,M.Farooq,Some studies on the wear resistance of artificial teeth in presence of amorphous SiO2and TiO2fillers,Cerâmica 57(2011)324-328.
[22]S.Hirose,T.Hatakeyama,Y.Izuta,H.Hatakeyama,TG-FTIR studies on lignin-based polycaprolactones,J.Therm.Anal.Calorim.70(2002)853-860.
[23]P.J.Pan,Z.C.Liang,B.Zhu,T.Dong,Y.Inoue,Blending effects on polymorphic crystallization of poly(L-lactide),Macromolecules 42(2009)3374-3380.
[24]B.Pawelec,R.Mariscal,R.M.Navarro,S.van Bokhorst,S.Rojas,J.L.G.Fierro,Hydrogenation of aromatics over supported Pt-Pd catalysts,Appl.Catal.A Gen.225(2002)223-237.
[25]D.T.Allen,E.J.Palen,M.I.Haimov,S.V.Hering,J.R.Young,Fourier transform infrared spectroscopy of aerosol collected in a low pressure impactor(LPI/FTIR):Method development and field calibration,Aerosol Sci.Technol.21(1994)325-342.
[26]X.Tan,M.Fang,C.Chen,S.Yu,X.Wang,Counterion effects of nickel and sodium dodecyl benzene sulfonate adsorption to multi walled carbon nanotubes in aqueous solution,Carbon 46(2008)1741-1750.
[27]G.M.Veith,L.Baggetto,L.A.Adamczyk,B.Guo,S.S.Brown,X.G.Sun,A.A.Albert,J.R.Humble,C.E.Barnes,M.J.Bojdys,S.Dai,N.J.Dudney,Electrochemical and solid-state lithiation of graphitic C3N4,Chem.Mater.25(2013)503-508.
[28]J.Y.Cheon,J.H.Kim,J.H.Kim,K.C.Goddeti,J.Y.Park,S.H.Joo,Intrinsic relationship between enhanced oxygen reduction reaction activity and nanoscale work function of doped carbons,J.Am.Chem.Soc.136(2014)8875-8878.
[29]T.He,Z.Yang,R.Chen,J.Wang,Y.Leng,H.Sun,N.Huang,Enhanced endothelialization guided by fibronectin functionalized plasma polymerized acrylic acid film,Mater.Sci.Eng.C 32(2012)1025-1031.
[30]H.Wang,J.Huang,K.Zhang,Y.Yu,K.Liu,G.Yu,S.Deng,B.Wang,Effects of zerovalent metals together with quartz sand on the mechanochemical destruction of dechlorane plus coground in a planetary ball mill,J.Hazard.Mater.264(2014)230-235.
[31]D.Zhao,G.Sheng,C.Chen,X.Wang,Enhanced photocatalytic degradation of methylene blue under visible irradiation on graphene@TiO2dyade structure,Appl.Catal.B Environ.111-112(2012)303-308.
[32]Y.C.Chiang,C.Y.Lee,H.C.Lee,Surface chemistry of polyacrylonitrile-and rayonbased activated carbon fibers after post-heat treatment,Mater.Chem.Phys.101(2007)199-210.
[33]A.V.Naumkin,A.Kraut-Vass,S.W.Gaarenstroom,C.J.Powell,NIST X-ray photoelectron spectroscopy database-NIST standard reference database 20,version 4.1.2017(accessed 18.01.17),https://srdata.nist.gov/xps/XPSDetailPage.aspx?AllDataNo=22136.
[34]A.V.Naumkin,A.Kraut-Vass,S.W.Gaarenstroom,C.J.Powell,NIST X-ray photoelectron spectroscopy database-NIST standard reference database 20,version 4.1.2017(accessed 18.01.17),https://srdata.nist.gov/xps/XPSDetailPage.aspx?AllDataNo=22099.
[35]A.Swiatkowski,M.Pakula,S.Biniak,M.Walczyk,In fluence of the surface chemistry of modi fied activated carbon on its electrochemical behaviour in the presence of lead(II)ions,Carbon 42(2004)3057-3069.
[36]A.M.Puziy,O.I.Poddubnaya,R.P.Socha,J.Gurgul,M.Wisniewski,XPS and NMR studies of phosphoric acid activated carbons,Carbon 46(2008)2113-2123.
[37]P.Burg,P.Fydrych,D.Cagniant,G.Nanse,J.Bimer,A.Jankowska,The characterization of nitrogen-enriched activated carbons by IR,XPS and LSER methods,Carbon 40(2002)1521-1531.
[38]N.Tsubouchi,N.Ohtaka,Y.Ohtsuka,Reactions of hydrogen chloride with carbonaceous materials and the formation of surface chlorine species,Energy Fuel 30(2016)2320-2327.
[39]A.V.Naumkin,A.Kraut-Vass,S.W.Gaarenstroom,C.J.Powell,NIST X-ray photoelectron spectroscopy database-NIST standard reference database 20,version 4.1.2017(accessed 18.01.17),https://srdata.nist.gov/xps/XPSDetailPage.aspx?AllDataNo=24132.
[40]Z.Tan,L.Sun,J.Xiang,H.Zeng,Z.Liu,S.Hu,J.Qiu,Gas-phase elemental mercury removal by novel carbon-based sorbents,Carbon 50(2012)362-371.
[41]J.Wang,B.L.Deng,H.Chen,X.R.Wang,J.Z.Zheng,Removal of aqueous Hg(II)by polyaniline:sorption characteristics and mechanisms,Environ.Sci.Technol.43(2009)5223-5228.
[42]J.J.Mahle,G.W.Peterson,B.J.Schindler,P.B.Smith,J.A.Rossin,G.W.Wagner,Role of TEDA as an activated carbon impregnant for the removal of cyanogen chloride from air streams:Synergistic effect with Cu(II),J.Phys.Chem.C 114(2010)20083-20090.
[43]A.V.Naumkin,A.Kraut-Vass,S.W.Gaarenstroom,C.J.Powell,NIST X-ray photoelectron spectroscopy database-NIST standard reference database 20,version 4.1.2017(accessed 18.01.17),https://srdata.nist.gov/xps/EngElmSrchQuery.aspx?EType=PE&CSOpt=Retri_ex_dat&Elm=Hg.
[44]E.Sasmaz,A.Kirchofer,A.D.Jew,A.Saha,D.Abram,T.F.Jaramillo,J.Wilcox,Mercury chemistry on brominated activated carbon,Fuel 99(2012)188-196.
[45]R.S.Vieira,M.L.M.Oliveira,E.Guibal,E.Rodríguez-Castellón,M.M.Beppu,Copper,mercury and chromium adsorption on natural and crosslinked chitosan films:An XPS investigation of mechanism,Colloids Surf.A Physicochem.Eng.Asp.374(2011)108-114.
[46]K.C.Chiang,T.E.Hsieh,Characteristics of AgInSbTe-SiO2nanocomposite thin film applied to nonvolatile floating gate memory devices,Nanotechnology 21(2010)425204.
[47]A.V.Naumkin,A.Kraut-Vass,S.W.Gaarenstroom,C.J.Powell,NIST X-ray photoelectron spectroscopy database-NIST standard reference database 20,version 4.1.2017(accessed 18.01.17),https://srdata.nist.gov/xps/XPSDetailPage.aspx?AllDataNo=24845.
[48]H.Wang,J.Fang,T.Cheng,J.Ding,L.Qu,L.Dai,X.Wang,T.Lin,One-step coating of fluoro-containing silica nanoparticles for universal generation of surface superhydrophobicity,Chem.Commun.(Camb.)(2008)877-879.
[49]S.Hassan,M.S.Yusof,Z.Embong,M.I.Maksud,Angle resolved X-ray photoelectron spectroscopy(ARXPS)analysis of lanthanum oxide for micro- flexography printing,AIP Conf.Proc.1704(2016),040002.
[50]S.Tao,C.Li,X.Fan,G.Zeng,P.Lu,X.Zhang,Q.Wen,W.Zhao,D.Luo,C.Fan,Activated coke impregnated with cerium chloride used for elemental mercury removal from simulated flue gas,Chem.Eng.J.210(2012)547-556.
[51]H.Piao,K.Adib,Z.Chang,J.Hrbek,M.Enever,M.A.Barteau,Multistep reaction processes in epoxide formation from 1-chloro-2-methyl-2-propanol on Ag(110)revealed by TPXPS and TPD experiments,J.Phys.Chem.B 107(2003)13976-13985.
[52]E.Liu,B.Sarkar,Z.Chen,R.Naidu,Decontamination of chlorine gas by organic amine modi fied copper-exchanged zeolite,Microporous Mesoporous Mater.225(2016)450-455.
[53]M.S.Cong,H.Jiang,J.Z.Gui,Y.F.Ren,L.J.Song,Improvements on the mercuric chloride catalysts used for the synthesis of vinyl chloride from acetylene,Polyvinyl Chloride(2007)25-27(in Chinese).
[54]P.Behra,P.Bonnissel-Gissinger,M.Alnot,R.Revel,J.J.Ehrhardt,XPS and XAS study of the sorption of Hg(II)onto pyrite,Langmuir 17(2001)3970-3979.
[55]N.D.Hutson,B.C.Attwood,K.G.Scheckel,XAS and XPS characterization of mercury binding on brominated activated carbon,Environ.Sci.Technol.41(2007)1747-1752.
[56]S.J.Gregg,K.S.W.Sing,Adsorption,Surface Area and Porosity,2nd ed.Academic Press,London,1982,56-86.
[57]C.G.Sonwane,S.K.Bhatia,Characterization of pore size distributions of mesoporous materials from adsorption isotherms,J.Phys.Chem.B 104(2000)9099-9110.
杂志排行
Chinese Journal of Chemical Engineering的其它文章
- Insight into fouling behavior of poly(vinylidene fluoride)(PVDF)hollow fiber membranes caused by dextran with different pore
- Protein adsorption onto diethylaminoethyl dextran modi fied anion exchanger:Effect of ionic strength and column behavior☆
- Gas emission source term estimation with 1-step nonlinear partial swarm optimization-Tikhonov regularization hybrid method☆
- Dissolution of antibiotics mycelium in ionic liquids:Performance and mechanism☆
- Kinetic studies on extra heavy crude oilupgrading using nanocatalysts by applying CFD techniques☆
- Effect of the operation parameters on the Fischer-Tropsch synthesis in fluidized bed reactors☆