Assessing satellite-derived net surface radiative flux in the Arctic
2018-05-24SONGMiRongndLIUJiPing
SONG Mi-Rong nd LIU Ji-Ping,b
aState Key Laboratory of Numerical Modeling for Atmospheric Sciences and Geophysical Fluid Dynamics, Institute of Atmospheric Physics,Chinese Academy of Sciences, Beijing, China; bDepartment of Atmospheric and Environmental Sciences, University at Albany, State University of New York, Albany, NY, USA
1. Introduction
Accurate knowledge of net radiative flux at the surface is critical for understanding and simulating climate variations. This is particularly true in the Arctic, where significant changes are occurring (e.g. Richter-Menge, Overland, and Mathis, 2016). The Arctic has seen amplified warming associated with a rapid decline in sea ice since the satellite era(e.g. Cavalieri and Parkinson 2012; Stroeve et al. 2012). The net surface radiative flux (NETSRF) in the Arctic differs from that in extratropical regions. The absorbed solar radiation at the surface is strongly in fluenced by the presence of seasonal sea ice. Sea ice has a high albedo, which re flects most of the incoming solar radiation. Changes in sea-ice albedo in turn affect the surface energy budget, as well as seaice coverage. The sea-ice-albedo–temperature feedback is considered to be a dominant contributor to the rapid decline in Arctic sea ice (e.g. Curry, Schramm, and Ebert 1995). The Arctic has frequent and extensive clouds, especially mixed-phase clouds, which have a net heating effect at the surface by altering downward longwave radiation(e.g. Curry et al. 1996; Wang and Key 2003). Cloud-related processes have been also linked to the recent decline in Arctic sea ice, i.e. increased cloud cover contributes to increased downward longwave radiation (e.g. Kay and Gettelman 2009; Kim et al. 2017).
Satellite observations have greatly improved our ability to estimate NETSRF in the Arctic, although they rely on indirect determination via calculations using a radiative transfer model and input variables derived from satellite observations. However, the accuracy of satellite-based NETSRF over the Arctic is not well-characterized compared to that of extrapolar regions. This contributes to large uncertainty in estimates of surface energy budgets and climate variability in the Arctic. Some progress has been made in determining the accuracy of surface radiative fluxes in the Arctic. Studies in the late 1990s suggested that the range of surface radiative fluxes among different datasets is very large (e.g. Serreze et al. 1998). Liu et al.(2005) showed that satellite-derived products might provide downward shortwave and longwave radiation with a mean bias of ~40 W m−2and ~30 W m−2, respectively. The satellite-derived downward shortwave radiation is more accurate than that of numerical weather prediction reanalysis, because better cloud properties are used in the satellite-based products relative to the reanalysis. Niu,Pinker, and Cronin (2010) evaluated the shortwave radiative flux derived from the Moderate Resolution Imaging Spectroradiometer (MODIS) at the land surface in the northern high latitudes, and indicated that the shortwave radiation of MODIS is in better agreement with observations than that of numerical models.
Recently, with the efforts of several research groups,improved and extended satellite-derived products of surface radiative fluxes have been released (e.g. Key et al.2016; Stackhouse Jr. et al. 2011; Zhang et al. 2004). The purpose of this paper is to extend previous studies to evaluate the accuracy and uncertainty of NETSRF over the Arctic for recent satellite-derived products using assembledin situmeasurements.
2. Data
2.1. Satellite data
The NETSRF over the Arctic is calculated for the following three satellite-based products using their surface downward and upward shortwave and longwave radiative fluxes(surface radiative fluxes for all-sky conditions are used in this study):
Surface Radiation Budget project (SRB): The shortwave and longwave radiative fluxes are calculated using a radiative transfer model (Fu et al. 1997; Pinker and Laszlo 1992),with cloud parameters from the International Satellite Cloud Climatology Project (ISCCP), meteorological variables from the Goddard Earth Observing System of NASA’s Global Modeling and Assimilation Office, ozone fields from the Total Ozone Mapping Spectrometer (TOMS), and other ancillary datasets. SRB provides data at 3-h intervals on a 1°latitude–longitude global grid from July 1983 to December 2007 (https://eosweb.larc.nasa.gov/project/srb/srb_table).
ISCCP: Improved shortwave and longwave radiative fluxes (named ISCCP-FD) are calculated by employing a radiative transfer model, with improved global data of cloud and surface properties from ISCCP, atmospheric temperature and humidity from the Television Infrared Observation Satellite Operational Vertical Sounder, column ozone from TOMS, and climatological aerosols from GISS(Zhang et al. 2004). ISCCP provides data at 3-h intervals from July 1983 to December 2009 on an equal-area projection with a 2.5° latitude–longitude spatial resolution(http://isccp.giss.nasa.gov/outgoing/FLUX/SRF/).
Extended AVHRR Polar Path finder (APP-x) version-2: The APP-x data-set has been extended to include retrievals of surface radiative fluxes, cloud information and its radiative effects (cloud forcings). The shortwave and longwave radiative fluxes are calculated in the Cloud and Surface Parameter Retrieval using FluxNet, which is a neural network version of a radiation transfer model named Streamer(Key et al. 2002). Calculations also use the atmospheric temperature and humidity from the NCEP–NCAR reanalysis, as well as ISCCP ozone data. APP-x provides twice-daily data at local solar times of 0400 and 1400 for the period 1982–2014 at a spatial resolution of 25 km on the EASE (Equal-Area Scalable Earth) grid (ftp://stratus.APP-x.wisc.edu/pub/ncdc/appx/data/Polar-APP-X_v01r01_C_1982-2014/).
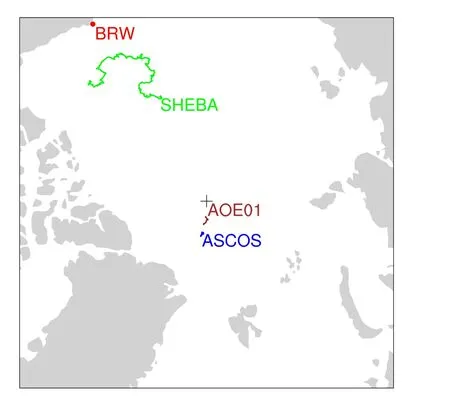
Figure 1. Tracks of in situ measurements, including SHEBA (green curve), AOE01 (brown curve), ASCOS (blue curve), and the location of BRW (red dot).
2.2. In-situ measurements
To assess in detail the differences in regional and high-frequency representations of NETSRF over the Arctic, the following fourin situdatasets are used to evaluate the above three satellite products:
Surface Heat Budget of the Arctic Ocean (SHEBA):SHEBA is a year-long field campaign from October 1997 to October 1998 in the Beaufort and Chukchi seas, in which the Canadian icebreaker DesGroseilliers drifted from (75.42°N, 144.42°W) to (80.33°N, 166.02°W) (Figure 1).SHEBA provides a comprehensive observational data-set(e.g. Persson et al. 2002). Hourly surface shortwave and longwave radiative fluxes from 9 October 1997 to 8 October 1998 are used here.
Arctic Ocean Experiment in 2001 (AOE01): Surface meteorological measurements were made during the AOE01 field campaign in July–August 2001 in the central Arctic Ocean, in which the Swedish icebreaker Oden was moored to an ice floe and drifted from near (89°N, 1.8°E) to(88.2°N, 9.4°W) (Figure 1) (Tjernström et al. 2004). Surface shortwave and longwave radiative fluxes at 5-min intervals during 3–19 August 2001 are obtained to generate hourly averages.
Arctic Summer Cloud Ocean Study in 2008 (ASCOS):Extensive measurements were taken during the ASCOS project in the central Arctic Ocean when an ice camp was set up on 12 August at (87.4°N, 1.5°W) and remained in operation through to 1 September, associated with ice drifting (Figure 1) (Tjernström et al. 2014). Surface shortwave and longwave radiative fluxes at 10-min intervals from 13 August to 1 September 2008 are obtained to generate hourly averages.
Barrow Alaska Observatory (BRW): Measurements close to sea ice have been maintained at the northernmost point of the United States (71.32°N, 156.61°W) (Figure 1) since a weather observing facility was established in 1973 in Barrow (Druckenmiller et al. 2009). Hourly surface shortwave and longwave radiative fluxes from 26 April 1993 to 31 December 2013 are available (http://www.esrl.noaa.gov/gmd/obop/brw/summary.html).
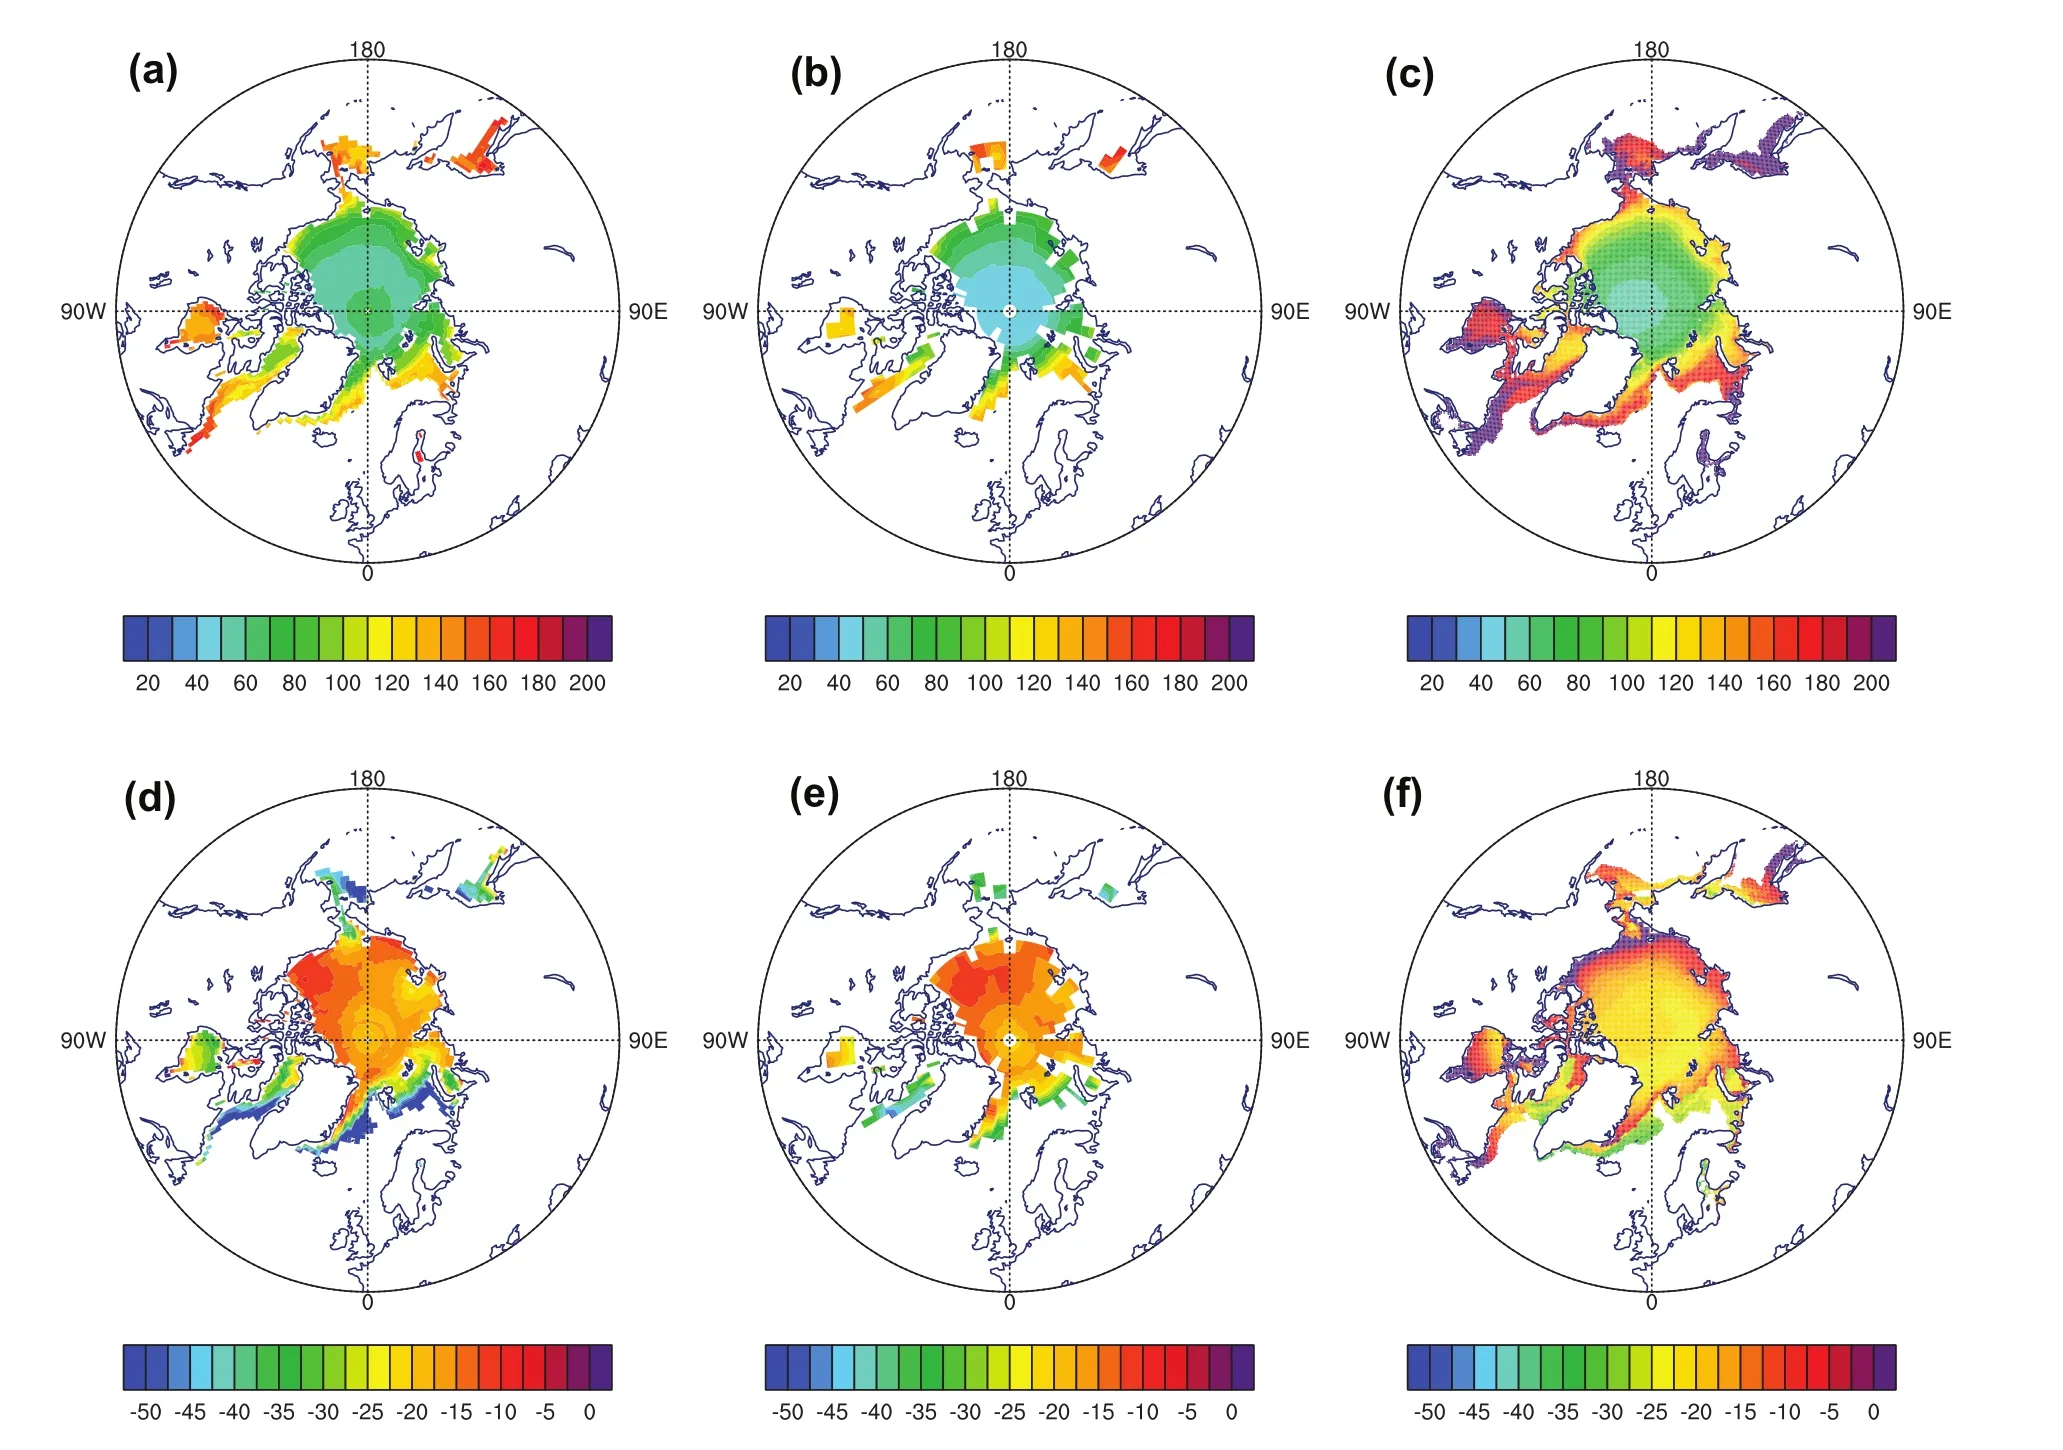
Figure 2. Averaged NETSRF (units: W m−2) during 1984–2007 for (a, d) SRB, (b, e) ISCCP and (c, f) APP-x, in (a–c) May–August and (d–f)September–December. Positive (negative) values mean downward (upward).
3. Results
Figure 2 shows the spatial distribution of the climatology of NETSRF during summer (May, June, July, and August)and autumn-to-winter (September, October, November and December) for the period 1984–2007. During the melting period, SRB shows that there is a net radiation surplus, which decreases poleward by ~50–60 W m−2in the central Arctic Ocean (except a relatively high-value area near the pole with ~55–75 W m−2); ~50–85 W m−2over an arc around the periphery of the Arctic basin, extending from north of Alaska to north of western Siberia; and~90–170 W m−2in the sea-ice edge zone (Figure 2(a)).The pattern of ISCCP’s NETSRF also shows a net radiation surplus decreasing poleward, but the magnitude of the ISCCP’s NETSRF is 10 W m−2less than that of SRB over much of the Arctic Ocean (Figure 2(b)). The two-time average of PP-x also shows a similar NETSRF distribution, but with a larger magnitude of NETSRF than that of SRB and ISCCP(Figure 2(c)). During the freeze-up period, SRB exhibits a net radiation de ficit of ~10–25 W m−2in the Arctic Ocean and ~30–50 W m−2in the sea-ice edge zone (Figure 2(d)).ISCCP’s NETSRF is similar to that of SRB in terms of both the magnitude and pattern, although ISCCP’s NETSRF is~10–20 W m−2larger in the ice-edge zone, especially the North Atlantic sector (Figure 2(e)). The two-time average of APP-x shows a net radiation de ficit of ~15–25 W m−2in the central Arctic, but a smaller radiation loss in the southern Beaufort, Chukchi and eastern Siberia seas (~0–10 W m−2;Figure 2(f)). The SRB and ISCCP data have a 3-h temporal resolution, which can capture the daily cycle. The averaged net surface radiative flux of SRB and ISCCP in Figure 2(a)and (b) is calculated using 3-h data, which represents the daily mean. Unfortunately, the APP-x product provides twice-daily data at 0400 and 1400, local time (LT), which cannot capture the daily cycle. The averaged net surface radiative flux of APP-x in Figure 2(c) is calculated based on the two-time average, which cannot be considered as the daily mean. So, the two-time average of APP-x shows much larger (smaller) values of NETSRF in May–August(September–December) than those of SRB and ISCCP.
Statistical comparisons between the satellite-derived andin situmeasured NETSRF, as well as each flux component, are presented in Table 1, including the bias, rootmean-square error (RMSE), and correlation. The bias, RMSE,and correlation between the satellite products andin situobservations are calculated for the periods that thein situobservations are available. Specifically, SHEBA is from 31 October 1997 to 28 September 1998; AOE01 is from 3–19 August 2001; ASCOS is from 15 August to 1 September 2008; BRW is from 26 April 1993 to 31 December 2007. The statistics are calculated based on the 3-h data of SRB and ISCCP, but the twice-daily data of APP-x. The locations of the comparisons are shown in Figure 1. We extracted the corresponding time series that have the smallest distance relative to thein situobservations.
对照组选择卡泊三醇软膏单用,在用药前,对皮肤做好洁净工作,依据受损面积取适宜的软膏予以涂抹,均匀覆盖损坏的皮肤处为最佳,每天两次,持续治疗三个月。研究组联合采用阿维A胶囊和外用卡泊三醇软膏。对于卡泊三醇的用法用量和药物状况,请参照对照组与其一致,口服阿维A股囊的剂量为10mg/d,餐中顿服,一天一次,每日剂量最多不超过50mg,研究组的疗程长短请参照对照组与其一致,都是三个月,期间监测血常规,肝肾功能。卡波三醇软膏外用,每日两次。在此基础上,根据患者的具体病情、临床表现等给予对症治疗。
Comparison with the SHEBA observations shows that the overall bias of SRB’s NETSRF is 18.4 W m−2(RMSE of43.1 W m−2). The large positive bias is primarily contributed by a large positive bias in the net shortwave flux (21.4 W m−2;Table 1). ISCCP’s NETSRF has a mean bias of 17.1 W m−2(RMSE of 34.9 W m−2), which results from positive biases of both the net shortwave flux (netSW) and net longwave flux(netLW). APP-x’s NETSRF yields a mean bias of 10.6 W m−2(RMSE of 38.2 W m−2). Although the overall bias of APP-x is smaller than those of SRB and ISCCP, it results from a cancelling out of large positive netSW bias (16.9 W m−2) and small-to-moderate negative netLW bias (−6.3 W m−2). Figure 3 is a scatterplot between the satellite-based andin situmeasured NETSRF. We note that, for SRB, there is a spike near 0 W m−2on thex-axis (Figure 3(a)). This means that SRB has a problem capturing the observed small values of NETSRF, and this is also re flected slightly in ISCCP and APP-x(Figure 3(b) and (c)). In addition, APP-x clearly overestimates observed net surface radiative flux greater than ~80 W m−2(Figure 3(c)). Overall, from the aspect of bias, RMSE and correlation, the NETSRF of ISCCP and APP-x are relatively closer to that from SHEBA observations.
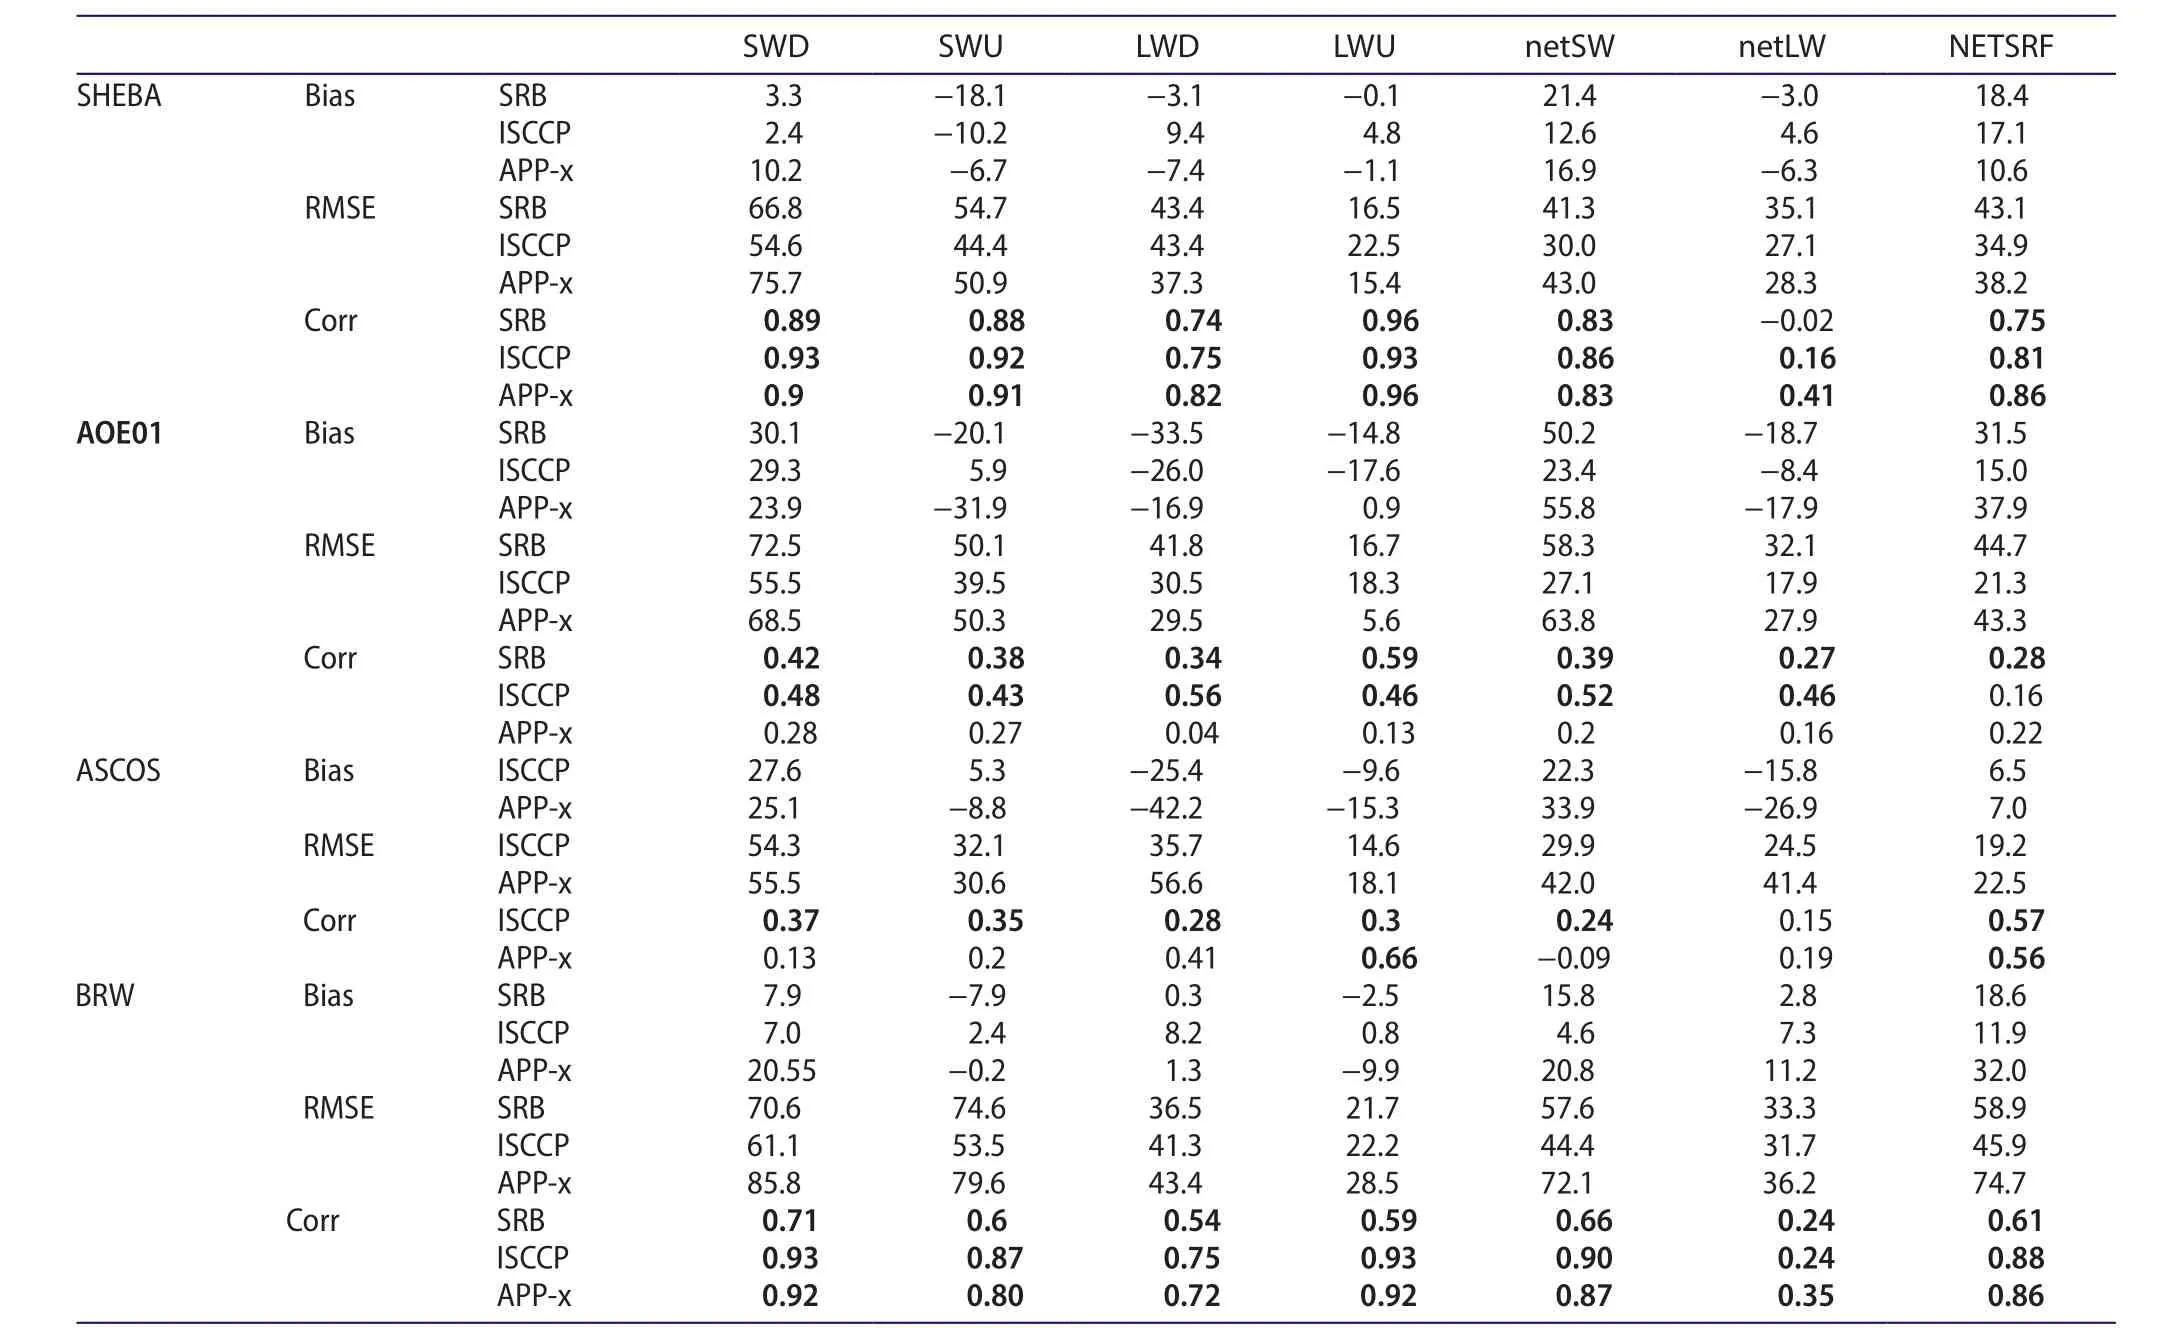
Table 1. Comparisons between the satellite-derived and in situ-measured NETSRF, as well as each flux component, including bias, RMSE,and correlation (bold denotes correlation that is statistically significant at the >99% con fidence level).
Compared with the AOE01 observations, the overall biases of NETSRF for both SRB and APP-x are very large,at 31.5 W m−2for SRB and 37.9 W m−2for APP-x (RMSE of 44.7 W m−2for SRB and 43.3 W m−2for APP-x). Moreover,the very large positive biases result from a cancelling out of excessively large positive net shortwave flux (50.2 W m−2for SRB and 55.8 W m−2for APP-x) and large negative net longwave flux (−18.7 W m−2for SRB and −17.9 W m−2for APP-x). The overall bias of ISCCP’s NETSRF (15.0 W m−2, with an RMSE of 21.3 W m−2) is about two times smaller than those of SRB and APP-x, which results from the cancelling out of large (absolute value greater than 20 W m−2) positive net shortwave flux and moderate (absolute value between 10 W m−2and 20 W m−2) negative net longwave flux. As shown in Figure 3(d), SRB’s NETSRF tends to cluster around 30.0 W m−2on thex-axis for almost allyvalues, which is not present in ISCCP and APP-x. The NETSRF of both ISCCP and APP-x correlates weakly with AOE01, but ISCCP has much higher correlations for both netSW and netLW than those of SRB and APP-x. Overall, the NETSRF of ISCCP is closer to that from AOE01 observations.
Comparison with ASCOS observations shows that ISCCP has a small-to-moderate mean bias of 6.5 W m−2(RMSE of 19.2 W m−2), which is due to the cancelling out of large positive bias in netSW and moderate negative bias in netLW. The mean bias and RMSE of APP-x’s NETSRF are comparable to those of ISCCP, and the mean bias is also derived from the cancelling out of large positive netSW and negative netLW, which are larger than those of ISCCP.The NETSRF of ISCCP and APP-x has similar correlation with ASCOS. Overall, the NETSRF of ISCCP is closer to ASCOS observations in terms of the bias magnitude of each flux component.
SHEBA, AOE01, and ASCOS only provide NETSRF for short-term periods. Therefore, we further assess the accuracy of NETSRF for the three satellite products against the long-term continuous observations of BRW, which is very close to sea ice. Compared with the BRW observations,all three datasets are highly correlated with respect to NETSRF. SRB has a moderate mean bias of 18.6 W m−2,which is primarily derived from the netSW bias. APP-x has a large mean bias of 32.0 W m−2, which is due to the combined biases of netSW and netLW. ISCCP’s NETSRF, meanwhile, has the smallest mean bias (11.9 W m−2) and RMSE(45.9 W m−2) relative to those of SRB and APP-x. Overall,ISCCP gives the best statistics for NETSRF.
Next, we examine the bias by time of day for the satellite-based NETSRF (eight times for SRB and ISCCP; two times for APP-x). Compared to SHEBA, the NETSRF differences by time of day for SRB and ISCCP both show clear diurnal variation, with a large difference between 0400 LT and 1400 LT for APP-x. As shown in Figure 4(a), the largest bias occurs in the early afternoon (32.8 W m−2for SRB,28.7 W m−2for ISCCP, and 21.6 W m−2for APP-x), while the smallest bias occurs after midnight (2.0 W m−2for SRB,8.0 W m−2for ISCCP, and −0.5 W m−2for APP-x). Thus, the range of the bias diurnal variation for SRB is ~10 W m−2larger than that of ISCCP and the two-time difference of APP-x. As shown in Figure 4(b), the large diurnal variation of the netSW bias plays a dominant role in the NETSRF bias diurnal variation for SRB and ISCCP; plus, the two-time large difference of the NETSRF bias also originates from the netSW bias for APP-x. Overall, ISCCP and APP-x are relatively closer to the SHEBA observations.
When compared with AOE01, the NETSRF bias also shows a large diurnal variation for SRB and a large twotime difference for APP-x; whereas, the diurnal variation of the bias is not obvious in ISCCP (Figure 4(d)). For SRB, it is mainly modulated by the large diurnal variation of the netLW bias (Figure 4(f)). For APP-x, it is due to the unbalanced two-time bias for both netSW and netLW (Figure 4(e) and (f)). The range of the bias remains at ~20 W m−2for APP-x (from 27.5 W m−2to 49.9 W m−2), but is greatly enhanced for SRB, reaching ~58 W m−2(from −9.3 W m−2to 48.2 W m−2). By contrast, the bias of ISCCP varies from 7.0 W m−2to 20.8 W m−2. Thus, ISCCP is more accurate for NETSRF against AOE01 observations.
Compared to ASCOS, the NETSRF bias diurnal variation is evident in ISCCP with a range of ~32 W m−2, which primarily results from the large diurnal variation of the netSW bias (Figure 4(h)). By contrast, the bias of APP-x is ~7 W m−2at both times (Figure 4(g)), which is due to the bias balance from netSW and netLW (Figure 4(h) and (i)). Thus, APP-x is in better agreement with ASCOS observations.
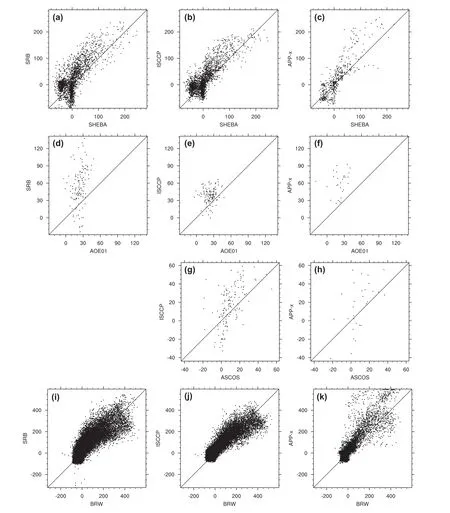
Figure 3. Scatterplots of the satellite-derived NETSRF (y-axis; units: W m−2) against in situ measured net surface radiative flux (x-axis;units: W m−2). (a) SRB vs. SHEBA; (b) ISCCP vs. SHEBA, using data at 3-h intervals; and (c) APP-x vs. SHEBA, using data at 0400 and 1400 LT 31 October 1997 to 28 September 1998. (d) SRB vs. AOE01; (e) ISCCP vs. AOE01, using data at 3-h intervals; and (f) APP-x vs. AOE01, using data at two LTs for 3–19 August 2001. (g) ISCCP vs. ASCOS, using data at 3-h intervals; and (h) APP-x vs. ASCOS, using data at two LTs for 15 August to 1 September 2008. (i) SRB vs. BRW; (j) ISCCP vs. BRW, using data at 3-h intervals; and (k) APP-x vs. BRW, using data at two LTs for 26 April 1993 to 31 December 2007.
As shown in Figure 4(j), the NETSRF bias diurnal variation is also present in ISCCP and SRB, and the two-time difference in the NETSRF bias for APP-x is large, when compared with the long-term BRW observations. The range of the diurnal variation remains at ~20 W m−2for ISCCP, but is enhanced for SRB (47.6 W m−2), which mainly results from the large variation in netSW bias. Also, the two-time difference is large for APP-x (34.4 W m−2), which is modulated by the large bias of netSW (Figure 4(k)). Overall, ISCCP is closer to the BRW observations.
Finally, we examine interannual variability of the NETSRF bias for the three satellite products by taking advantage of more than 20 years of records from the BRW site (1993–2007). The average standard deviations of SRB and ISCCP are close to that of thein situdata in general, and is larger for APP-x when compared to thein situdata. More specifically, the standard deviations of the interannual biases for BRW and the corresponding satellite-derived datasets and their ratios are as follows:BRW, 88.48 W m−2; SRB, 84.70 W m−2; ratio of SRB and BRW,0.957; BRW, 92.01 W m−2; ISCCP, 89.09 W m−2; ratio of ISCCP and BRW, 0.968; BRW, 101.79 W m−2; APP-x, 128.91 W m−2;ratio of APP-x and BRW, 1.267. Moreover, the bias between ISCCP and BRW shows a relatively steady variability (Figure 5), with a standard deviation of 9.59 W m−2for the period 1993–2007. This compares to a standard deviation of 18 W m−2for the SRB and BRW bias, and 14.85 W m−2for the APP-x and BRW bias. On the whole, the NETSRF of ISCCP is more accurate than that of SRB or APP-x.
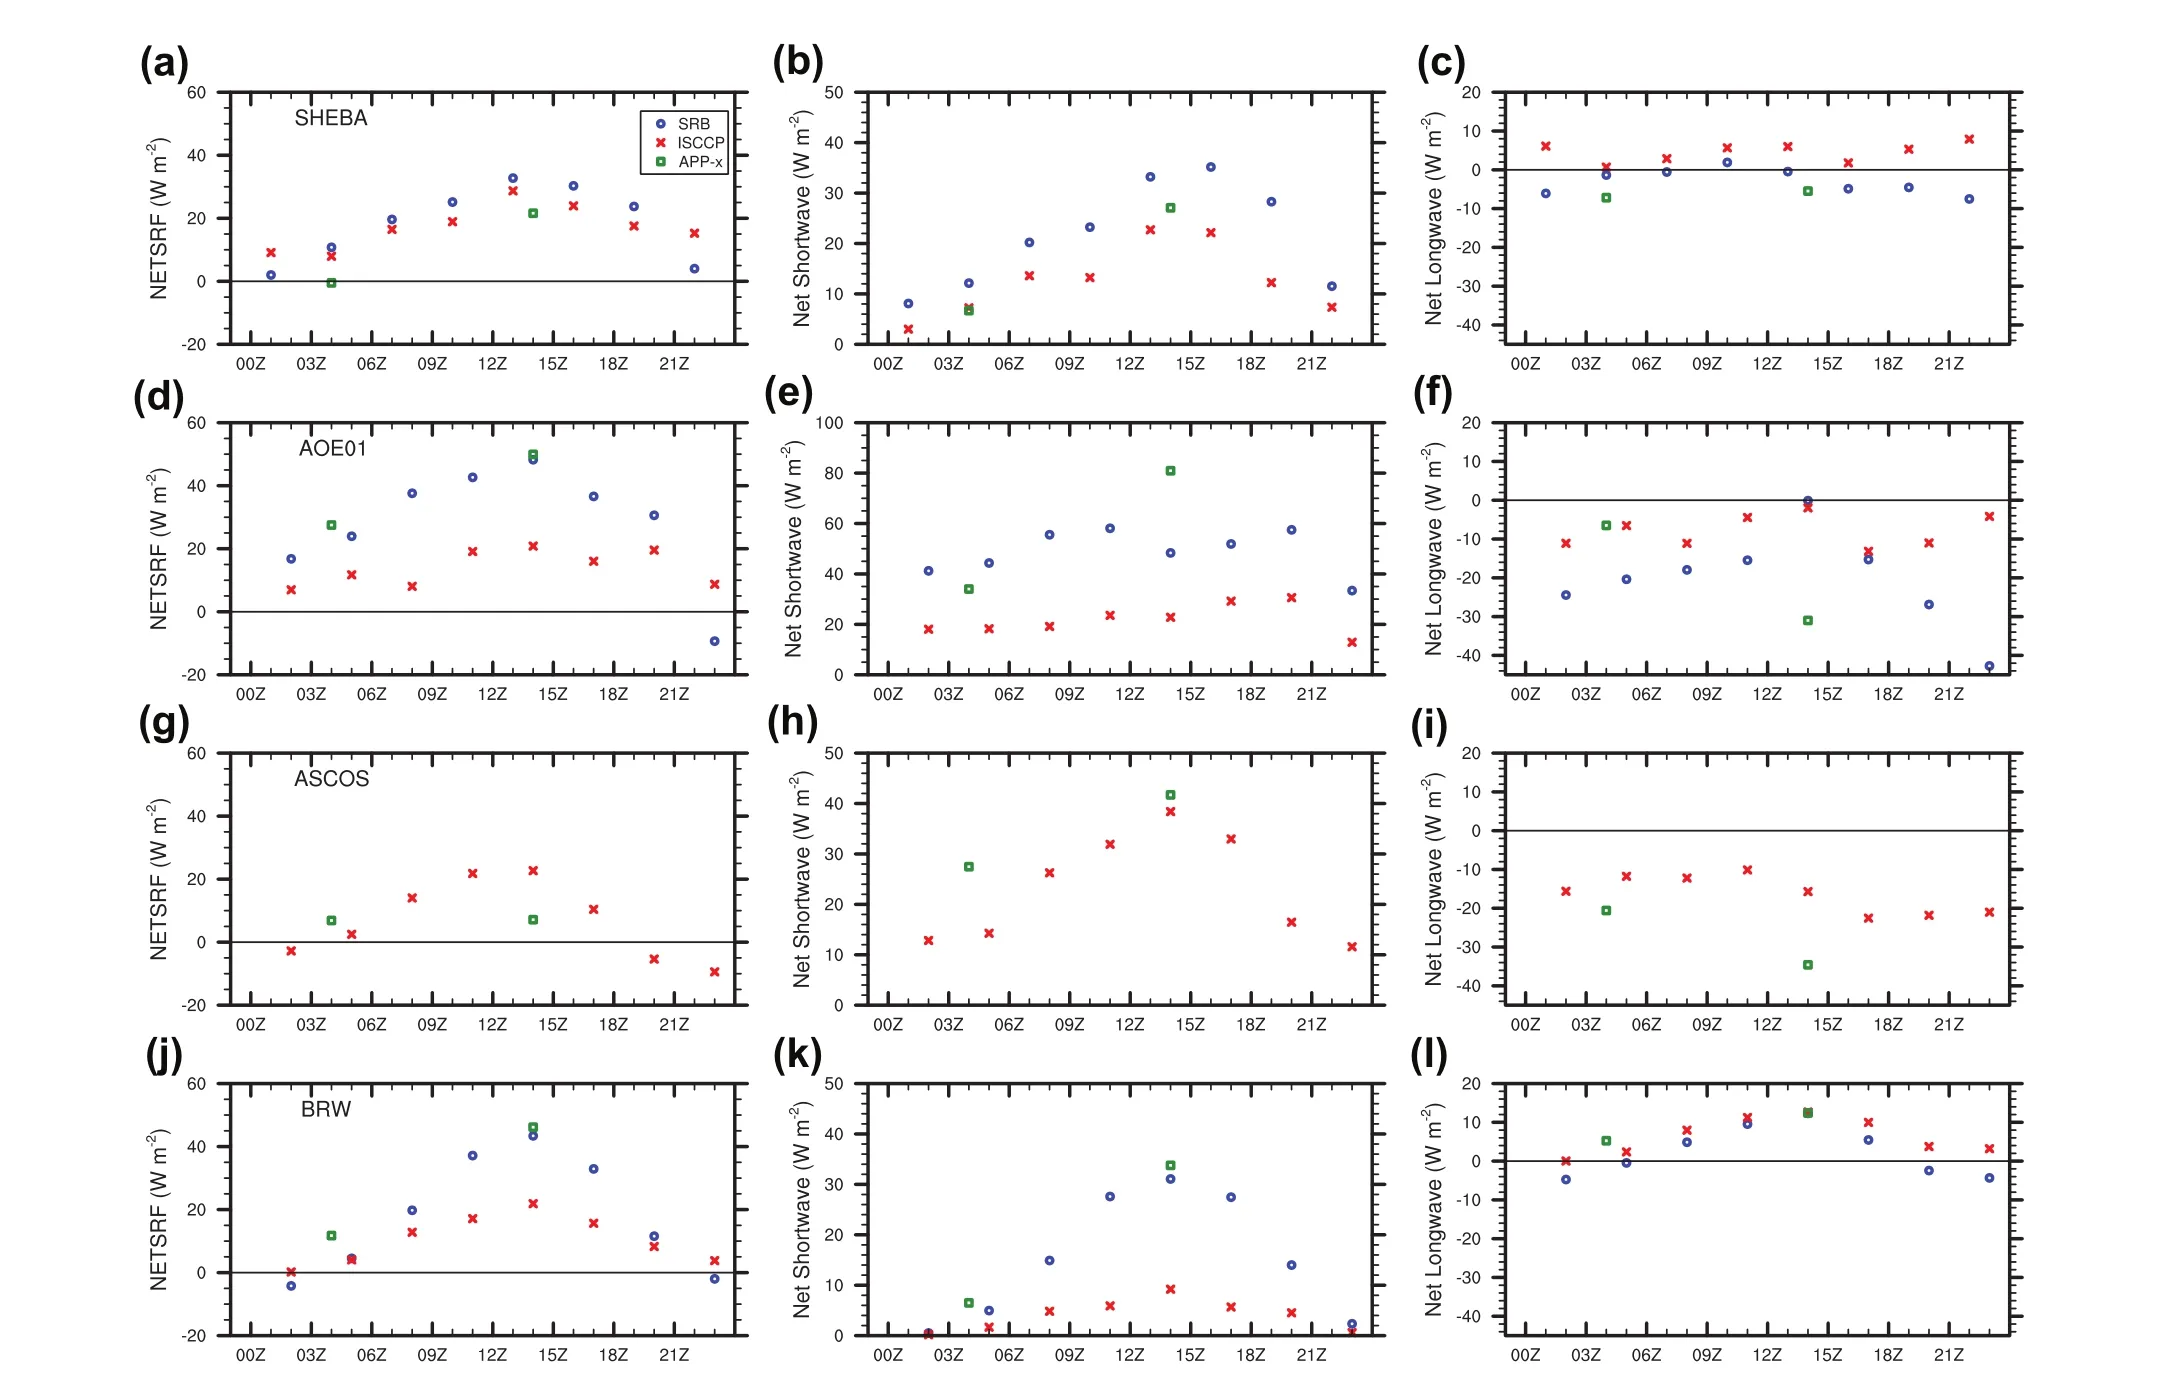
Figure 4. Differences by time of day (LT) for NETSRF (left-hand panels), net shortwave flux (middle panels), and net longwave flux (righthand panels), for the three satellite products against (a–c) SHEBA, (d–f) AOE01, (g–i) ASCOS, and (j–l) BRW (units: W m−2).
4. Discussion and conclusion
Recently, a merged data-set containing a suite of satellite,reanalysis, andin situproducts from 1979 to the present has been released. From this, a schematic diagram of the energy budget for the Arctic was produced (Christensen et al. 2016), but with no detailed bias information. In this study, we set out to identify which satellite product is best,which would be useful when employing the datasets to evaluate NETSRF over the Arctic Ocean in Coupled Model Intercomparison Project simulations. This evaluation provides a snapshot of the accuracy and uncertainty of NETSRF over the Arctic, focusing on the ice-covered ocean for three current-day satellite-derived products (SRB, ISCCP and APP-x). These satellite flux products are widely used to force coupled sea-ice–ocean models, evaluate the simulation of fully coupled climate system models, understand physical processes, and study climate variability and change. Owing to temporal and spatial limitations,the datasets used in this study are insufficient. Therefore,we collected relatedin situdata to cover as many Arctic areas and time periods as possible.
The three satellite products are evaluated against four sets ofin situmeasurements obtained from different locations in the Arctic, including SHEBA, AOE01, ASCOS, and BRW. Our comparisons suggest that the NETSRF of ISCCP is closer toin situobservations relative to SRB and APP-x,based on the statistics of overall bias, RMSE, and correlation. It is not very clear, however, which satellite product is superior to the others from the perspective of the diurnal variation of the averaged bias. Nonetheless, based on the interannual variability of the averaged bias, the NETSRF of ISCCP is more accurate than that of SRB or APP-x.
Although the results of this study indicate ISCCP might agree better within situmeasurements relative to SRB or APP-x, it is not entirely clear to what extent this can be generalized to the entire ice-covered Arctic. Morein situmeasurements over the ice-coved ocean are needed to validate satellite flux products. Nevertheless, our results provide useful information to the community (e.g. the Arctic System reanalysis project (Lindsay et al. 2014)) as to which data-set may provide the smallest bias in NETSRF,as well as its four components (Table 1).
Recently, an overview of the challenges involved in obtaining high-latitude ocean and sea-ice surface flux data was provided by the U.S. CLIVAR Working Group on High-Latitude Surface Fluxes Workshop (Bourassa et al. 2013;Gille, Bourassa, and Clayson 2010). The workshop summarized key needs for improving high-latitude fluxes–particularly, developing improved satellite flux observations.The workshop also recommended accuracy requirements for surface fluxes related to spatial and temporal scales for high-latitude processes, i.e. for sea ice, a 1 W m−2flux imbalance equates to a 10 cm ice melt in a year (a significant fraction of the ice budget). To improve our understanding and ability to model feedback mechanisms in the Arctic, a heat- flux accuracy of 10 W m−2is desirable. Our evaluation shows that substantial discrepancies remain between the studied satellite products andin situmeasurements, and among the satellite products. For example, compared toin situmeasurements, all three satellite-derived products show diurnal variation in the NETSRF bias, with the largest bias in early afternoon and the smallest before or after midnight. Clearly, the input data into the radiative transfer calculations for the three satellite-derived products, including cloud and surface properties, as well as thermodynamic pro files, have critical impacts on the radiative flux estimates. Further investigations of these properties (i.e. cloud fraction, surface albedo) are needed to better understand the causes leading to the discrepancies between these satellite products andin situmeasurements, and among the satellite products, to reduce the levels of uncertainty.Additionally, morein situmeasurements over the ice-coved ocean are needed to validate satellite flux products and support continuing algorithm improvements.

Figure 5. Time series of the annual mean bias of NETSRF for the satellite products against BRW for the period 1993–2007.
Acknowledgments
We thank Ola PERSSON and Chris FAIRALL for providing the SHEBA and AOE01 data, and Ian BROOKS for providing the ASCOS data.
Funding
This research is supported by the National Major Research High Performance Computing Program of China [grant number 2016YFB0200800]; the National Natural Science Foundation of China [grant number 41676185]; and the NOAA Climate Program Office [grant number NA14OAR4310216].
References
Bourassa, M. A., S. T. Gille, C. Bitz, D. Carlson, I. Cerovecki, C. A.Clayson, M. F. Cronin, et al. 2013. “High-latitude Ocean and Sea Ice Surface Fluxes: Challenges for Climate Research.”Bulletin of the American Meteorological Society94 (3): 403–423.
Cavalieri, D., and C. Parkinson. 2012. “Arctic Sea Ice Variability and Trends, 1979–2010.”The Cryosphere6 (4): 881–889.
Christensen, M. W., A. Behrangi, T. S. L’ecuyer, N. B. Wood, M.D. Lebsock, and G. L. Stephens. 2016. “Arctic Observation and Reanalysis Integrated System: A New Data Product for Validation and Climate Study.”Bulletin of the American Meteorological Society97 (6): 907–916.
Curry, J. A., W. B. Rossow, D. Randall, and J. L. Schramm. 1996.“Overview of Arctic Cloud and Radiation Characteristics.”Journal of Climate9 (8): 1731–1764.
Curry, J. A., J. L. Schramm, and E. E. Ebert. 1995. “Sea Ice-albedo Climate Feedback Mechanism.”Journal of Climate8 (2): 240–247.
Druckenmiller, M. L., H. Eicken, M. A. Johnson, D. J. Pringle,and C. C. Williams. 2009. “Toward an Integrated Coastal Seaice Observatory: System Components and a Case Study at Barrow, Alaska.”Cold Regions Science and Technology56 (2–3):61–72.
Fu, Q., K. Liou, M. Cribb, T. Charlock, and A. Grossman. 1997.“Multiple Scattering Parameterization in Thermal Infrared Radiative Transfer.”Journal of the Atmospheric Sciences54 (24):2799–2812.
Gille, S., M. A. Bourassa, and C. A. Clayson. 2010. “Improving Observations of High-latitude Fluxes between Atmosphere,Ocean, and Ice: Surface Fluxes: Challenges at High Latitudes;Boulder, Colorado, 17–19 March 2010.”Eos, Transactions American Geophysical Union91 (35): 307–307.
Kay, J. E., and A. Gettelman. 2009. “Cloud In fluence on and Response to Seasonal Arctic Sea Ice Loss.”Journal of Geophysical Research-Atmospheres114: D18204.
Key, J. R., P. Yang, B. A. Baum, and S. L. Nasiri. 2002.“Parameterization of Shortwave Ice Cloud Optical Properties for Various Particle Habits.”Journal of Geophysical Research107 (D13): 4181.
Key, J., X. J. Wang, Y. H. Liu, R. Dworak, and A. Letterly. 2016.“The AVHRR Polar Path finder Climate Data Records.”Remote Sensing8 (3): 167.
Kim, K.-Y., J. Kim, S. Yeo, H. Na, B. D. Hamlington, and R. R. Leben.2017. “Understanding the Mechanism of Arctic Amplification and Sea Ice Loss.”The Cryosphere Discuss. https://doi.org/10.5194/tc-2017-39.
Lindsay, R., M. Wensnahan, A. Schweiger, and J. Zhang. 2014.“Evaluation of Seven Different Atmospheric Reanalysis Products in the Arctic*.”Journal of Climate27 (7): 2588–2606.
Liu, J. P., J. A. Curry, W. B. Rossow, J. R. Key, and X. J. Wang. 2005.“Comparison of Surface Radiative Flux Data Sets over the Arctic Ocean.”Journal of Geophysical Research-Oceans110:C02015.
Niu, X. L., R. T. Pinker, and M. F. Cronin. 2010. “Radiative Fluxes at High Latitudes.”Geophysical Research Letters37: L20811.
Persson, P. O. G., C. W. Fairall, E. L. Andreas, P. S. Guest, and D.K. Perovich. 2002. “Measurements near the Atmospheric Surface Flux Group Tower at SHEBA: Near-surface Conditions and Surface Energy Budget.”Journal of Geophysical Research-Oceans107 (C10): 8045.
Pinker, R. T., and I. Laszlo. 1992. “Modeling Surface Solar Irradiance for Satellite Applications on a Global Scale.”Journal of Applied Meteorology31 (2): 194–211.
Richter-Menge, J., J. Overland, and J. Mathis. 2016. “Arctic Report Card 2016.” http://www.arctic.noaa.gov/Report-Card.
Serreze, M. C., J. R. Key, J. E. Box, J. A. Maslanik, and K. Steffen.1998. “A New Monthly Climatology of Global Radiation for the Arctic and Comparisons with NCEP–NCAR Reanalysis and ISCCP-C2 Fields.”Journal of Climate11 (2): 121–136.
Stackhouse Jr, P. W., S. K. Gupta, S. J. Cox, T. Zhang, J. C. Mikovitz,and L. M. Hinkelman. 2011. “The NASA/GEWEX Surface Radiation Budget Release 3.0: 24.5-Year Dataset.”GEWEX News21 (1): 10–12.
Stroeve, J. C., M. C. Serreze, M. M. Holland, J. E. Kay, J. Malanik,and A. P. Barrett. 2012. “The Arctic’s Rapidly Shrinking Sea Ice Cover: A Research Synthesis.”Climatic Change110 (3–4):1005–1027.
Tjernström, M., C. Leck, P. O. G. Persson, and M. L. Jensen. 2004.“The Summertime Arctic Atmosphere: Meteorological Measurements during the Arctic Ocean Experiment 2001.”Bulletin of the American Meteorological Society85 (9): 1305.
Tjernström, M., C. Leck, C. Birch, J. Bottenheim, B. Brooks, I.Brooks, L. Bäcklin, R.-W. Chang, G. de Leeuw, and L. Di Liberto.2014. “The Arctic Summer Cloud Ocean Study (ASCOS):Overview and Experimental Design.”Atmospheric Chemistry and Physics14 (6): 2823–2869.
Wang, X. J., and J. R. Key. 2003. “Recent Trends in Arctic Surface,Cloud, and Radiation Properties from Space.”Science299(5613): 1725–1728.
Zhang, Y., W. B. Rossow, A. A. Lacis, V. Oinas, and M. I. Mishchenko.2004. “Calculation of Radiative Fluxes from the Surface to Top of Atmosphere Based on ISCCP and Other Global Data Sets:Re finements of the Radiative Transfer Model and the Input Data.”Journal of Geophysical Research-Atmospheres109 (D19):D19105.
猜你喜欢
杂志排行
Atmospheric and Oceanic Science Letters的其它文章
- On assessing haze attribution and control measures in China
- Preface
- Revisiting the intraseasonal, interannual and interdecadal variability of tropical cyclones in the western North Pacific
- Regional earth system modeling: review and future directions
- When and how will the Millennium Silk Road witness 1.5 °C and 2 °C warmer worlds?
- Exploring the relationship between the cloud-top and tropopause height in boreal summer over the Tibetan Plateau and its adjacent region
