Using UAVs for detection of trees from digital surface models
2018-05-19NusretDemir
Nusret Demir
Introduction
Forest inventory needs detailed information regarding tree height,tree condition,and quantity of trees.This information can be obtained through field measurements but this is time-consuming and not always accurate(e.g.tree height measurements in dense forest stands,crown attributes,determination of tree location in forest stands).There are technologies for tree inventory,such as laser scanning,photogrammetry,and remote sensing.Digital surface/elevation models could serve as a basis for deriving various tree and forest attributes(height,volume,biomass).Digital surface/elevation models can be created from laser scanning systems or the processing of image data;however,image data can only provide the digital surface model(DSM)with the top surface(Zhang and Gruen 2004).
Research on tree detection has been based on image data,laser scanning data,or a combination of both technologies.While some researchers have used image classification methods(Ioannis et al.2004;Erikson 2004;Gatziolis et al.2015;Pouliot et al.2002;Leckie et al.2003;Lin et al.2015)along with radiometric data for the trees,others have used digital elevation models to detect trees based on their geometrical characteristics(Hirschmugl et al.2007;Culvenor 2002;Paris and Bruzzone 2015;D´ıaz-Varela et al.2015;Fritz et al.2013;Lisein et al.2013).
In recent years,the development of unmanned aerial vehicle(UAV)technology enabled economical and ef ficient acquisition of image data.There are several types of UAV systems on the market—some have expensive sensors while others have economical low-cost action cameras that do not provide enough accuracy in photogrammetric modeling as because they have a short baseline(Baletti et al.2014).Bertram et al.(2014)used action cameras in photogrammetry to create a 3D building model using a 3DR IRIS quadrocopter and a GoProHero3 camera.They processed their data using Autodesk 123D software,and the precision of the building facades was 45 mm.
Fritz et al.(2013)used a UAV to detect individual trees in an open area in forest inventory studies.Their test site measured 120×75 m2and was located near Freiburg,Germany.They acquired more than 1000 images at 45 degrees and 55 m flying height.Their camera was a Panasonic G3 with 14–42 mm focal lengths and 16.6-megapixel resolution.Data were collected during April,before leaf emergence.They produced georeferenced images and a point cloud and then compared the results with other point cloud data derived from a terrestrial laser scanner.They used CMVS and PMVS-2 software packages to process data.The processing schema consisted of six steps,viz.data cleaning,SIFT feature extraction,image matching,classi fication,pointcloud generation,and developing camera parameters for 3D modeling of the vegetation surface.They detected 73 trees.Their study compared laser-based and image-based point clouds and con firmed that the results from image data were superior to those from the laser scanner.Feng et al.(2015)classi fied UAV-based images to detect urban vegetation.
To date,research has not addressed tree inventory using highly distorted imagery acquired using a fish-eye action camera mounted on a small UAV system.My objective was to test the low-cost UAV and camera system for tree detection and tree height measurements,and for generating high-resolution DSMs using highly distorted images from an action camera.
Materials and methods
The method consisted of three main processing steps:generating DSM orthoimagery,reducing the surface model to a terrain model to derive the canopy height model,and detecting of individual trees and estimating their heights.
Study area
My study area(Fig.1)was a pinus pinea stand near the FacultyofEngineering attheCampusofAkdeniz University in the city of Antalya,Turkey.The center coordinates are 36.897227°N,30.647794°E.
UAV system and data
I used a rotary winged multi-copter system to acquire images(Fig.2).The system had four rotors,a ZeroTech flight control system,and weighed about 2 kg with 750 g additional payload.A first person view(FPV)system displayed the images in real-time during acquisition.
I used a GoProHero3+lightweight camera,as it is compatible with the gimbal.GoPro cameras are used mainly in active sports activities,marketing,and advertising,and not for modeling by photogrammetric techniques.The camera was calibrated using the Agisoft Lens software package to calculate interior orientation parameters.
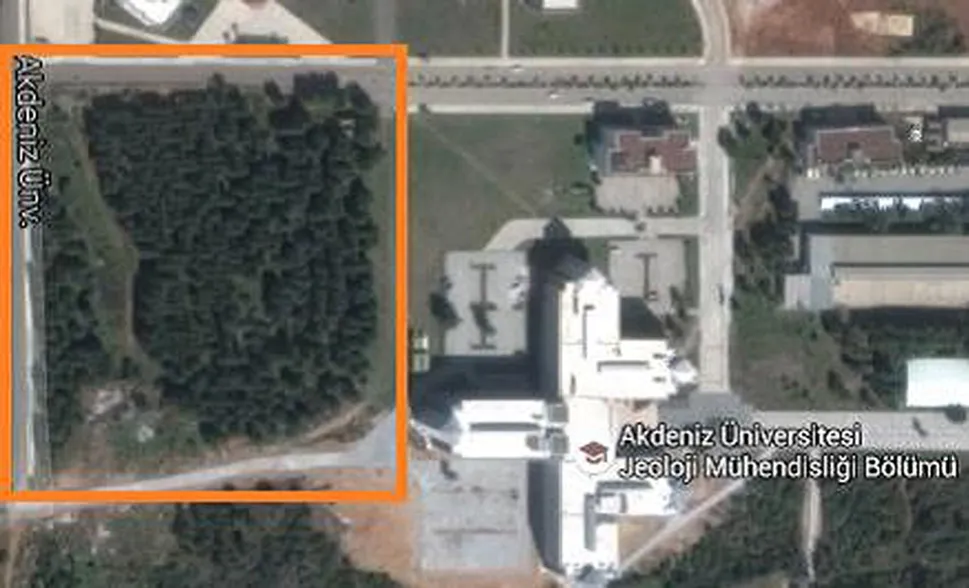
Fig.1 The study area(in orange window).Source:maps.google.com
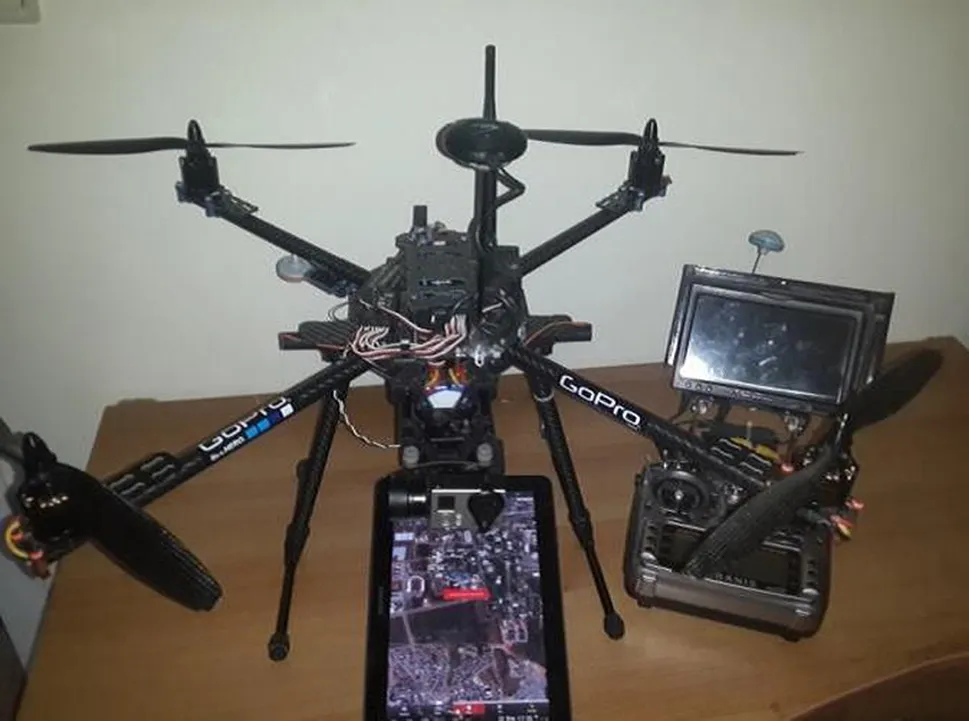
Fig.2 The rotary winged multi-copter system with ZeroTech flight control system

Table 1 The calculated camera parameters(in px)
The calculated parameters are listed in Table 1:f is the focal length,Cxand Cythe center coordinates,k1,k2,and k3are the radial distortion parameters.
Five hundred and eighty-two images were acquired with auto-shutter mode;20 of them were selected for generating the DSM and orthoimage.The overlap rate between images was de fined as 60–80%to achieve a high number of feature matches in image processing.
Image preprocessing
Before generating a DSM,the image dataset must be preprocessed to minimize noise generated in the imagery by various sources.Pre-processing is a three-step approach that includes noise estimation,noise reduction(Pateraki 2005),and Wallis filtering(Wallis 1976).
For noise reduction,an adaptive edge preserving smoothing filter was used(Pateraki 2005).This filter preserves fine details such as one-pixel lines,corners,and line end points.
After noise reduction,Wallis filtering(Wallis 1976)was applied to enhance contrast(Fig.3).The main function of the Wallis filter is to force the mean and standard deviation of an image to fit speci fied values.
Extraction of the canopy height model
The canopy height model was produced by filtering the DSM.The exterior orientation parameters were first calculated using bundle adjustment and integrating image information(automatic tie-point extraction),and ground control points.Images were processed and the point cloud and orthoimage were generated using Agisoft Photoscan software.Ground control points were measured from an existing orthoimage derived from the Worldview-2 satellite with 35 cm resolution.Elevations of the ground control points were interpolated from the existing digital elevation models from the Advanced Spaceborne Thermal Emission and Re flection Radiometer(ASTER)based 30 m resolution digital elevation model.The generated model’s accuracy was calculated as 1.3 m by comparison with groundbased ground control point(GCP)measurements.The generated DSM is shown in Fig.4.
To extract the canopy height model,I applied a progressive morphological filter method(Zhang et al.2003)to filter the DSM.Morphological filtering begins with an opening(erosion+dilation)operation on the DSM to derive a secondary surface.The elevation difference of a grid between the previous and current surface of the searching kernel was compared to a threshold to determine if the grid was a non-ground measurement.
Using Eq.(1),the height difference threshold(dh)was computed using the prede fined maximum terrain slope(s).The size of filtering windows(dhT,k)was increased,and the derived surface was used as an input for the next operation.This was de fined by Zhang et al.(2003):

wheredhT,kis the height difference threshold,dh0is the initial elevation difference threshold that approximates the error of DSM measurements,dhmaxis the maximum elevation difference threshold(m),cis the grid size(m),sis the estimated terrain slope,andwkis the filtering window size(in number of cells)at the kth iteration.
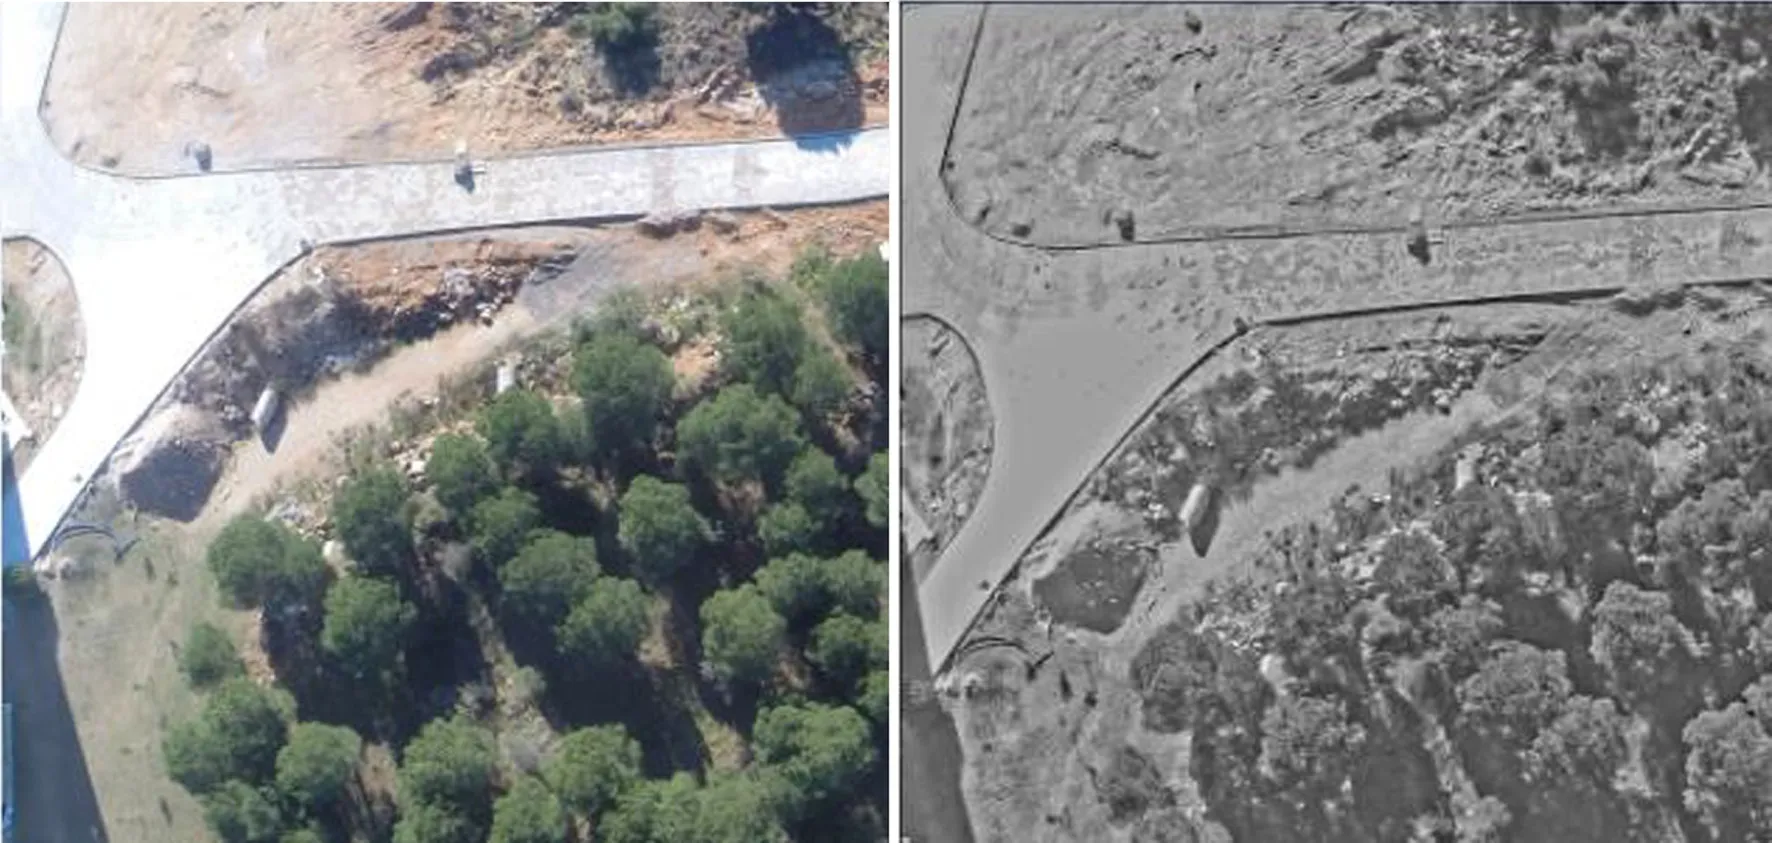
Fig.3 Original image(left),noise-reduced and Wallis- filtered image(right)

Fig.4 Generated digital surface model and extracted tree canopy
The parameters used for morphological filtering are listed in Table 2.The difference between the generated terrain model and the surface model gives the tree canopy cover(Fig.4).
Tree detection
The locations of single trees are used to determine the number of trees in the field.Manual counting is not always efficient and is time-consuming.Therefore,methods are needed to automate the counting process.The DSM was post-processed to extract the peak points of single tree crowns.Detecting the grid cells of DSM,a cell having the lowest elevation value among its neighbors would give the tree top location in the inverted surface model(Figs.5,6).The reason for inverting the surface model was to extract the tree peak points using focal flow direction analysis(Suarez et al.2005),with implementation in the ArcMap®software package.

Table 2 Filtering parameters
Calculating the flow direction enables determination of how the surface flows downward.In this method,a search window was moved over the inverted surface model to determine the grid cells into which the neighbor cells flow.The cell with a higher value than the cell in the search window was de fined as flow.I then used the sink points to determine the tree peaks.
The directions of the neighbor cells were mapped as shown in Fig.7.Neighbor cell 1 was the cell adjacent on the north and the following cells were ordered clockwise.
Let us assume the following grids are a part of a surface model that will be processed to calculate flow values.

When we processed the center cell ‘-34’,all eight neighbors were mapped in the 8-bit table,and a value of 1 or 0 was given according to their value compared to the center cell.If the value of the neighbor cell was greater than the center cell,the value ‘1’was mapped in the 8-bit schema;otherwise,it would become ‘0’as shown below.

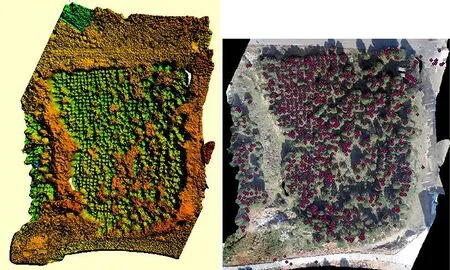
Fig.5 Inverted digital surface model(left),extracted peak points(purple)on right
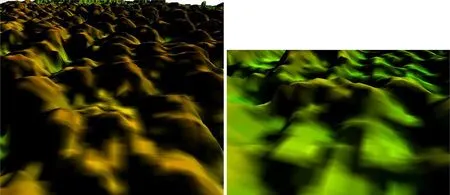
Fig.6 Trees on DSM(left);in inverted DSM,trees become sink points(right)

Fig.7 Direction numbers for focal flow analysis
For calculating the focal flow value with bit positions,1+8+64 is 73 for the cells.The maximum value of the focal flow would be 255,which means that all neighbor cells were bigger than the processing cell.The value 255 was used as a threshold to detect the tree peak points.
However,this operation would also produce other points than the tree peaks.Therefore,a re finement approach was needed.Flow values of 255 would indicate all tree peaks together with other non-tree points from other types of objects,such as some non-tree points on the ground.Another problem would be multiple detections on a single tree because some single trees might have multiple peak heights because of their branch structures.Re finement included eliminating non-tree points and removing the detected duplicate points on single trees.This process had two steps:(1)use of the extracted tree canopy from the filtering of the DSM;and(2)combining bands of the orthoimage and near analysis between points.The extracted tree canopy enabled identi fication of the points that correctly located trees.The detected tree points intersecting with the tree canopy were extracted with the filtering of the DSM.For eliminating the filtering errors and improving the results,green and blue channels of the images were used.The digital number(DN)of the green channel was always greater than the DN of the blue channel among the trees.The point that overlaid the pixel with a high blue-green value rather than a red or blue band value was selected.To overcome the multiple peak point problem,the distances between the detected tree points were calculated.If the distance was less than a speci fied range(set as the typical radius of crown breadth),which is 1.5 m,then,a new point was created in the middle of the two points which were nearest each other.An example is shown Fig.8 where red points were detected trees and yellow points were created between the detected red points after proximity analysis.Finally,the red points were removed.
Tree height calculation
Subtracting the digital terrain model from the DSM yielded the canopy height model(CHM).The linear interpolation of the detected trees into the canopy height model results in the elevation from the ground for each single tree.
The linear interpolation was calculated as:

whereHtis tree height,(x,y)is tree location,andZCHMis the elevation of the canopy height model at the location of the tree.With this equation,the tree height was directly interpolated from the corresponding grid cell.
Quality assessment
I evaluated the results of tree detection by comparison with the manually digitized tree points.The closest reference tree point was assigned to the detected tree points pairwise,and the statistics(mean,median,standard deviations)of the distances were calculated.The correctness value was the ratio between the correctly detected points and the total detected points.The point with 2 m distance between any reference tree points was considered a correct point.
For assessing the tree heights,I calculated the height differences between the measured tree height and the height from the canopy height model,

where ΔH is the height difference,Hcis the calculated tree height with the proposed method and Hmis the measured tree height in the field.Figure 14 presents the ΔH distribution of the compared trees.
Estimated heights were compared with measurements from fieldwork.During fieldwork,tree heights were measured using a total station(an electronic device which is used for precise measurements)for 65 randomly selected trees(Fig.9).The root mean square error(RMSE)and the statistics were calculated.
There was a delay of 10 months between remote data acquisition in April 2015 and fieldwork for quality assessment in March 2016.To account for this,all calculated tree heights were increased by 10%,as the growing rate of the pinus pinea is 10%per year(Roth 1983).

Fig.8 Elimination of multi-peaks problem
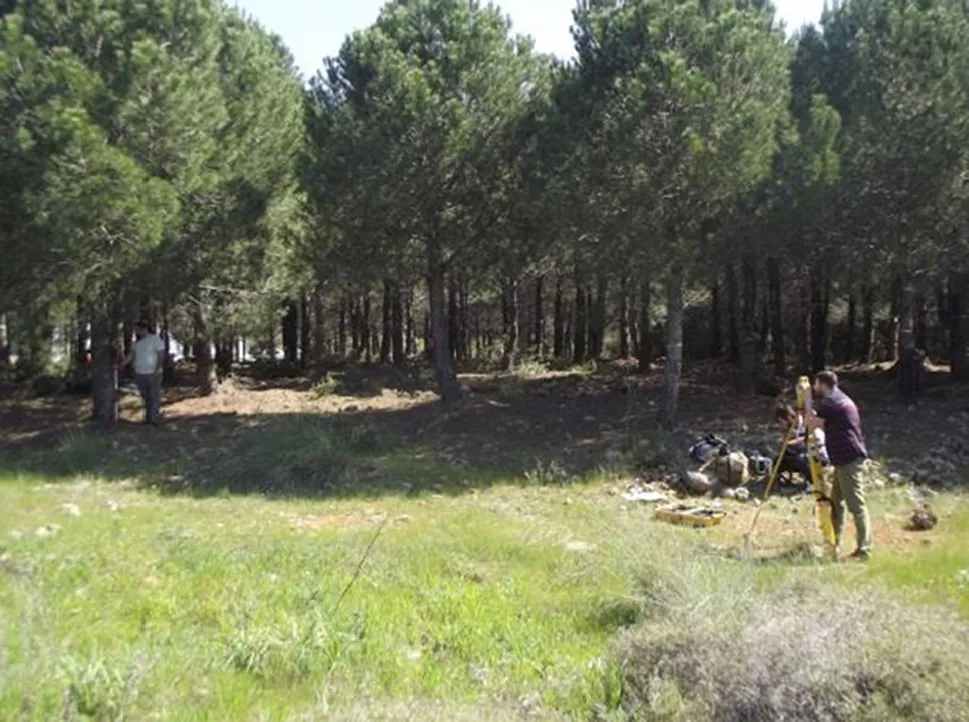
Fig.9 Measurement of the tree heights using total station
Results
Produced canopy height model is shown in Fig.10.
Mean tree height was calculated as 7.08 m with standard deviation of 1.57 m for all calculated tree heights(Fig.11).
The detected trees are shown in Fig.12 with colors according to their calculate heights.
Regarding evaluation of the results,the statistics(mean,median,standard deviations)of the distances between the reference dataset and the detected trees are;the mean was 1.30 m,and the standard deviation was 1.48 m,which were below the used threshold value 2 m.
649 trees were correctly detected.68 trees could not be detected and the number of wrongly detected trees was 161(Fig.13).Correctness was 80%.The completeness value was the ratio between the number of correctly matched reference tree points and the total number of reference tree points.The completeness was calculated to be 90%.
Comparison of estimated versus measured tree heights(Fig.14)yielded RMSE of 0.72 m,mean difference of 0.2 m,standard deviation of 0.75 m,and median difference of 0.29 m.

Fig.10 Canopy height model
Discussion and conclusions
In this study,the trees were detected with low-cost UAV imaging system.The camera used to produce imagery was lightweight to enable its usage with low-weight UAV systems.This combination of equipment proved satisfactory from logistic and financial perspectives.The highly distorted imagery produced by the wide-angle lens was used to reconstruct a DSM without any field measured ground control points.Other studies reported in the literature used multispectral cameras that did not cause high lens distortion.
The advantages of the system and methodology used in this study compared to other studies reported in the literature are as follows:
•I used a low-weight action camera that enabled image acquisition from a low-cost,small UAV.
•I used RGB bands but not NIR bands,which would have required more expensive camera hardware.
•I was able to filter the DSM to extract the canopy in dense tree stands.This method uses a test dataset collected in a dense stand of trees.In dense stands,the methodology reported by Dı´az-Varela et al.(2015)could not be used because they use a 2 m circle to find the lowest and highest evaluation to identify trees.Kattenborn et al.(2014)detected palm trees in nDSM by applying local maxima filters.Their method worked well with sparsely populated,tree stands as is typically the case for palm trees.In our case,their algorithm would be weak because our stands were more dense and this would cause the boundary to yield local maxima and false detection.Torres-Sa´nchez et al.(2015)applied object-based image classi fication to detect trees in sparse stands.Yet their test on tree rows had no success in delineation of single trees.Lisein et al.(2013)used the advantages of LIDAR(Light Detection and Ranging)data to produce a UAV-based point cloud and used the near infrared band to detect trees.This technology showed high capacity for extraction of vegetation data.
•Detecting tree peak points with few parameters,only the threshold value of 255 was used to detect the peak points.Additionally,the heights were calculated using a filtered elevation model.
The only negative aspect of the method used here was that the results were highly dependent on the DSM.Because this model was of high quality,my estimates of canopy height and numbers of trees were of high accuracy in spite of using a low-cost data acquisition system with 1.3 m accuracy.The parameters used in describing the tree canopy had a direct effect on the quality of the results.For example,using different parameters to filter the DSM would produce different results.However,the parametersused here were created with coarse values as much as possible,e.g.,20 cm for the accuracy parameter.On the other hand,the parameters used in other processing steps were in binary form,e.g.,the value of the green band was always greater than the values of blue or red bands.Also,the process of calculating the distance between two nearby points and replacement of both with a new point did not need a speci fic parameter that might affect the result.Because of the advantages of pulse technology,the tree inventory would be more accurately derived using LIDAR datasets compiled by laser scanning over vegetated regions,as reported by Lisein et al.(2013).In this study,although photogrammetry derived only the top surface of the trees,the filtering and detection of trees achieved good success using a fish-eye camera with high lens distortion.

Fig.11 Distribution of the calculated tree heights

Fig.12 The trees colored according to their calculated heights
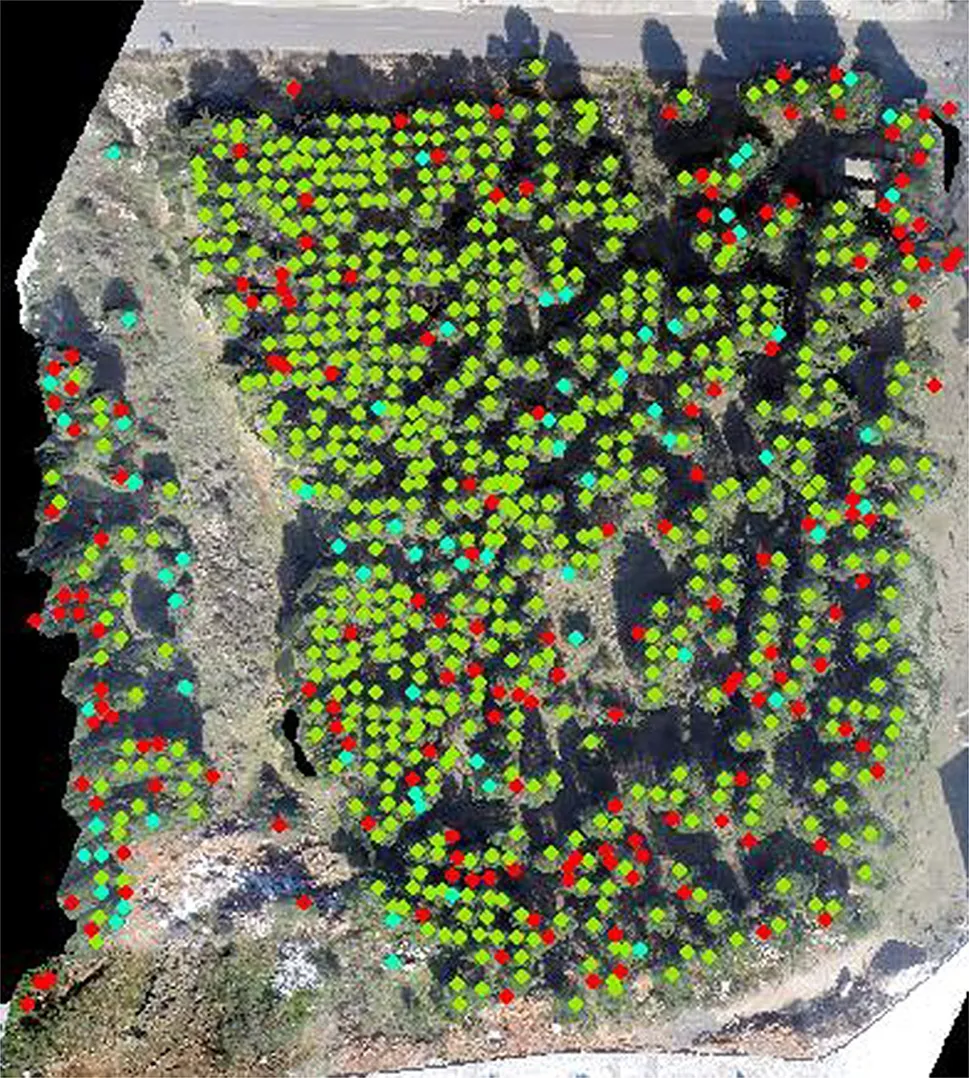
Fig.13 Green correctly detected tree,red missing tree,cyan wrongly detected tree

Fig.14 The distribution of the height differences(m)between selected measured and calculated trees
AcknowledgementsThe author acknowledges the support of Dr.Halil ˙Ibrahim YOLCU for controlling the UAV system,student Batuhan GU¨LLU¨DERE,and lecturers Tev fik Fikret HORZUM,Ercu¨ment AKSOY,and their student team for their help during the fieldwork.
References
Baletti C,Guerra F,Tsioukas V,Vernier P(2014)Calibration of action cameras for photogrammetric purposes. Sensors 14(9):17471–17490
Bertram TT,Bock TT,Bulgakov AG,Evgenov AA(2014)Generation the 3D model building by using the quadcopter.In:Proceedings of the 31st ISARC,Sydney,p 6
Culvenor DS(2002)TIDA:an algorithm for the delineation of tree crowns in high spatial resolution remotely sensed imagery.Comput Geosci 28(1):33–44
Dı´az-Varela RA,de la Rosa R,Leo´n L,Zarco-Tejada PJ(2015)Highresolution airborne UAV imagery to assess olive tree crown parameters using 3D photo reconstruction:application in breeding trials.Remote Sens 7:4213–4232
Erikson M(2004)Species classi fication of individually segmented tree crowns in high-resolution aerial images using radiometric andmorphologicimagemeasures.RemoteSensEnviron 91(3–4):469–477
Feng QL,Liu JT,Gong JH(2015)UAV remote sensing for urban vegetation mapping using random forest and texture analysis.Remote Sens 7:1074–1094
Fritz A,Kattenborn T,Koch B(2013)Uav-based photogrammetric point clouds—tree STEM mapping in open stands in comparison to terrestrial laser scanner point clouds.ISPRS Arch 41(W2):141–146
Gatziolis D,Lienard JF,Vogs A,Strigul NS(2015)3D tree dimensionality assessment using photogrammetry and small unmanned aerial vehicles.PLoS ONE 10(9):1–21
Hirschmugl M,Ofner M,Raggam J,Schardt M(2007)Single tree detection in very high-resolution remote sensing data.Remote Sens Environ 110:533–544
Ioannis Z,Gitas GH,Mitri GV(2004)Object-based image classi fication for burned area mapping of Creus Cape,Spain,using NOAA-AVHRR imagery.Remote Sens Environ 92(3):409–413
Kattenborn T,Sperlich M,Bataua K,Koch B(2014)Automatic single tree detection in plantations using UAV-based photogrammetric point clouds.ISPRS Arch 43:139–144
Leckie DG,Gougeon FA,Walsworth N,Paradine D(2003)Stand delineation and composition estimation using semi-automated individual tree crown analysis.Remote Sens Environ 3:355–369
Lin Y,Jiang M,Yao YJ,Zhang LF,Lin JY(2015)Use of UAV oblique imaging for the detection of individual trees in residential environments.Urban For Urban Green 14(2):404–412
Lisein J,Pierrot-Deseilligny M,Bonnet S,Lejeune P(2013)A photogrammetric work flow for the creation of a forest canopy height model from small unmanned aerial system imagery.Forests 4:922–944
Paris C,Bruzzone L(2015)A three-dimensional model-based approach to the estimation of the tree top height by fusing low-density lidar data and very high resolution optical images.IEEE Trans Geosci Remote Sens 53(1):467–480
Pateraki M(2005)Adaptive multi-image matching for DSM generation from airborne linear array CCD data.Ph.D.dissertation,No.86,Institute of Geodesy and Photogrammetry,ETH Zurich,p 170
Pouliot DA,King DJ,Bell FW,Pitt DG(2002)Automated tree crown detection and delineation in high-resolution digital camera imagery of coniferous forest regeneration.Remote Sens Environ 82(2–3):322–334
Roth AF(1983)Thinning pine stands for top returns.ANR-96.http://goo.gl/cHMwC4.Accessed on 04 April 2016
Suarez JC,Ontiveros C,Smith S,Snape S(2005)Use of airborne LiDAR and aerial photography in the estimation of individual tree heights in forestry.Remote Sens Environ 31:253–262
Torres-Sa´nchez J,Lo´pez-Granados F,Serrano N,Arquero O,Pen˜a JM(2015)High-throughput 3-D monitoring of agricultural-tree plantations with unmanned aerial vehicle(UAV)technology.PLoS ONE 10(6):1–20
Wallis KF (1976)Seasonal adjustment and relations between variables.J Am Stat Assoc 69(345):18–31
Zhang L,Gruen A(2004)Automatic DSM generation from linear array imagery data.ISPRS Arch 35(3):128–133
Zhang KQ,Chen SC,Whitman D,Shyu ML,Yan JH,Zhang CC(2003)A progressive morphological filter for removing nonground measurements from airborne LIDAR data.IEEE Trans Geosci Remote Sens 41:872–882
杂志排行
Journal of Forestry Research的其它文章
- In vitro propagation of conifers using mature shoots
- ‘Relationships between relationships’in forest stands:intercepts and exponents analyses
- Effects of application date and rate of foliar-applied glyphosate on pine seedlings in Turkey
- Assaying the allelopathic effects of Eucalyptus camaldulensis in a nursery bed incorporated with leaf litter
- Effects of soil compaction on growth variables in Cappadocian maple(Acer cappadocicum)seedlings
- Variation and selection analysis of Pinus koraiensis clones in northeast China
