Assessing vulnerability of a forest ecosystem to climate change and variability in the western Mediterranean sub-region of Turkey
2018-05-19OrkanzcanNebiyeMusaogluMuratTurkes
Orkan O¨zcan •Nebiye Musaog˘lu •Murat Tu¨rkes¸
Introduction
The greater Mediterranean region(i.e.,the Mediterranean Basin)is located at the crossroads of Africa,Asia and Europe.It shares many cultures and traditions,encompasses different natural features and has a great variety of landscapes,soils,vegetation,geology,climate and biodiversity(Zdruili 2014).The climate is characterized by warm to hot,dry summers and mild to cool,wet winters,along with markedly high seasonal,inter-annual and even longer(e.g.,decadal)time-scale variabilities(Tu¨rkes¸1998).Mediterranean climates are found on various continents.They are formed and controlled by subtropical high pressure cells,(e.g.,the Azores High Pressure System over the mid-north Atlantic),dominated during the warm/hot period of from May to October,and mid-latitude disturbances and frontal cyclones in the temperate/cold period from November to March(Tatli and Tu¨rkes¸2014;Tu¨rkes¸and Erlat 2006;S¸ahin et al.2015).Severe floods,storms,droughts,and heat waves,as well as land and forest degradation and the salinization of groundwater resources already occurring,are often viewed as a foretaste of climate change interacting with otheranthropogenic impacts on the natural environment and its ecosystems.
In global terms,forest ecosystems are an important carbon sink,in which 76–78%of the organic carbon of terrestrial ecosystems is stored and which makes signi ficant contributions in reducing the impact of total CO2emissions and maintaining regional and even global,climate stability(Sivrikaya and Bozali 2012;Keles et al.2012).Based on various studies on temporal dynamics of vegetation and their relationship to climate,global and regional warming may cause signi ficant changes in vegetation activities,especially in the middle-and high-latitude regions of the northern hemisphere where vegetation growth and cover increase significantly.The analysis,evaluation and assessment approach in this study for estimates of climate variability and environmentalvulnerability offorest ecosystems,are based on the most widely used de finition provided by the Fourth Assessment Report of the IPCC(IPCC 2014).The Fourth Assessment Report(AR4)states that forestry has a particular vulnerability to recent trends to more severe heat waves,droughts and floods.A temperature increase of more than 2°C could result in deserti fication and grassland expansion in the absence of shrublands,and the expansion of mixed deciduous forests in the absence of evergreen forests.Such warmer and drier conditions are partly responsible for reduced forest productivity and increased forest fires.In light of these,the Report noted that Mediterranean ecosystems were among those most vulnerable to climate change impacts(IPCC 2007).
Many studies have assessed the impact of climate change and climate variability on forestry and the vulnerability of ecosystems in the Mediterranean region(Sabate´et al.2002;Maracchi et al.2005;Gritti et al.2006;Lindner et al.2010;Camuffo et al.2010;Lelieveld et al.2012).In addition,Barbero et al.(1990)highlighted the effects of human-induced disturbances of forest ecosystems in the western part of the Mediterranean basin.Mugnozza et al.(2000)discussed a number of research priorities with special consideration to the impact that global change may have on Mediterranean forest ecosystems.They concluded that social issues,(such as fuelwood for domestic fireplaces,restaurants and charcoal production),should be considered as key factors for effective forest conservation;otherwise,it will be impossible to control forest fires and landscape degradation in the region.
The frequency of forest fires is highly sensitive to climate change.Accordingly,many attempts have been to quantify the potential impact of climate change on fire risk under Mediterranean environmental conditions(Moriondo et al.2006;Turco et al.2013,2014).Studies suggest that continued research is required to further explore the relationship between climate change and fires,especially in mountainous regions that under present climatic conditions are almost unaffected by forest fires.Mediterranean ecosystems are remarkably valuable and the impact of climate change on ecohydrological processes may be signi ficant.Mediterranean-type ecosystems occur in five relatively small areas around the world:the area bordering the Mediterranean Sea,central Chile,the Cape region of South Africa,southwestern and southern Australia,and southern California.They are characterized by evergreen or droughtdeciduous shrublands.Due to the limited extent and isolation of each of the Mediterranean-type ecosystems,there is frequently a high degree of endemism in flora and fauna.The five Mediterranean-type ecosystems have been highly favored and impacted for habitation,agriculture and recreation.This ecosystem type(which occurs on about two percent of the earth’s land area)is one of the most highly altered with the most disturbed area of any ecosystem (Pignatti 2003).Erol and Randhir(2012)reviewed the expected impacts of climatic change on the ecohydrology of the watersheds of the Mediterranean and identi fied adaptation strategies to increase the resilience of the systems.Situated at the center of the junction between Asia,Europe and Africa,Turkey has several unique ecosystems that host many species.With its speci fic geographic position,rich topographical features and climatic differences between regions,Turkey has an impressive richness in fauna and flora.In particular,the country has the second largestpercentofforestcoveramong Mediterranean countries,totaling 216,000 km2,which corresponds to 27.6%of its area.
The objective of this study is to assess the vulnerability of a Mediterranean forest ecosystem to climate change and variability under present conditions.To accomplish this,multifactorial spatial modelling was used to Turkey’s western Mediterranean sub-region,characterized by a‘real’Mediterranean climate(GIZ 2013).This was for an FAO-Silva Mediterranean-FFEM-OGM Project entitled‘Component 1’– ‘‘Production of data and development of tools to support decision-making and management of vulnerable Mediterranean forest ecosystems affected by climate change and the ability of these forest ecosystems to adapt to global change’’(Tu¨rkes¸and Musaog˘lu 2016).
Materials and methods
Study area
Du¨zlerc¸amı forest ecosystem covers an area of the northern Antalya travertine plateau as well as portions of the eastern and southern slopes and the lower regions of the Western Taurus Mountains.Lithological characteristics of the site are mainly limestone formations dated from the Quaternary to the Jurassic periods(MTA 1989).In addition,the site has many roads;it is close to cities and tourist attractions and surrounded by agricultural areas.Taken together,these make the forest ecosystem vulnerable to human activities.With its mosaic of forests,great diversity of plant and animal species,wildlife improvement areas,natural protected zones and habitats for fallow deer(DamadamaL.),the site is an important ecosystem in Antalya province(Musaoglu et al.2014).The selected forest ecosystem is located in the Mediterranean geographical region of Turkey,on the western Mediterranean coastal belt.Nearly 30%of the land area is forested(Fig.1).
Despite a decrease in population in some districts,the latest statistics indicate an alarming in the mid-eastern region,which had a population of 3348 in 1990 and 27,995 in 2010(TSI 2012).As with all forested areas in Turkey,the region’s forests are state-owned and administrated by the General Directorate of Forestry under the Ministry of Forestry and Water Affairs and managed by the forest district directory in line with management plans that run in cycles of 10 to 20 years.The combined inventory method,integrating aerial photography and satellite image interpretations with temporary sample plots,is for plan renewals.To detect forest cover changes and damage to the study site,temporal stand maps and remote-sensing images of the region are used.
De finitions and assessment approach
To ful fil the objectives to assess ecosystem vulnerability to climate change, ‘‘Multifactorial Spatial Modelling’’(GIZ 2013),a GIS-based modelling approach complemented by stakeholders exchange with government,science and civil society,combined with an ‘‘Expert system for evaluating the Environmental Sensitivity Index(ESI)of a local area’’.The main references for the ‘‘Deserti fication Indicator System for Mediterranean Europe,Expert System for Evaluating the Environmental Sensitivity Index(ESI)of a Local Area:Methodology’’can be found in Ferrara et al.(1999)and Kosmas et al.(1999a,b,c).An updated version of the methodology employed in this study was developed and tested in the MEDALUS III project(DIS4ME 2014).In the updated expert system,the computed values were rearranged from 0 to 100 for simple interpretation of the results since they were obtained from the application of the algorithm.In the methodology,vulnerability scores are efficient and allow simple estimates of levels of vulnerability in a de fined area.The computed values are continuous within selected ranges that usually vary from 1 to 2 or from 0 to 100 as in the ESI.However,for interpretation and representation purposes,they are grouped into classes.Class grouping is an open process in which threshold values are selected on the phenomena needed to be put into evidence(Ferrara et al.1999;Kosmas et al.1999a).
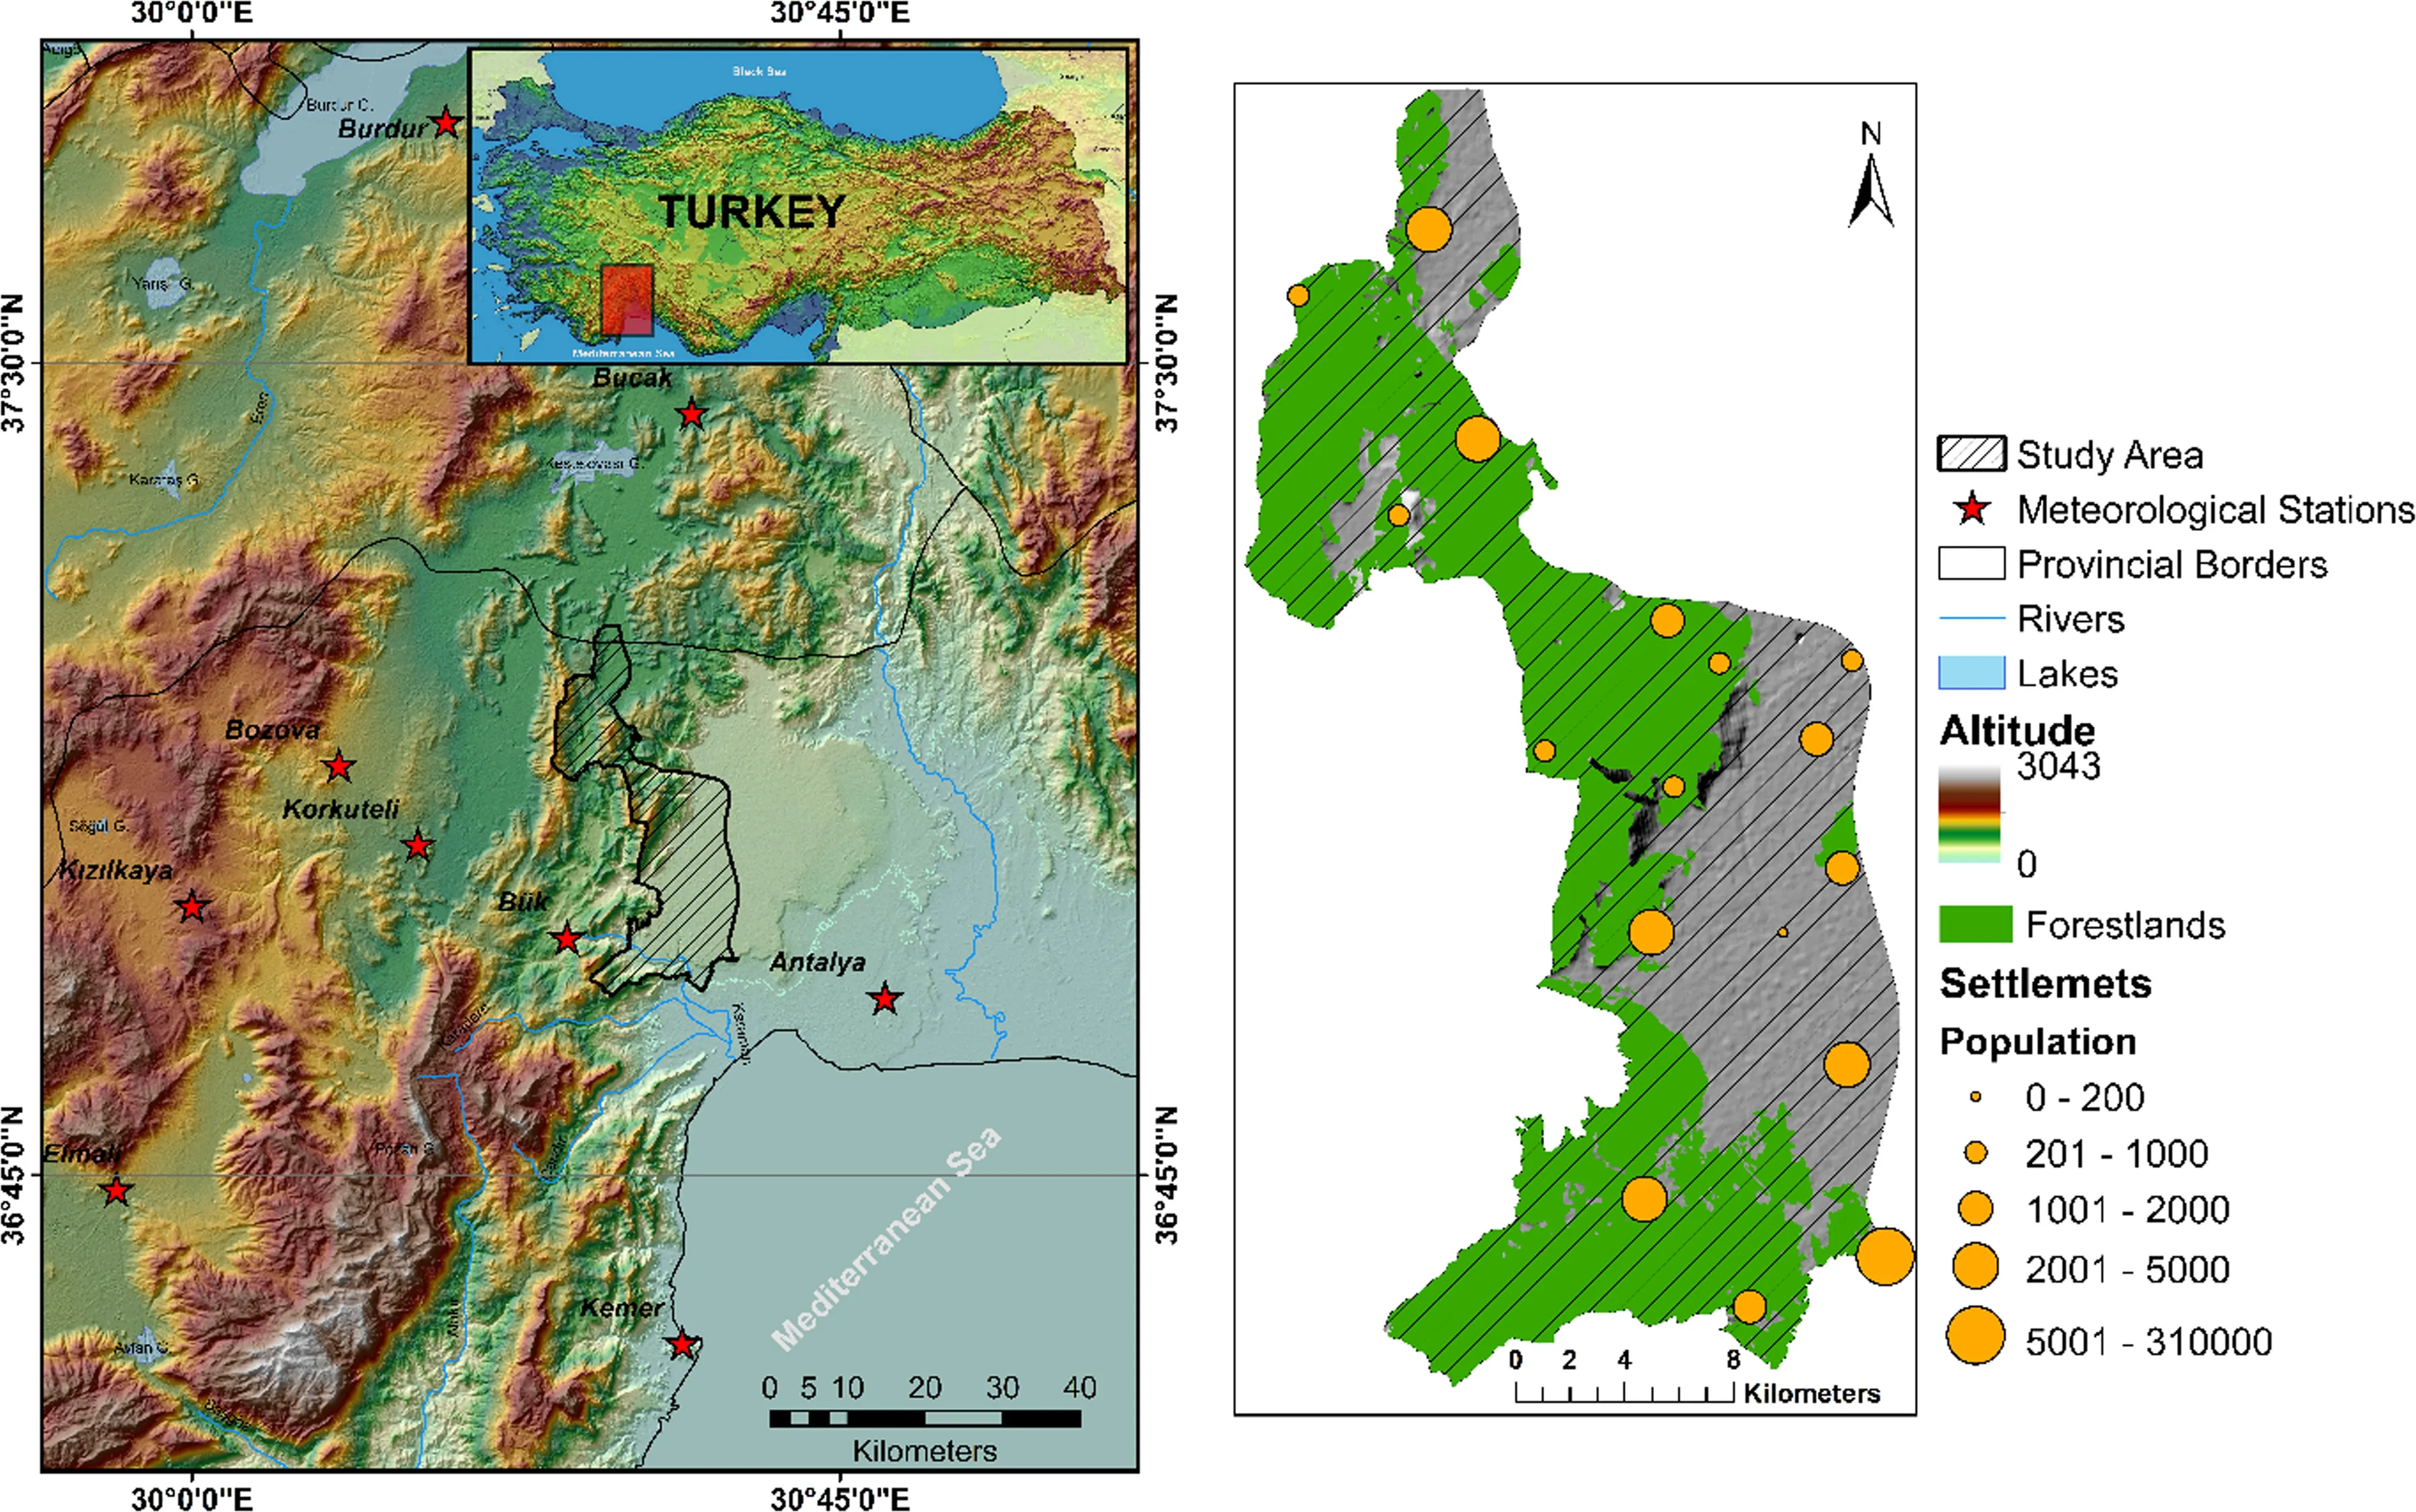
Fig.1 Geographical location of the Antalya Du¨zlerc¸amı forest ecosystem
Based on the combined vulnerability methodology,the production of the basic system was achieved by adopting a two-stage approach for vulnerability of the ecosystem to climate change applied under the present conditions illustrated in Fig.2.
In the first stage,the five individual Environmental Quality Layers(EQLs)or Factor Groups,corresponding to Environmental Quality Scores(EQSs)and Environmental Quality Indices(EQIs),are determined from the basic data input layers(i.e.,indicators or sub-layers).In the second stage,the Environmental Vulnerability Scores(EVSs)and Environmental Vulnerability Index Values(EVIs)from the EQSs of the EQLs,are evaluated to produce a map of the combined Environmental Vulnerability Areas(EVAs)of the study region.
The quanti fication of different EVSs at various scales or geographical,ecological and biogeographical units may be by evaluating the overall in fluence that each single information layer has on the studied phenomena(Basso et al.2000).For the vulnerability analysis of the forest ecosystem to climate change, five quality layers(factor groups)were used based on the methodology developed by GIZ(2013),taking into account the sub-layers in order to individually map the EQLs,EQSs,EQIs,EVSs,EVIs and EVAs(Fig.2).
Environmental vulnerability analysis and valuation
In the first stage, five EQLs and their EQSs from the basic data sub-or input-layers(i.e.,indicators such as variables,parameters or indices)were determined.Each elementary unit in each quality layer for any grid point in the study area is represented according to its geographical coordinates(latitude and longitude),and estimated as the geometric mean of the relative scores of its own sub-layers as follows(Eq.1):

wherei,jdenote the rows and columns of a single elementary land unit of each sub-layer andnindicates the number of sub-layers used.In the second phase,the EVSs and EVIs were evaluated from the EQSs of the EQLs.In the vulnerability analysis,classes were scored and assessed with respect to the vulnerability of the ecosystem to climate change and variability(Table 1).The first level of the basic data layers isolates the rest of the system from thedetails of the data.The quality layer(level 2)acts as a buffer between level 1 data layers and the derived ESA layer(level 3).In the MEDALUS system,the ES scores(ESSs)are estimated with Eq.(2)using the n-number of Quality Scores,QSs from Eq.(1).
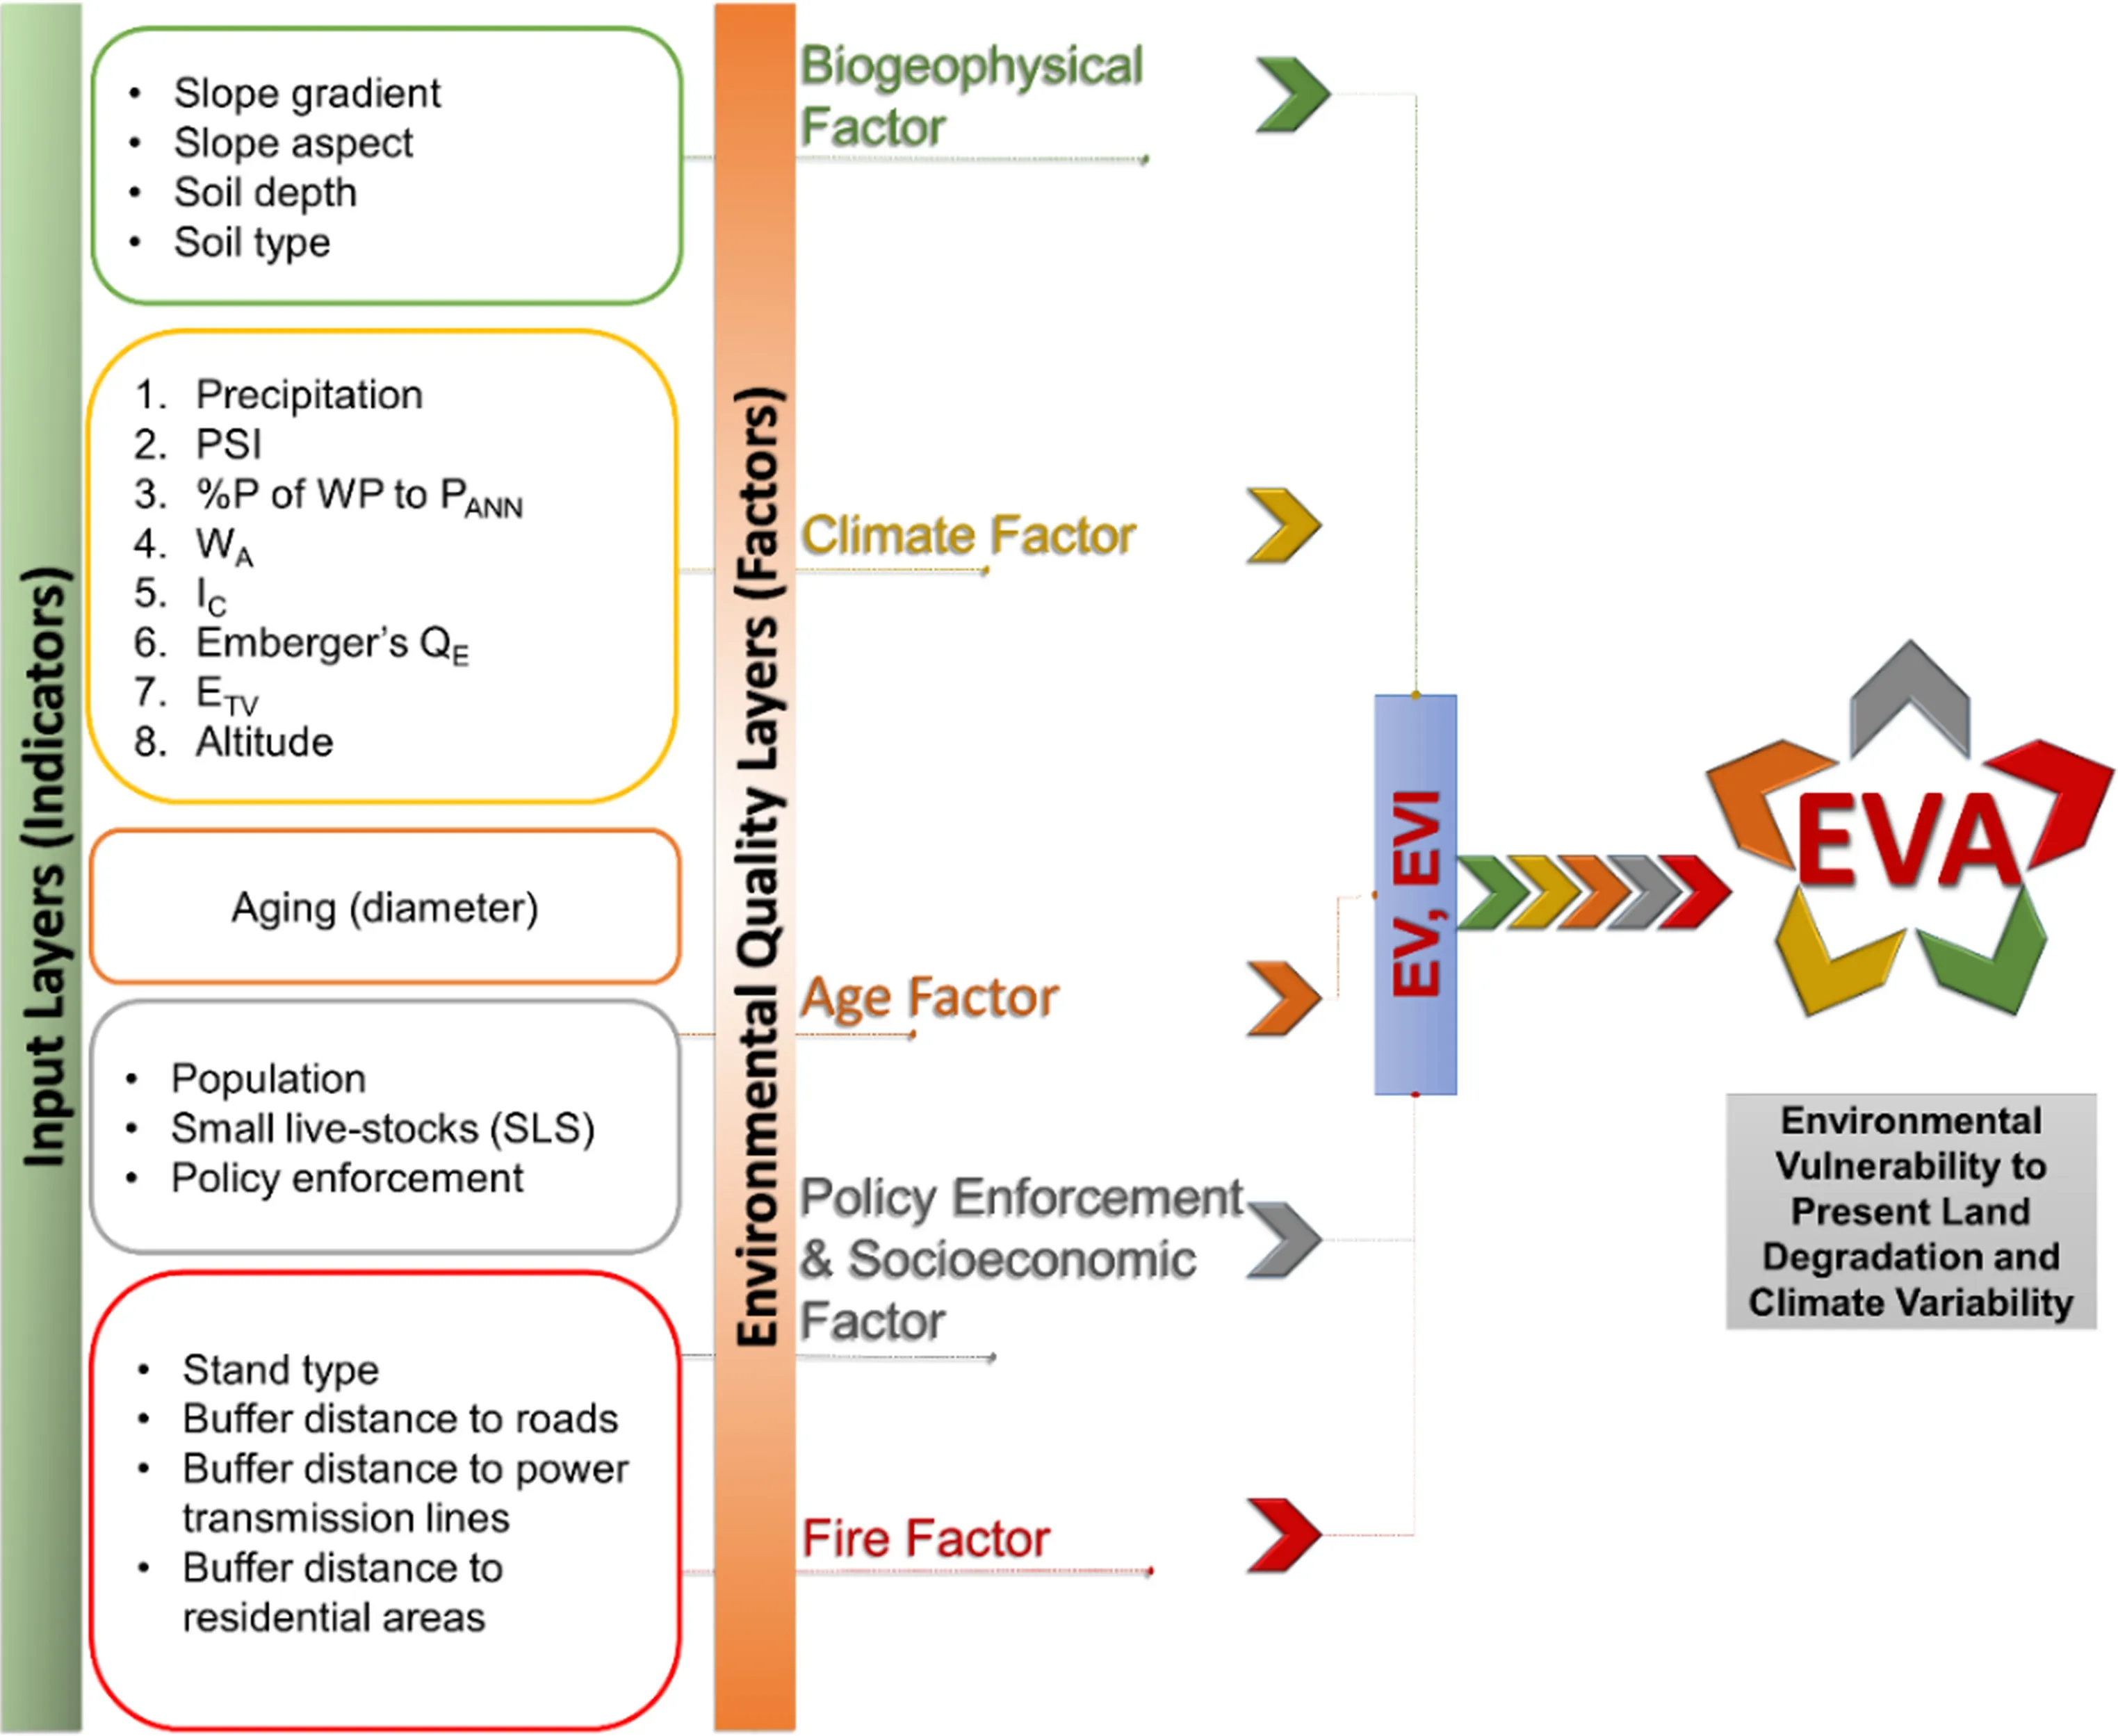
Fig.2 Simpli fied schematic representation of the algorithm of EVI and EVA
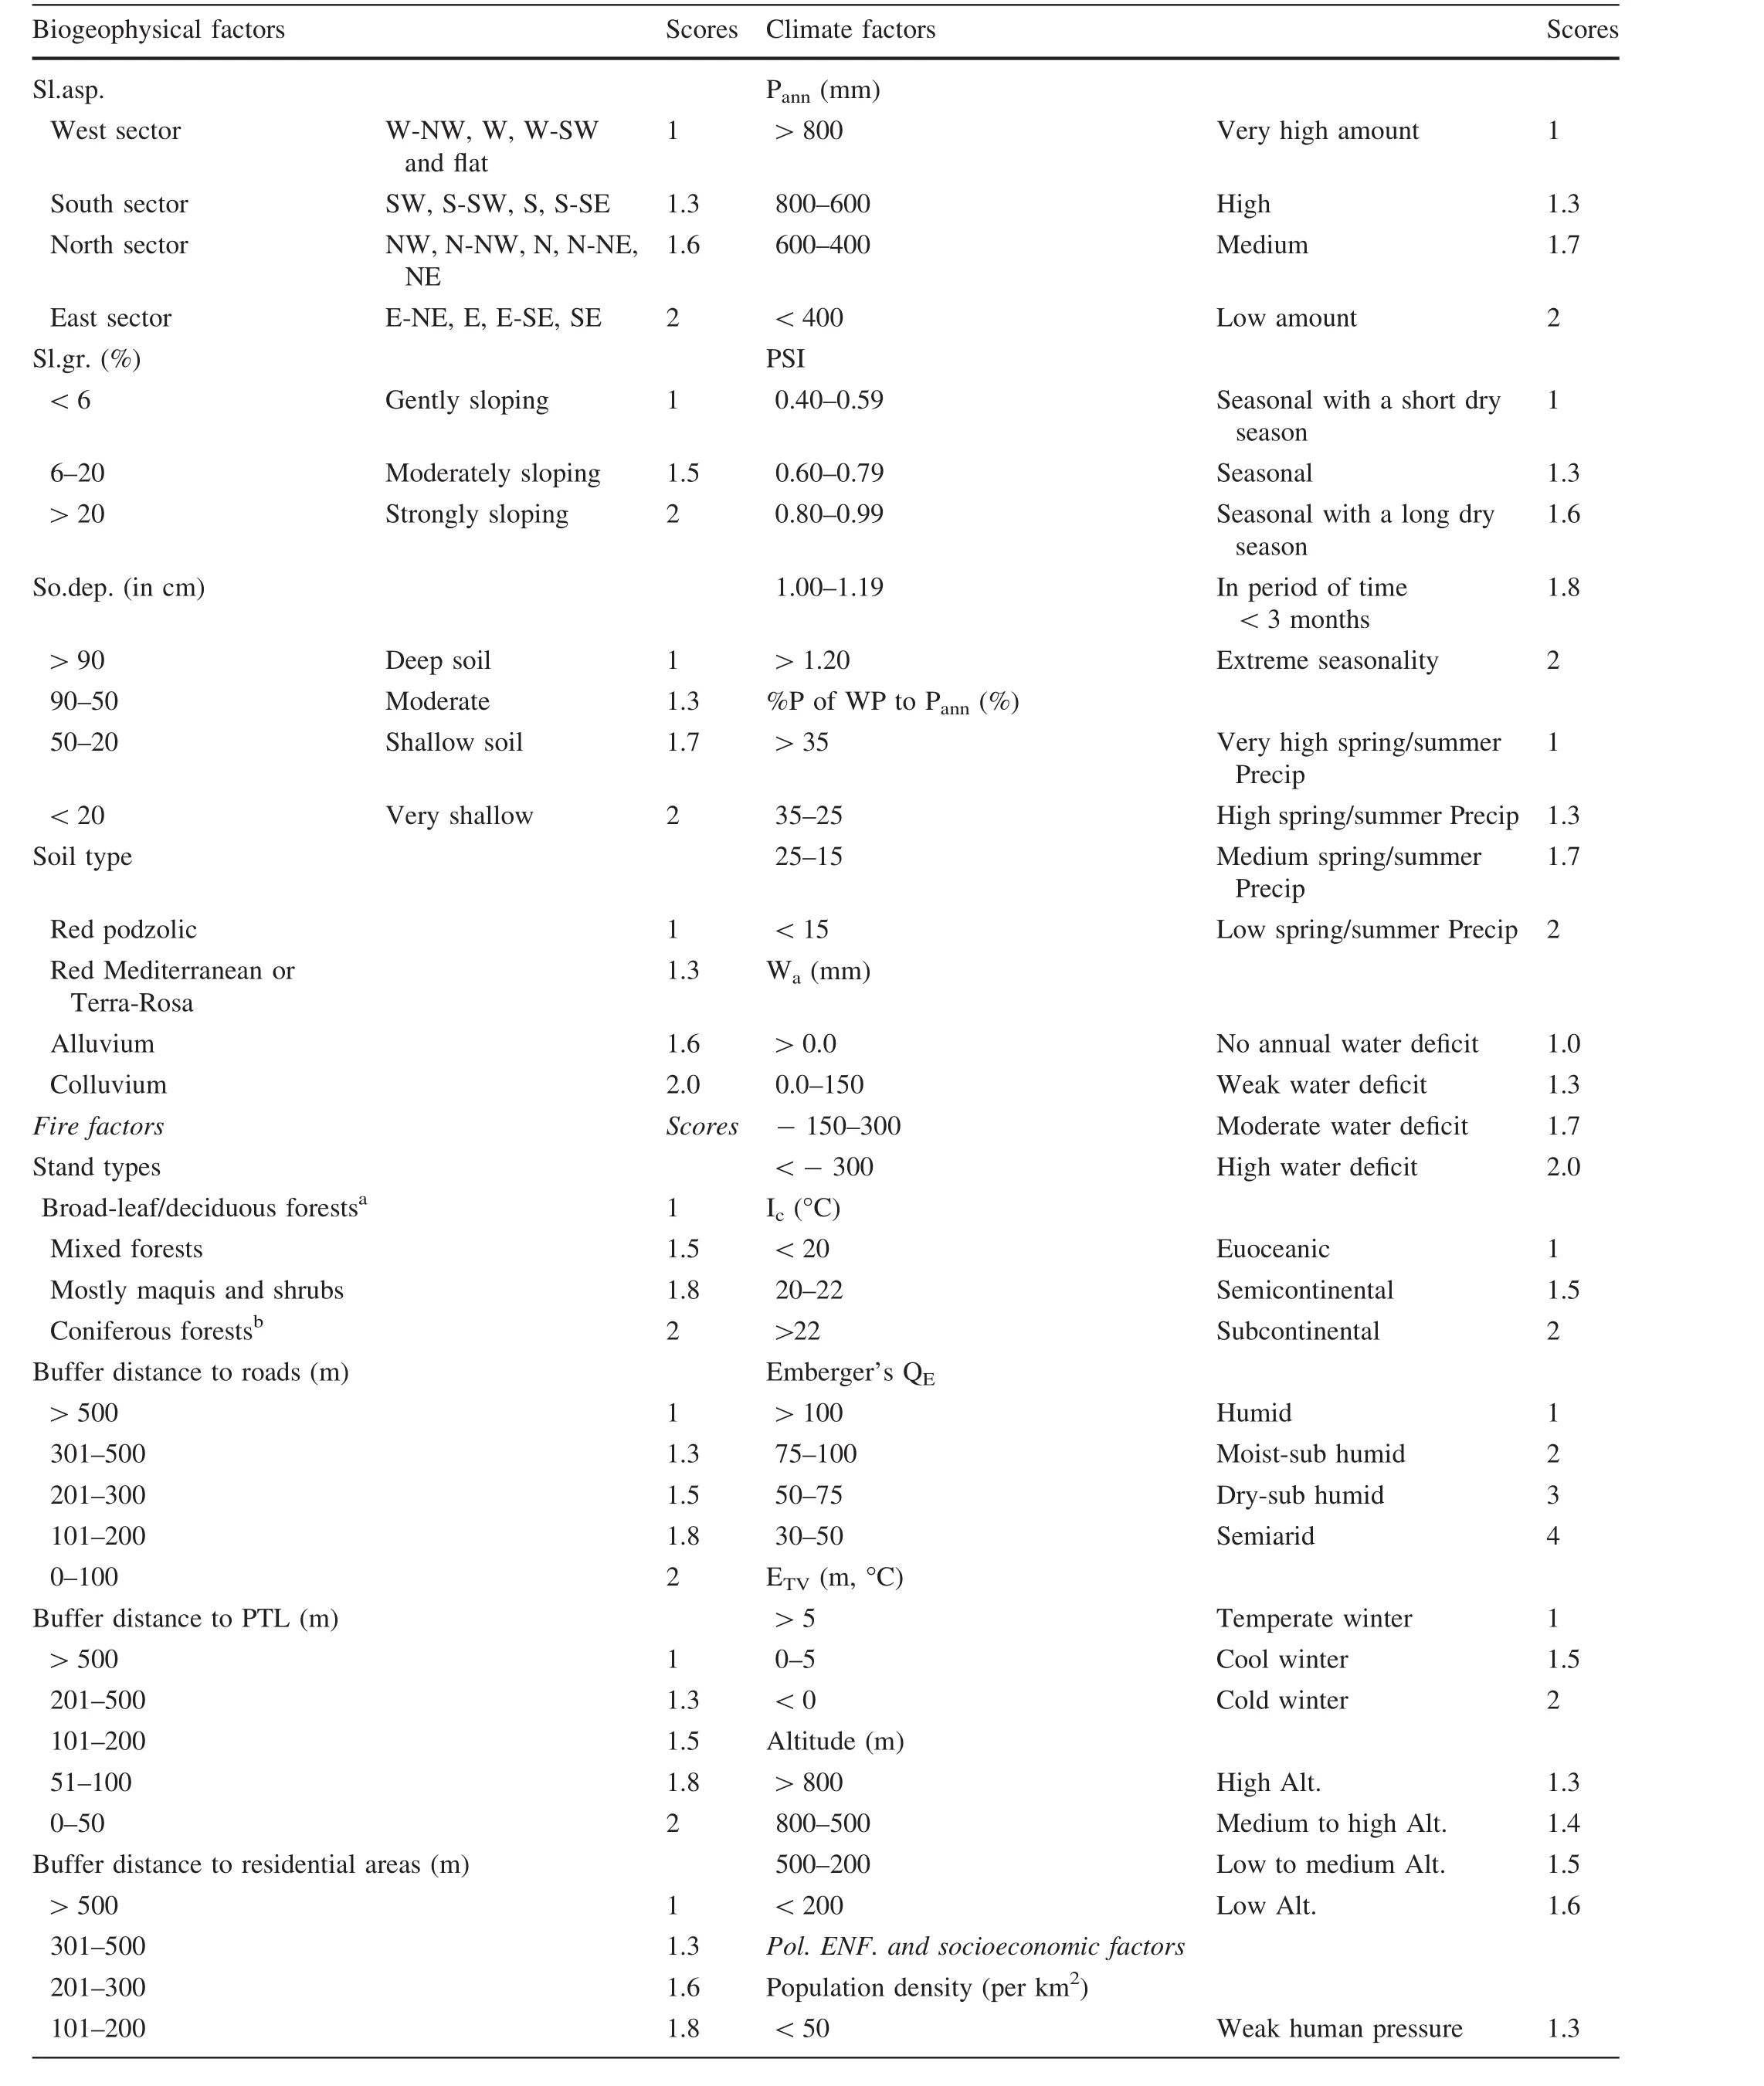
Table 1 Valuation of the environmental quality layers(EQLs)and their scores from the basic data indicators


Table 1 continued
wherei,jdenote the rows and columns of a single elementary land unit of each quality layer andnijindicates the computed quality scores.
In order to derive EVIs,the EVSs were re-arranged from 0 to 100 by normalizing them to the maximum and minimum values shown in Eq.(3).

Environmental quality layers(EQLs)and indicators
Biogeophysical quality index(BQI)
The evaluation of biogeophysical factors with to slope aspects(Sl.asp.),slope gradients(Sl.gr.in%),soil depth(So.dep.in cm)and soil types,based on the Zonal(older)system of soil classi fication in Turkey were performed using soil and topographical features in regular soil survey reports and digital topographic maps in the Geographical Information Systems(GIS)environment.
Slope aspect(topographic exposure)is a geomorphometric feature of topography and characterizes a site in terms of its protection by the surrounding landscape.The slope aspect indicator is for the purposes of evaluating the threat from wind to forest stands and used in this context in a number of studies(Lanquaye and Mitchell 2005;Ruel et al.2002;Scott and Mitchell 2005).
Soil erosion is the main process of land degradation and deserti fication in hilly and mountainous Mediterranean areas.Soil sediment loss may be estimated by the product of the amount of surface water run-off multiplied by the slope gradient,multiplied by a constant related to soil surface characteristics.As the slope becomes steeper,runoff coefficient increases,kinetic energy and carrying capacity of surface water flow becomes greater,soil/slope stability decreases and soil sediment loss increases.
Consequently,slope gradient may be considered as one of the most important determinants of soil erosion and deserti fication(Kosmas et al.1999a,b,c).Soil waterstorage capacity and effective rooting depth are mainly related to soil depth.Land degradation due to erosion is a serious threat to soil quality and productivity in hilly and mountainous areas.The effects of soil erosion on productivity depend largely on the thickness and quality of the topsoil and on the nature of the subsoil.The productivity of deep soilswith thick topsoiland excellentsubsoil properties may be virtually unaffected by erosion(Ferrara et al.1999;Kosmas et al.1999a).
According to the soil type map of the area,carbonaceous rocks are the most extensive parent material.The main soil types over hard limestone are Terra Rossa,Red Podzolic and Kolluvial.Red Mediterranean soils over non-calcareous materials form the other soil type,and this differs from Terra Rossa in terms of rock types.Among these,Terra Rossa is the most dominant soil type on the test site.
The BQI was calculated using the assigned scores of the following indicators:Sl.asp.,Sl.gr.,So.dep.and Soil Type as shown in Fig.3 and Table 1.For this purpose,the Biogeophysical Quality Score(BQS)was calculated using Eq.(1).In order to derive the BQIs,the BQSs were rearranged from 0 to 100 for simpler interpretation by normalizing with maximum or minimum values of the BQSs(Table 1)using Eq.3.
Climate quality index(CQI)
Records from 1970 to 2000 from nine climatological and meteorological stations were used to calculate the variables in performing the climate classi fication and other basic climate indices.Old records from several closed climatological stations were used to make basic climatological analysis,but these only covered a limited.Thus,the insufficiency of the records obstructed the proper implementation of an entire time series analysis that would include estimating statistical parameters and temporal trends.For the classi fication and scores of climate factors used in assessing the vulnerability of the forest ecosystem to climate variability and climate change,individual input layers were:(1)Emberger’s Pluviothermic Quotient(QE);(2)Emberger’s Thermic Variant(ETV);(3)Rivas Martinez Continentality Index(Ic);(4)Annual Precipitation Amount(Pann);(5)Precipitation Seasonality Index(PSI);(6)Percentage Precipitation of Warm/Hot Period of the Year(%PofWPtoPann);(7)Annual Climatological Water Availability(Wa);and,(8)altitude.
Emberger(1930,1932)made a synthetic expression for the Mediterranean-type climate by classifying it based on three important climatic parameters:precipitation,temperature and evaporation.The primary objective for using Emberger’s Pluviothermic Quotient(QE)is to identify bioclimatic conditions and their long-term variations with special reference to drought-prone areas and to the degradation of soil and water resources in and around the study area.It is calculated with the following formula in which air temperature values are expressed in absolute degrees(K=273+°C):

wherePidenti fies the annual precipitation in mm,TmaxandTminde fine the average maximum air temperature of the hottest month expressed in K,and the average minimum air temperature of the coldest month expressed in K,respectively.The higher the aridity of the index in an area,the greater the water resource variability and scarcity over time,and the more vulnerable the area is to climate change and variability(including droughts and deserti fication).Along with the other indicators,this contributes to the production of a scale for the state of health of soil and water resources,natural ecosystems,communities in the Mediterranean biotopes and consequently,to the creation ofmultifunction management/developmentplansand strategies which are compatible with the resources available in the study region.

Fig.3 Geographical distributions of the biogeophysical indicators:slope aspect,slope gradient,soil depth and soil type
The Emberger Thermic Variant(ETV)expresses the degree and the duration of the critical frost period in a generic,simple and useful way(Emberger 1930,1932).The lower theTminvalue,the more severe these conditions are.The Rivas Martinez climate classi fication methodology determined a generic worldwide climate classi fication into five macro bioclimates(tropical,Mediterranean,temperate,boreal and polar)based on bioclimatic indices(Rivas Mart´ınez 1987,1996).A continentality index(Ic)was also used with a simple classi fication for types and subtypes of continentality/oceanality conditions which expressed the range between monthly mean air temperatures of the warmest(Twarm)and the coldest(Tcold)months of the year.
Precipitation is a fundamental indicator because it is the primary factor for aridity/humidity,soil water and soil erosion,and because of its in fluence on the development of natural communities and biotopes.Seasonality is one of the most important climate characteristics in the subtropical Mediterranean climate regions,particularly due to its dry and hot summer type which is classi fied ‘‘Csa’’according to the Ko¨ppen–Geiger climate classi fication(Tu¨rkes¸2010).Consequently,the objective of this indicator is to assess the importance of the seasonal variations of the precipitation that affect drought,deserti fication,and soil and vegetation characteristics.Precipitation Seasonality Index (PSI),derived by Walsh and Lawler(1981)and calculated for Turkey based on the de finition of Glantz(1987),is expressed by the following formula:

wherePTiis the annual precipitation total(mm)for the particular yeariin the study period;Pijis the actual monthly precipitation total(mm)for monthj,and overall average of the monthly precipitation totals(mm)in the yeari.
In addition to the PSI,the percentage precipitation value of the warm/hot months(April to September)was compared with the annual precipitation total(%PofWPtoPann)in order to study the present and future precipitation contribution of the warmest months to the annual precipitation amount and its variability.
Potential evapotranspiration(PET),which describes the capacity of the prevailing climate to evaporate water from soils,plants,open water and other surfaces,is used with precipitation data to calculate climatic water balances.Since water availability is an important determinant of an ecosystem’s structure and function,understanding and predicting current and future changes and variability during peaks of biological demand are of critical importance.Some recent efforts have led to the synthesis of empirical evidence with projections from global and regional climate models to develop a better understanding of how biological communities and forest ecosystems may adapt(Yukon College 2011).In this study,the annual climatological water availability(Wa)(i.e.,climatic surface water balance)was estimated from differences between the amounts(mm)of annual precipitation(Pann)and potential evapotranspiration(PETann)to reveal present and future conditions and changes in the climatological soil water balance.This was done with a simple approach:Wa=(Pann-PETann).
The CQI was calculated using the assigned scores of the following nine indicators:QE,ETV,Ic,Pann,PSI,%PofWPtoPann,Waand Altitude(Alt.)as shown in Fig.4 and Table 1.The Climate Quality Score(CQS)and CQI were determined with calculations similar to those of the previous section.
Aging quality index(AQI)
Due to the combination of information from various sources into one map,forest stand maps produced in 1997 and 2012 by the GDF(1:25,000)were compared to determine land cover changes(GDF 2012).Forest stand maps incorporate all the information regarding a forest area such as age development classes,plant taxon types(mainly forest trees,maquis and other shrubs).The information is useful to determine spatial and temporal changes of vegetation.The AQI used in this work is based on tree diameters(cm)(Fig.5).Development age classes are based on tree diameters at five scales:A to E having diameter ranges of 0–7.9,8–19.9,20–35.9,36–51.9,and greater than 52 cm,respectively.Figure 5a,b show spatial variations and quantitative changes in development age classes between 1997 and 2012.
The geographical distribution of the Aging Factor estimated indirectly from the stand development classi fication of the forest species recorded a substantial reduction in class A for 1997.However,large diameter trees were already rare in 1997 or,in other words,large diameter trees have been shifted to larger diameter classes.
Based on common methodology,the Aging Quality Score(AQS)using the assigned scores of the stand developments(cm)and the AQI was calculated.
Policy enforcement and socioeconomic quality index(PQI)Policy Enforcement and Socioeconomic Factors include the effects of human and livestock(grazing)pressures on the pilot site.PQI states the effectiveness of the policies related to environmental protection and the ecosystem approaches for sustainable ecological forest management.
The PQI was calculated using the assigned scores of Population Density,Number of Small Livestock(SLS),and the Policy Enforcement and Preserving Status,as shown in Fig.6 and Table 1.The Policy Enforcement and SocioeconomicQuality Score(PQS)andPQIwerealso determined.
These factors were classi fied according to the degree to which they are enforced for each land use.After collecting information on existing policies with regard to preserving the status and the socioeconomic situation of the area,local experts evaluated them.Therefore,the degree and implementation of the existing policy enforcement and the ability to preserve the status of the study site were determined.
Fire quality index(FQI)
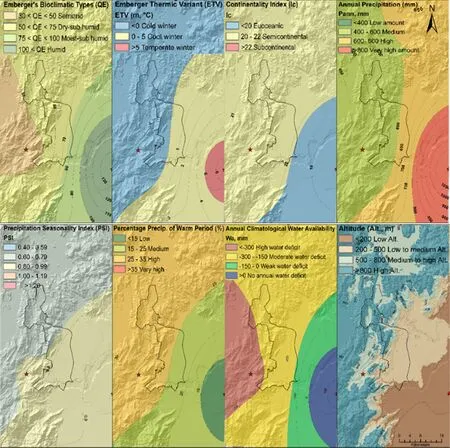
Fig.4 Geographical distribution of the climate indicators
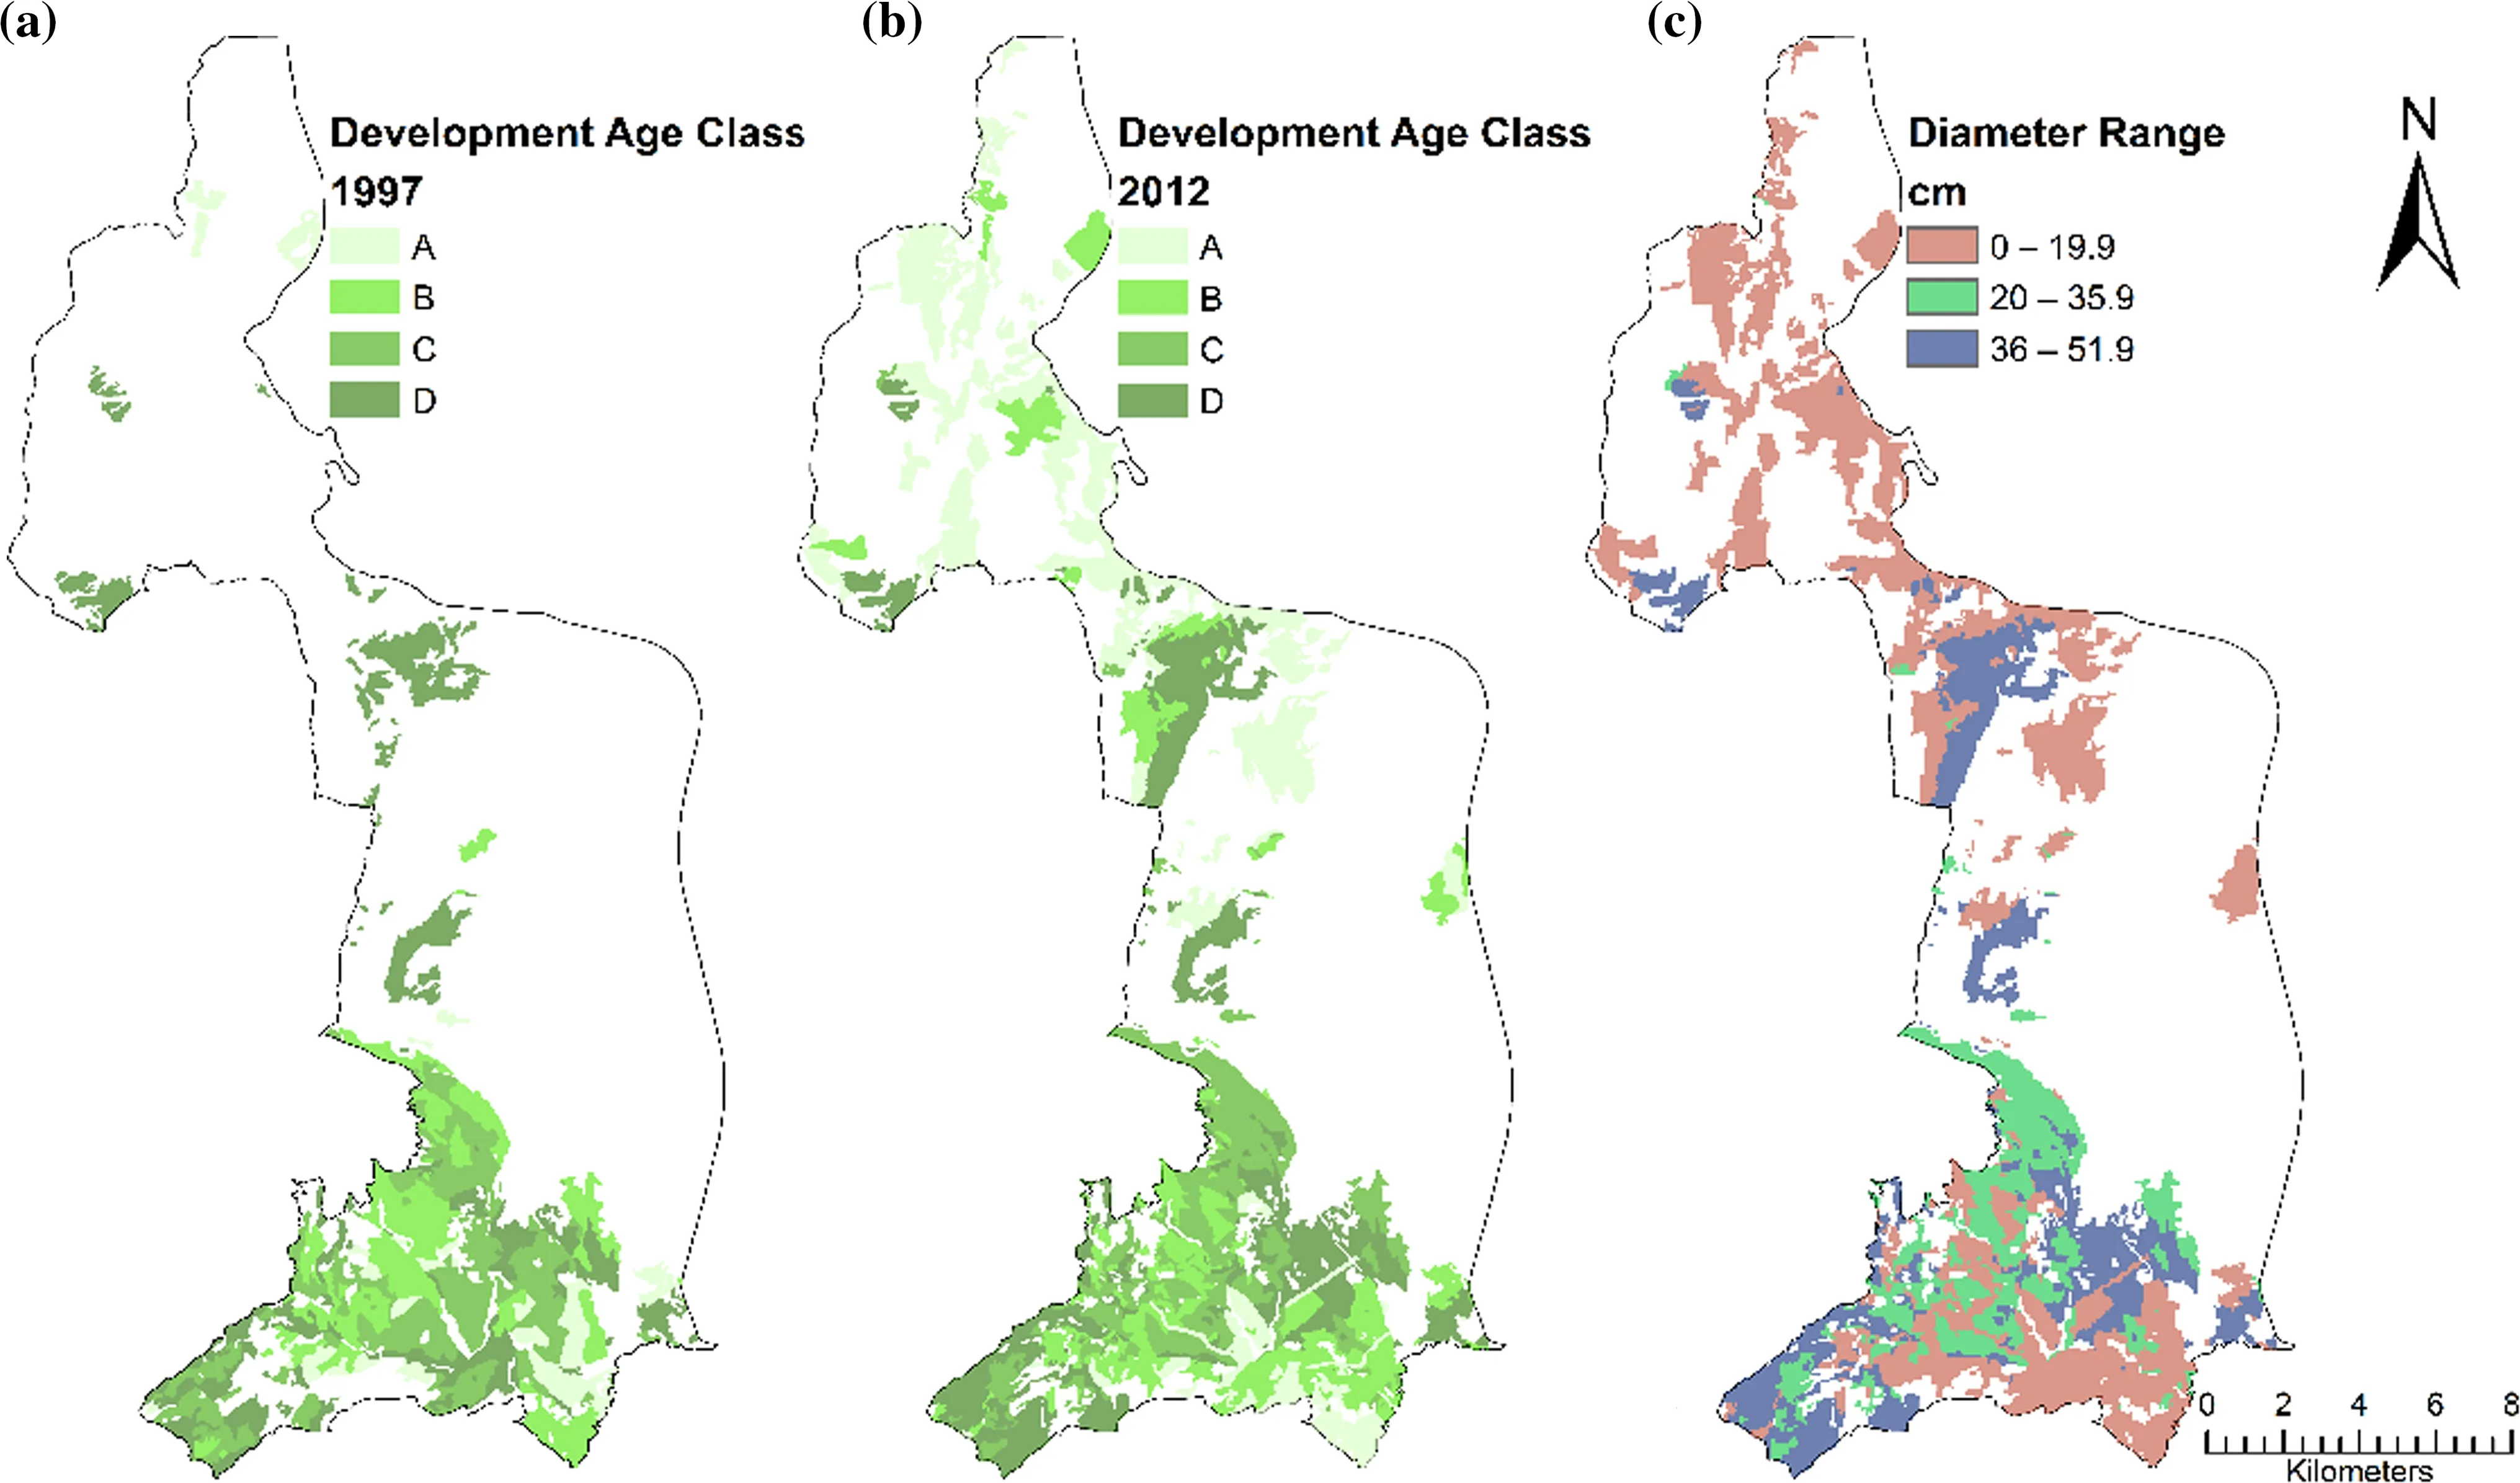
Fig.5 Spatial variations of development age classes in a 1997 and b 2012 and c diameter range
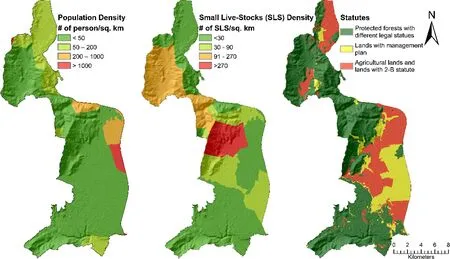
Fig.6 Geographical distribution of socio-economic indicators
Understanding and assessing fire quality in a forest area of the Mediterranean biotope with respect to climate change,land degradation and deserti fication is an important topic for consideration for the vulnerability analysis of forest ecosystems in Turkey and other Mediterranean countries(Altan and Tu¨rkes¸2014).Fires ignited by natural causes have always interacted with ecosystems,and have a signi ficant in fluence on ecosystem functions.Fire recycles nutrients,reduces biomass,and in fluences insect and disease population dynamics.It is the principal agent affecting vegetative structure,composition and biological diversity(Altan et al.2011).Fires remove vegetation and affect the litter layer formation,which plays a major role in the prevention of soil erosion caused by raindrop impact and overland flow.Thus,the risk of soil degradation is very high immediately after a fire,which decreases as the plant cover regenerates.Signi ficant losses of forest vegetation and woody biomass result in a long-term impact on the natural environment,ecosystems and biological communities,even though there are more direct fire indicators such as area burned(km2)and fire frequency(number of fires per year on a de fined area or a forest territory recorded over a long period).
The FQI was calculated using assigned scores of the following indicatorsand/or fire threat/risk elements:Vegetation(Stand)Type,Buffer Distance to Roads,Buffer Distance to Power Transmission Lines(PTL)and Buffer Distance to Residential Areas as indicated in Fig.7 an
d Table 1.For this purpose,the Fire Quality Score(FQS)and FQI were determined similar to the previous section.
For this study,the preference was to consider indirect indicators and/or fire threat/risk elements because the number of fire events per year is low and the study area is characterized by management plans,of which only a few are concerned with preserving the status.In the coastal belt of the Mediterranean region,including Antalya and the surrounding forest ecosystems,higher rates of soil erosion and the risk of forest fires can be observed along the southeastern to northern-facing slopes,rather than in south south-eastern to west north-western-facing slopes.This is because of the fo¨hn effects,a dry,warm down-slope wind in the lee of a mountain,of northerly circulations,and dry,hot winds which originate in the arid-lands and deserts of the Middle East during the warm/hot months of May to October(Tu¨rkes¸2015).
Spatiotemporal analysis of land use/land cover(LULC)change
Satellite remote sensing measures land-surface properties temporally in the spectral domain with a time series of observations.The availability of multiannual time series images from coarse to medium spatial resolution and everincreasing processing capabilities have made the production of regular land cover maps,even at the global scale,much more feasible(Giri 2012).Remotely-sensed data with large spatial coverage and temporal continuity has become mainstream data sources for land cover mapping and change detection(Musaoglu et al.2005;McRoberts and Tomppo 2007;Herold et al.2008;Cetin et al.2008;FAO and JRC 2012;Musaoglu et al.2005;Chen et al.2015).For this reason,remote sensing is widely used to detect forest change and to update existing forest maps(Desclee et al.2006).
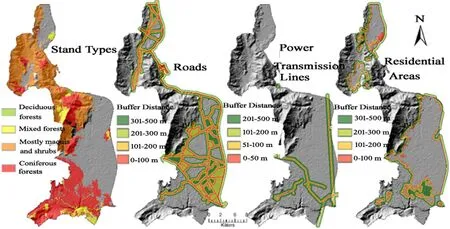
Fig.7 Geographical distribution of fire indicators and/or threat/risk elements
In this study,a time series of Landsat images were used to analyze temporal land use/land cover changes due to their free availability from the USGS website.Images that were cloud-free and acquired nearly the same time of the year(1 June 1988 Landsat TM,1 June 2000 Landsat ETM,19 June 2006 Landsat ETM+,25 August 2010 TM and 27 April 2013 Landsat 8)were chosen.SPOT 4 XS and 1998,2000 and 2006 SPOT 1 images taken at much higher resolutions were used to both support the selection and to achieve a more reliable accuracy assessment.This assessment determines the quality of a map created from remotely sensed data.An error matrix compares information from reference sites to information on the map for a number of sample areas.The matrix is a square array of numbers set out in rows and columns,which express the labels of samples assigned to a particular category in one classi fication relative to the labels of samples assigned to a particular category in another(Congalton and Green 2008).
The overall objective of image classi fication procedures is to categorize automatically all pixels in an image into land cover classes or themes(Lillesand et al.2004).These land cover classes in numerous natural resource applications describe the spatial distribution and pattern of land cover,to estimate the actual extent of various cover classes,or as input for habitat suitability models,land cover change analyses,hydrological models,and risk analyses(Stehman and Czaplewski 1998).In this study,for the classi fication of forest types,a pixel-based supervised classi fication method was selected,which can be applied for both linearly and nonlinearly separable data,entitled Support Vector Selection and Adaptation(SVSA).Landsat time series images were classi fied into 13 land-cover classes.The validation of the spatial/temporal analysis of the landcover change map and their accuracy according to the temporal sampling of the Landsat images was determined through the selection of approximately 50 Landsat pixels for each class.These pixels were chosen to represent each land cover type,and each sample test was identi fied from corresponding SPOT XS images by visual interpretation supported by photographs,stand maps and local expertise.

Table 2 Calculated values in ranging data from 0 to 100 for the normalization of the EQSs and EVSs under present conditions
Results
Vulnerability analysis of the forest ecosystem under present conditions
All the data and information de fining the five environmental qualities were inputted to a regional Geographical Information System and overlaid in accordance with the developed algorithm and maps of the EVAs to reveal any Environmental Degradation(ED)(e.g.,Land and Ecosystem Degradation,Drought and Deserti fication,Climate Change)).This approach includes many indicators,which can be found in existing soil,stand(vegetation)type,topography and geomorphology,climate,forest fires,socioeconomic,and management reports and various kinds of data and information for the forest district.
TheEQlayer acts as a buffer between the level 1 data layers and the derivedEVAlayer,level 3.By using the fiveEQSsobtained from the above EQLs,we estimated theEVSs using Eq.6(Table 2).

wherei,jdenote the rows and columns of a single elementary land unit of eachVQ;VQnijimplies the computed values.
After the computation of fiveEVSs andEVIs for each factor group(VQ),theEVAs to theEDwere de fined by combining them at present physical geographical and socioeconomic conditions.
Spatial magnitude of the current EVAs
The geographical distribution of the EVAs based on the estimated EVI values at current levels of environmental degradation,physical,geographical,policy enforcement and socioeconomic conditions is shown in Fig.8.
Most of the forest area in the study site presents different degrees of environmental vulnerability varying from very low to high.The area with very low vulnerability covers mainly the town,its surrounding settlements,the agricultural lands found over the low and flat travertine plateau and the plain in the eastern and south-eastern parts of the district.
The spatial magnitude of the EVAs under the current ED was determined(Fig.8).The environmental vulnerability ranges from EVAs classed as ‘‘very low’’,accounting for approximately 20.59%of the area,to those classed as‘‘low’’for 36.04%,to those classed as ‘‘medium’’for 20.0%,and those classed as ‘‘high’’accounting for 24.0%of the area.

Fig.8 Geographical distributions and spatial magnitudes(table)of the EVAs over the entire study region,based on the estimated EVI values under present conditions
Changes in forest cover
In this study,approximately 50 Landsat pixels for each class were selected to validate the classi fication(Fig.9)and independently develop an error matrix.The validation of the spatial/temporal analysis of a land-cover change map and its accuracy according to the temporal sampling of Landsat images are given in Table 3.The accuracy assessment of the classi fication results from the 1988 to 2013 Landsat images was presented by error matrices representing overall accuracy,as well as the kappa coefficients.An overall classi fication accuracy,which identi fies the percentage of correctly classi fied samples of approximately 90% for each year of the classi fication,was obtained from the 1988 and 2013 Landsat time series images.
Although temporal land-cover classi fication performances were all satisfactory,those for wetland had a higher accuracy for each classi fication compared to the other land-cover types.For forest areas,the accuracy of classes associated with juniper,oak,and cedar for all 5 years was very high.For the accuracy of thePinus brutiaclass,only that of 2013 is relatively low.
While there were high levels of agreement between the classi fied maquis in the satellite imagery and the ground data for 1988,2000 and 2006,there was only a fair agreement in 2010 and 2013.The classi fication results,summarized in Fig.10,show thatPinus brutiadecreased rapidly in 2000,but increased again.
This information indicates that there was regenerating vegetation after the forest fire of 1997,and very limited regeneration between 2010 and 2013.Regenerating vegetation grew in the south of the study site where the fire had occurred.Considering the quanti fication of changes in mining areas,those within the site increased by 87%from 1988 to 2000,and by 7%from 2000 to 2006.Due to increased regulations,mining activities have not grown since 2006.
Discussion and conclusions
Most of the western and portions of the southern half of Turkey,including the study area,are generally characterized by a dry-summer subtropical Mediterranean macroclimate,a hot and dry-summer climate and partly a more continental warm and less but still dry-summer climate.By considering the in fluence of the Western Taurus Mountains that surround the study area,it is very clear that it has a unique microclimate between the ‘‘real’’dry and hot summer maritime Mediterranean climate and the dry and warm summer mountain-type Mediterranean climate with some continentality effects.
The capability of temporal stand maps,coupled with remote sensing images and meteorological station-based data,allow the prediction of several issues regarding current and future vulnerabilities in the study area.As with almost all natural forests and forested areas in Turkey,the study site is state-owned and managed by the General Directorate of Forestry under the Ministry of Forestry and Water Affairs.The total forest area has not changed significantly since 1997 because forests within the pilot site are a Wildlife Protection and Improvement Area.However,studies indicated that land use practices around the study site have destroyed the ecosystem.The evaluation of temporal change analysis from 1997 and 2012 stand maps indicate the trend of converting prime agricultural lands to residential areas.
Forest areas classi fied as maquis(dense scrub vegetation characteristic of Mediterranean coastal areas)in 1988 linearly decreased and became degraded maquis due to overgrazing and urbanization,including infrastructure services and 2B(degraded forest)lands.However,there is no longer any danger of overgrazing because of decreased livestock activities.The main concern about the conversion of maquis to other uses is urbanization.In response to the forest fire of 1997,the Directorate of Forestry in the district established the International Fire Training Centre located in the test site.However,high–voltage–power lines,installed to meet the demands of rapidly growing urban areas,have continued to threaten forests and migrating birds.
The most interesting change trajectories include the conversion from agricultural lands to settlements and industrial areas.Additionally,areas covered by maquis vegetation in 1997 have low levels of urbanization but high forestation rates.The results summarized here show clearly that the densest forest ecosystem in the southern part of the study site is mainly Mediterranean coniferous and some mixed forest and maquis vegetation.This area currently has Mediterranean climate conditions,but will likely have medium to high degrees of vulnerability with respect to the future environmental degradation,climate change and variability.The current vulnerability of the Du¨zlerc¸amı forest district is due to negative human in fluences related to the increased number of new recreational facilities,in addition to the effects of climate change over the western Mediterranean sub region.To reverse this trend,reasonable reductions could be in the number of visitors coming to existing and/or future recreation areas.Furthermore,species variations should be considered by using these parameters in the forest management plans.

Fig.9 Comparison of land-cover classi fication results for 5 years

Table 3 Overall accuracy and kappa values of land-cover classi fication results based on Landsat imageries
Ultimately,the geographical distribution of the EVAs based on estimated EVI values shows that the area with a‘‘very low’’vulnerability covers mainly the town,its surrounding settlements and the agricultural lands found over the low and flat travertine plateau and the plain in the eastern and southeastern parts of the district.The spatial magnitude of the EVAs at current levels of environmental degradation determined that classes with ‘‘very low’’and‘‘low’’EVAs cover about 94 and 165 km2respectively,whilst ‘‘medium’’and ‘‘high’’environmental vulnerability classes cover areas of,respectively,about 89 and 110 km2.
AcknowledgementsThe authors thank the Food and Agriculture Organization of the United Nations(FAO)and Turkish General Directorate of Forestry for giving us this opportunity.Special thanks to Dr.Valentina Garavaglia of FAO for her professional guidance and valuable support and to Dr.Nes¸at Erkan for his useful and constructive recommendations on this study.
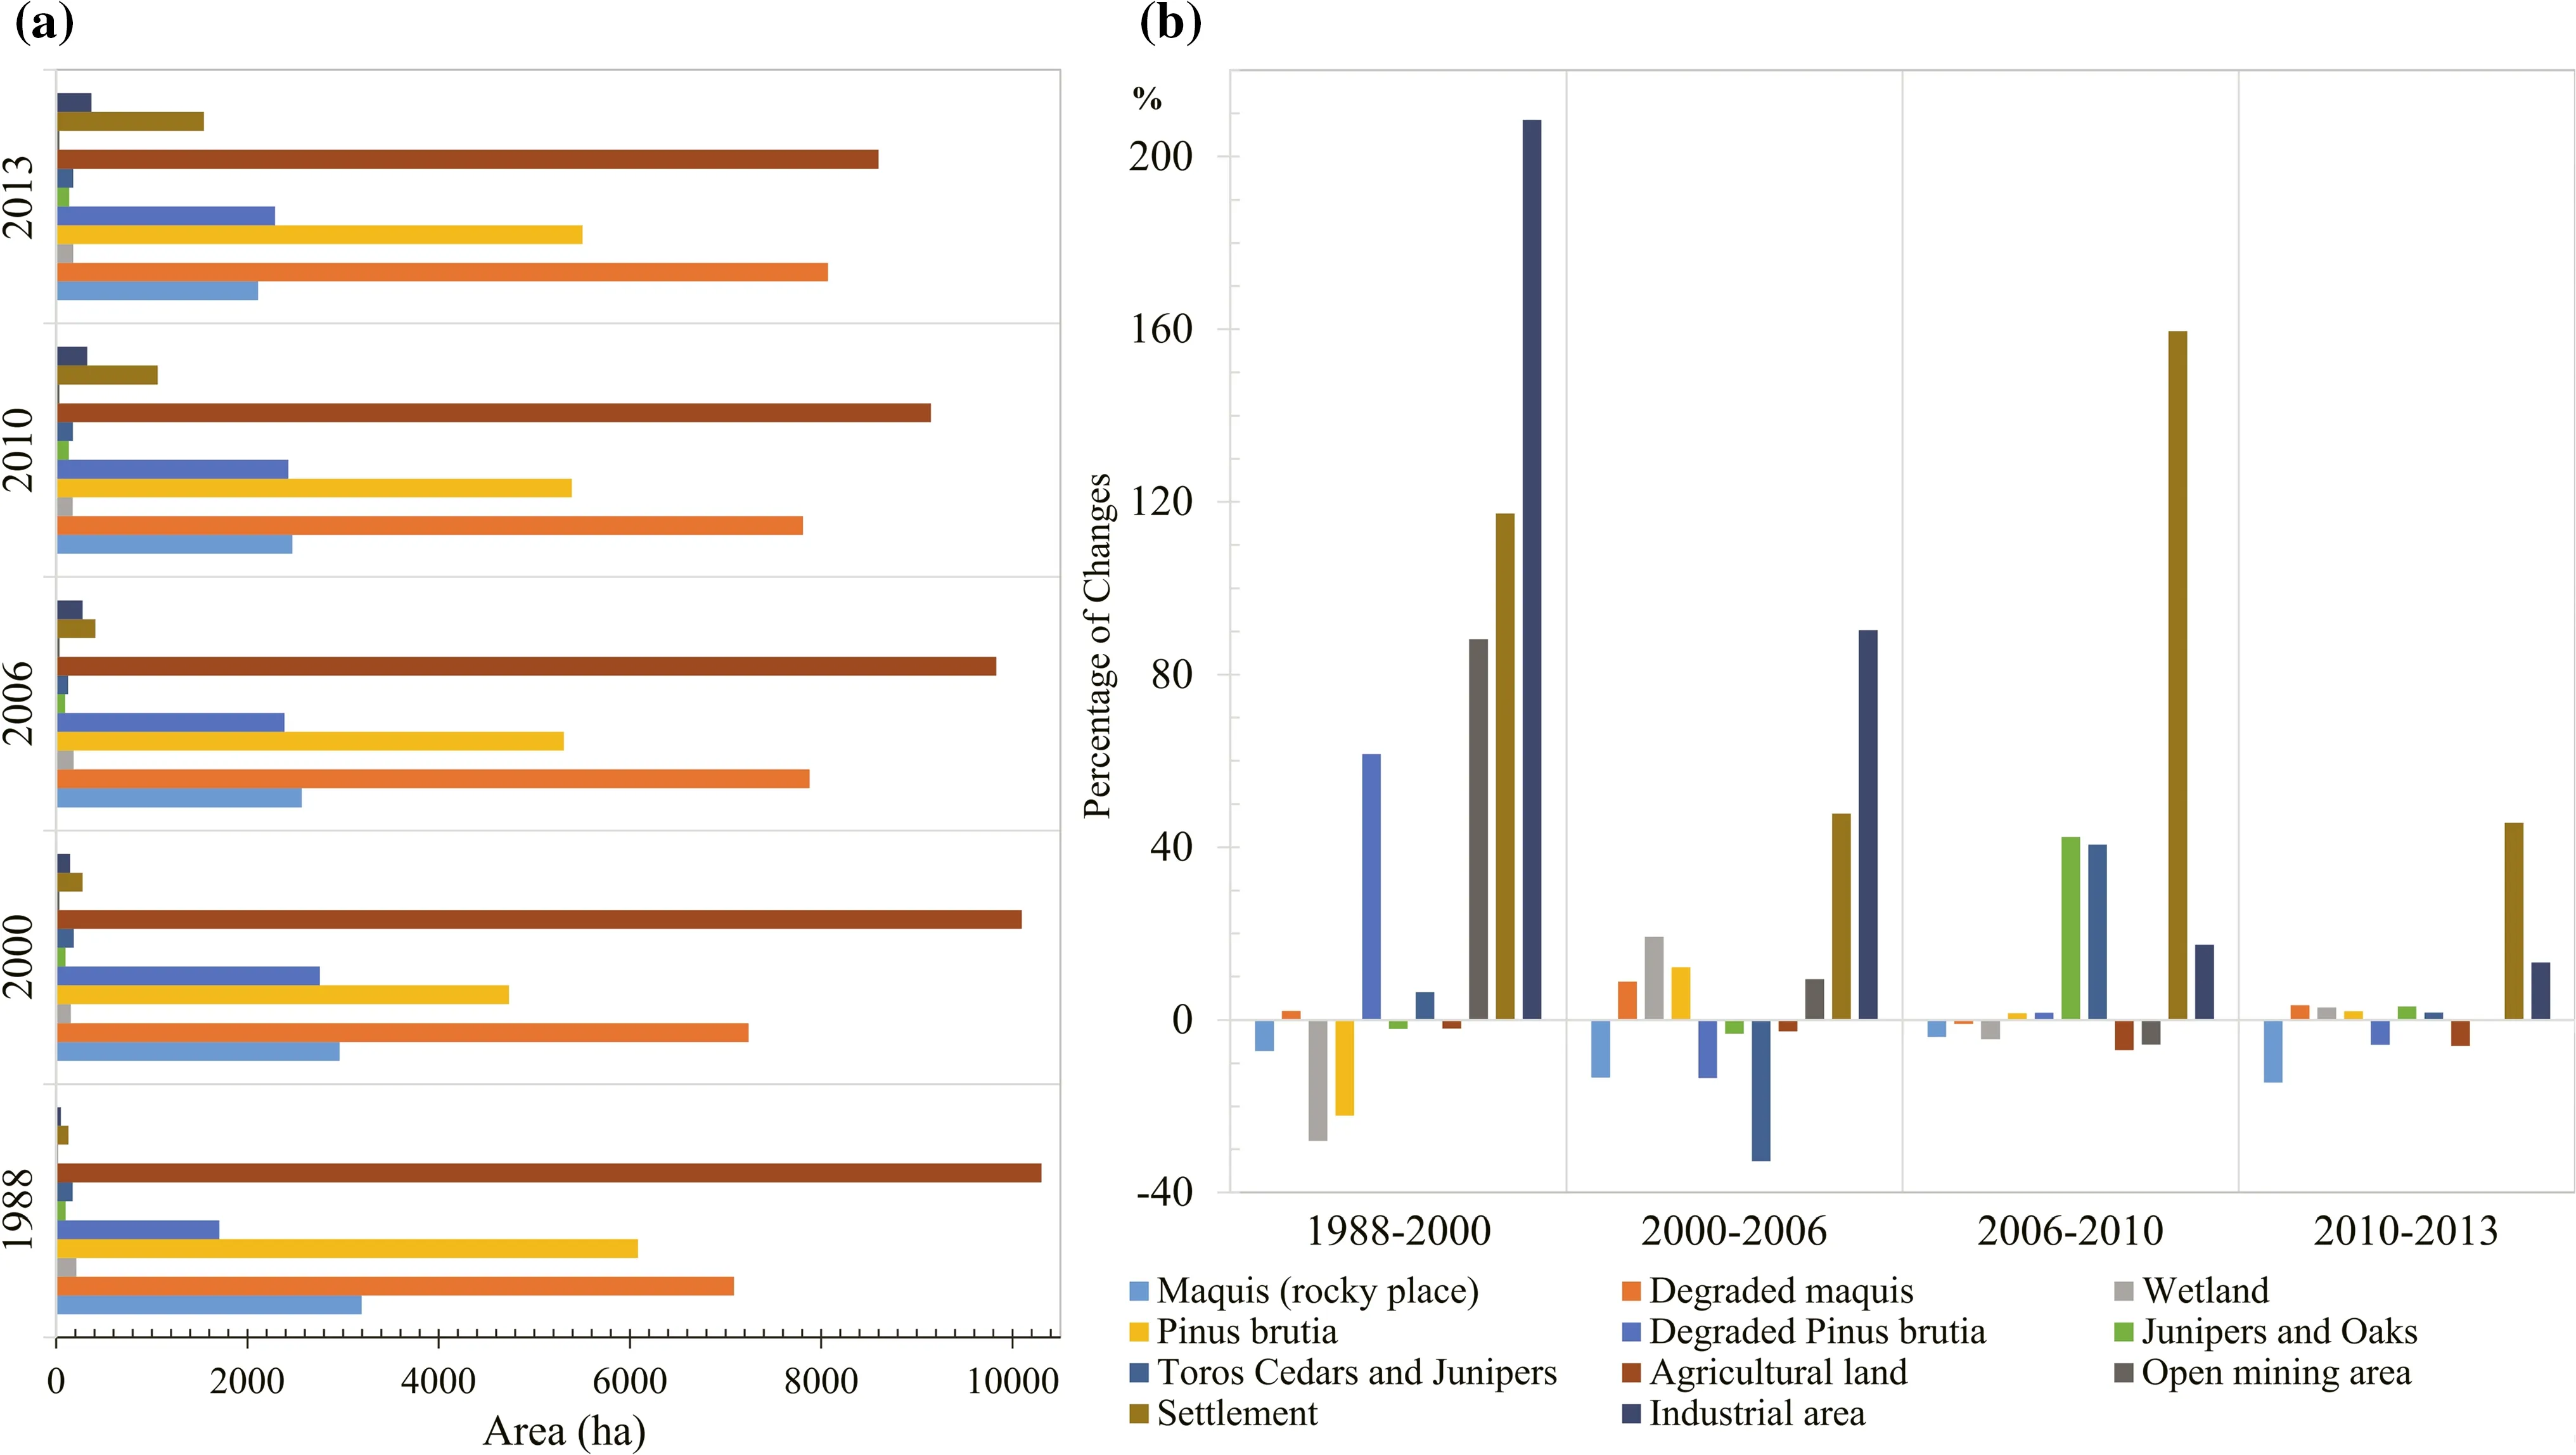
Fig.10 a Areal comparison and b percentage of changes of temporal land-cover classi fication results between years
References
Altan G,Tu¨rkes¸M(2014)Hydroclimatologic characteristics of the forest fires in the C¸anakkale district and relationship with climate variations.Ege Cog˘rafya Dergisi 20(2):1–25(in Turkish)
Altan G,Tu¨rkes¸M,Tatlı H(2011)Climatological and meteorological analysis of forest fires for the year 2009 in C¸anakkale and Mug˘la with the Keetch-Byram Drought Index.In:5th atmospheric science symposium proceedings,27–29 April 2011:I˙stanbul,pp 263–274(in Turkish)
Barbero M,Bonin G,Loisel R,Que´zel P(1990)Changes and disturbances of forest ecosystems caused by human activities in the western part of the Mediterranean basin.Vegetation 87(2):151–173
Basso F,Bove E,Dumontet S,Ferrara A,Pisante M,Quaranta G,Taberner M(2000)Evaluating environmental sensitivity at the basin scale through the use of GIS and remotely sensed data:an example:covering the agriculture basin Southern Italy.CATENA 40:19–35
Camuffo D,Bertolin C,Diodato N,Barriendos M,Castro F,Cocheo C,Valle A,Garnier E,Alcoforado M(2010)The western Mediterranean climate:how will it respond to global warming?Clim Change 100(1):137–142
Cetin M,Musaoglu N,Tanık A(2008)Multi-temporal assessment of land-use change in a rapidly urbanizing coastal region in Turkey using remote sensing.Environ Eng Sci 25(6):917–928
Chen X,Yang D,Chen J,Xin C(2015)An improved automated land cover updating approach by integrating with downscaled NDVI time series data.Remote Sens Lett 6(1):29–38
Congalton RG,Green K(2008)Assessing the accuracy of remotely sensed data:principles and practices.CRC Press,Boca Raton,p 200
Desclee B,Bogaert P,Defourny P(2006)Forest change detection by statistical object based methods.Remote Sens Environ 102:1–11
DIS4ME(2014)Deserti fication indicators system for Mediterranean Europe.http://www.kcl.ac.uk/projects/desertlinks/indicator_sys tem/esi_jan_05/method.htm.Accessed 15 April 2014
Emberger L (1930)Sur une formule climatique applicable en geographic botanique.Comptes Rendus Hebdomadaires des Se´ances.Academie des Sciences Paris 191:389–391
Emberger L(1932)Sur une Formule Climatique et Ses Applications en Botanique(On a climatic formula and its application in Botany).La Me´te´orologie 192–193:423–432
Erol A,Randhir TO (2012)Climatic change impacts on the ecohydrologyofMediterraneanwatersheds.Clim Change 114(2):319–341
FAO,JRC(2012)Global forest land-use change 1990–2005.In:Lindquist EJ,D’Annunzio R,Gerrand A,MacDicken K,Achard F,Beuchle R,Brink A,Eva HD,Mayaux P,San-Miguel-Ayanz J,Stibig H-J(eds)FAO Forestry Paper No.169.Food and Agriculture Organization of the United Nations and European Commission Joint Research Centre.Rome,FAO
Ferrarsa A,Bellotti A,Faretta S,Mancino G,Taberner M(1999)Identi fication and assessment of environmentally sensitive areas by remote sensing.MEDALUS III 2.6.2.OU Final Report.King’s College,London.2:397–429
GDF(2012)Forest inventory results—2012.Forest Management and Planning Department Publication No:86,Inventory Series No:13,Ankara 2012
Giri CP(2012)Remote sensing of land use and land cover:principles and applications.In:Weng Q(ed)CRC Press,Boca Raton
GIZ(2013)Guide me´thodologique:Approche spatiale multifactorielle d’analyse de la vulne´rabilite´des e´cosyste`mes face au changement climatique Cas de la sube´raie en Tunisie.Deutsche Gesellschaft fu¨r Internationale Zusammenarbeit(GIZ)—GmbH;Ministe`re fe´de´ral allemand de la Coope´ration Economique et du De´veloppement(BMZ)and Appui a`la mise en oeuvre de la Convention Cadre des Nations Unies sur le Changement Climatique(CCNUCC)en Tunisie,Tunisia
Glantz MH(1987)Drought,famine and the seasons in sub-saharan Africa.Afr Food Syst Crisis,Part 1 I:217–232
Gritti ES,Smith B,Sykes MT(2006)Vulnerability of Mediterranean Basin ecosystems to climate change and invasion by exotic plant species.J Biogeogr 33(1):145–157
Herold M,Mayaux P,Woodcock CE,Baccini A,Schmullis C(2008)Some challenges in global land cover mapping:an assessment of agreement and accuracy in existing 1 km datasets.RS of Environ 112:2538–2556
IPCC(2007)Climate change 2007:impacts,adaptation,and vulnerability.Part A:global and sectoral aspects.Contribution of working group II to the fourth assessment report of the intergovernmental panel on climate change,Cambridge University Press:Cambridge
IPCC(2014)Climate change 2014:impacts,adaptation,and vulnerability.Part A:global and sectoral aspects.Contribution of working group II to the fifth assessment report of the intergovernmental panel on climate change,Cambridge University Press:Cambridge
Keles S,Kadiogullari AI,Baskent EZ(2012)The effects of land-use and land-cover changes on carbon storage in forest timber biomass:a case study in Torul,Turkey.J Land Use Sci 7(2):125–133
Kosmas C,Ferrara A,Briassouli H,Imeson A(1999a)Methodology for mapping environmentally sensitive areas to deserti fication.In The Medalus project Mediterranean deserti fication and land use.Manual on key indicators of deserti fication and mapping environmentally sensitive areas to deserti fication.E.U 18882.pp 31–47 ISBN 92-828-6349-2
Kosmas C,Kirkby M,Geeson N(1999b)Manual on:key indicators of deserti fication and mapping environmentally sensitive areas to deserti fication.Energy,environment and sustainable development,EUR.European Commission,Brussels,p 18882
Kosmas C,Poesen J,Briasouli H (1999c)Key indicators of deserti fication at the ESAa scale.In:Manual on key indicators of deserti fication and mapping ESAs to deserti fication.MEDALUS III Project.King’s College,London
Lanquaye CO,Mitchell SJ(2005)Portability of stand-level empirical windthrow risk models.For Ecol Manage 216:134–148
Lelieveld J,Hadjinicolaou P,Kostopoulou E,Chenoweth J,El Maayar M,Giannakopoulos C,Hannides C,Lange MA,Tanarhte M,Tyrlis E,Xoplaki E(2012)Climate change and impacts in the Eastern Mediterranean and the Middle East.Clim Change 114(3):667–687
Lillesand T,Kiefer RW,Chipman JW(2004)Remote sensing and image interpretation,5th edn.Wiley,New York
Lindner M,Maroschek M,Netherer S et al(2010)Climate change impacts,adaptive capacity,and vulnerability of European forest ecosystems.For Ecol Manage 259(4):698–709
Maracchi G,Sirotenko O,Bindi M(2005)Impacts of present and future climate variability on agriculture and forestry in the temperate regions:europe.Clim Change 70(1):117–135
McRoberts RE,Tomppo EO(2007)Remote sensing support for national forest inventories.Remote Sens Environ 110:412–419
Mineral Research and Exploration (1989)1:2,000,000 Scale Geological Map of Turkey General Directorate of Mineral Research and Exploration(MTA),Ankara
Moriondo M,Good P,Durao R,Bindi M,Giannakopoulos C,Corte-Real J(2006)Potential impact of climate change on fire risk in the Mediterranean area.Climate Res 31(1):85–95
Mugnozza G,Oswald H,Piussi P,Radoglou K(2000)Forests of the Mediterranean region:gaps in knowledge and research needs.For Ecol Manage 132(1):97–109
Musaoglu N,Tanik A,Kocabas V(2005)Identi fication of land use changes through image processing-a case study from Istanbul,Turkey.Environ Manag 35(2):220–230
Musaoglu N et al(2014)Optimizing the production of goods and services by mediterranean woodland ecosystems in the context of global changes.FFEM Project Report,07/2014
Pignatti S (2003) The mediterranean ecosystem.Bocconea 16(1):29–40
Rivas Martı´nez S(1987)Memoria y mapa de las series de vegetacio´n de Espan˜a.1:400.000.ICONA.Serie Te´cnica.MAPA.Madrid
Rivas Martı´nez S(1996)Clasi ficacion bioclima´tica de la tierra.Folia Bot Madr 16:1–32
Ruel JC,Mitchell SJ,Dornier M(2002)A GIS based approach to map wind exposure for wind throw hazard rating.Northern J Appl For 19:183–187
Sabate´S,Gracia CA,Sa´nchez A(2002)Likely effects of climate change on growth of Quercus ilex,Pinus halepensis,Pinus pinaster,Pinus sylvestris and Fagus sylvatica forests in the Mediterranean region.For Ecol Manage 162(1):23–37
S¸ahin S,Tu¨rkes¸M,Wang SH,Hannah D,Eastwood W(2015)Large scale moisture flux characteristics of the Mediterranean basin and their relationships with drier and wetter climate conditions.Clim Dyn 45(11):3381–3401
Scott RE,Mitchell SJ(2005)Empirical modelling of wind throw risk in partially harvested stands using tree,neighborhood and stand attributes.For Ecol Manage 218:193–209
Sivrikaya F,Bozali N(2012)Karbon Depolama Kapasitesinin Belirlenmesi:Tu¨rkog˘lu Planlama Birimi O¨rneg˘i,Bartın Orman Faku¨ltesi Dergisi 2012,Cilt:14.O¨zel Sayı 69–76:0943–1302(in Turkish)
Stehman SV,Czaplewski RL(1998)Design and analysis for thematic map accuracy assessment:fundamental principles.Remote Sens Environ 64:331–344
Tatli H,Tu¨rkes¸M(2014)Climatological evaluation of Haines forest fire weather index over the Mediterranean basin.Meteorol Appl 21(3):545–552
TSI(2012)Address based population registration system.http://www.turkstat.gov.tr/PreTablo.do?alt_id=1059.Accessed 02 March 2014
Turco M,Llasat MC,Hardenberg J,Provenzale A(2013)Impact of climate variability on summer firesin a Mediterranean environment(northeastern Iberian Peninsula).Clim Change 116(3):665–678
Turco M,Llasat MC,Hardenberg J,Provenzale A(2014)Climate change impacts on wild fires in a Mediterranean environment.Clim Change 125(3):369–380
Tu¨rkes¸M(1998)In fluence of geopotential heights,cyclone frequency and southern oscillation on rainfall variations in Turkey.Int J Climatol 18:649–680
Tu¨rkes¸M(2010)Climatology and meteorology.First Edition,Kriter Publisher—Publication No.63,Physical Geography Series No.1,ISBN:978-605-5863-39-6,650+XXII,I˙stanbul(in Turkish)
Tu¨rkes¸M(2015)Biogeography:a paleogeography and ecology approach.First Edition,Kriter Publisher—Physical Geography Series No:3,ISBN:978-605-5863-,457+XXXIV,Sonc¸ag˘ Yayıncılık Matbaacılık Reklam ve Sanayi Tic.Ltd.S¸ti:Ankara(in Turkish)
Tu¨rkes¸M,Erlat E(2006)In fluences of the North Atlantic Oscillation on precipitation variability and changes in Turkey.Nuovo Cimento Della Societa Italiana Di Fisica C.Geophys Space Phys 29:117–135
Tu¨rkes¸M,Musaog˘lu N(2016)Technical report of the vulnerability assessment to climate change and variability of the mediterranean forest ecosystem:pilot site of Du¨zlerc¸amı(Turkey).Final Report for the component 1 of project‘‘Maximize the production of goods and services of Mediterranean forest ecosystems in the context of global changes(GCP/GLO/458/FRA).’’Published by Food and Agriculture Organization of the United Nations(FAO)and Plan Bleu pourl Environnement et le De´veloppement en Me´diterrane´e(Plan Bleu).ISBN 978-92-5-109566-9
Walsh PD,Lawler DM(1981)Rainfall seasonality:description,spatial patterns and change through time.Weather 36:201–208
Yukon College(2011)Yukon Water availability analysis an assessment of the potential impacts of climate change on the balance between precipitation and potential evapotranspiration in the Yukon,Canada,The Northern Climate Exchange,Yukon College by the Scenarios Network for Alaska and Arctic Planning(SNAP)University of Alaska Fairbanks
Zdruili P (2014)Land resources of the mediterranean:status,pressures,trends and impacts on future regional development.Land Degrad Dev 25:373–384
杂志排行
Journal of Forestry Research的其它文章
- In vitro propagation of conifers using mature shoots
- ‘Relationships between relationships’in forest stands:intercepts and exponents analyses
- Effects of application date and rate of foliar-applied glyphosate on pine seedlings in Turkey
- Assaying the allelopathic effects of Eucalyptus camaldulensis in a nursery bed incorporated with leaf litter
- Effects of soil compaction on growth variables in Cappadocian maple(Acer cappadocicum)seedlings
- Variation and selection analysis of Pinus koraiensis clones in northeast China
