应用生物完整性指数评价我国河流的生态健康
2018-04-25陈求稳于海燕王备新金小伟王业耀许人骥南京农业大学昆虫系江苏南京1009南京水利科学研究院生态环境研究中心江苏南京100浙江省环境监测中心生态所浙江杭州1001中国环境监测总站北京10001江苏省环境监测中心江苏南京1006
陈 凯,陈求稳,于海燕,王备新,金小伟,王业耀,许人骥,蔡 琨 (1.南京农业大学昆虫系,江苏南京 1009;.南京水利科学研究院生态环境研究中心,江苏 南京 100;.浙江省环境监测中心生态所,浙江 杭州 1001;.中国环境监测总站,北京 10001;.江苏省环境监测中心,江苏 南京 1006)
河流生态健康评价是进行水环境管理和保证水环境健康的重要内容;开展我国流域水生态完整性监测和评价的方法及其体系构建,是我国流域水质目标管理技术体系的重要组成,是实施水生态功能分区管理的重要基础,也是保障水生态可持续发展的重要前提[1].生物完整性是水生态系统健康评价的重要指标,是水生态完整性的关键组份.生物完整性是指与区域环境相适应的,经长期进化形成的生物群落组成、结构和功能方面的属性[3],其实质是通过完整性指数测量河流生物学和生态学资源的现状[2];基于生物群落特征的多参数指数 MMI (通常也被称为生物完整性指数IBI),及反映样点观测物种组成(观测值O)与期望物种组成(期望值 E)差异性的 O/E指数,均是应用最广泛的评价河流生物完整性的两种指数.
我国自2003年开始底栖动物完整性指数评价溪流健康的研究,当前评价的指示生物类群已涉及鱼类、浮游生物、微生物和水生植物,评价水体也拓展到河流、湖泊、水库、湿地和河口等.但我国的MMI和O/E指数的研究和应用工作大多直接借鉴国外已有方法,对生物完整性指数构建方法与技术体系是否符合我国水生态系统特征的研究不够深入,一定程度上限制了我国应用生物完整性评价水生态健康的业务化运行.本文就MMI和O/E指数概念、国内外发展史和应用现状进行详细的综述,提出构建我国MMI和O/E指数评价体系亟待解决的问题和研究建议,旨在进一步推进我国水生态系统健康评价的研究和业务化应用.
1 MMI和O/E指数构建方法
多参数指数(MMI)方法上等同于生物完整性指数(IBI),试图通过综合生物群落组成、结构、物种性状和功能参数定量描述生物完整性[4].虽然IBI指数特指生物完整性指数,但其已有构建过程较难真实且全面的反映生物完整性(例如已有IBI对具有描述生态系统功能信息的生物性状和功能参数的应用极少),因此MMI的概念更为合适且正在被广泛应用.O/E指数基于河流无脊椎动物预测与分类系统(RIVPACS)模型,计算物种观测丰富度(O)和期望丰富度(E)的比值(即:观测值/期望值,O/E)定量物种组成完整性[5-6],其比值反映期望物种组成在调查样点的出现率,一定程度上表征样点生物组成完整性的丧失程度[7].
1.1 MMI构建方法
MMI构建依据评价目的、水生态系统类型、指标生物类群和可用数据类型等有所区别[8],但生物参数选择是构建具有高敏感性和响应性MMI的核心要求[9],如基于概念模型选择生物学意义较重要的参数(如Karr最初构建IBI指数的方法[10]),和选择判别能力(区分参照和受损健康状况)最优的参数(例如 Barbour等[11])是两种基本方法.经典MMI的构建步骤(图1)包括:
(1)确定参照、非参照和受损点位.通常通过设定土地利用和水化学的客观阈值、结合专家判断法确定参照点位和非参照点位[12].参照条件的定义包括:极小干扰条件、历史状况、较小干扰条件和现存最佳条件[12].参照点位的设定应避免使用生物参数标准,生物参数标准易造成 MMI构建的“循环效应”[12].
(2)标准化野外采样、生物分类和数据整理工作.建立标准化的水生生物采样工具[13-14]和采样强度[15],实验室内生物分类水平[15]与数据处理方法[15-17]等,以提高过程的质量保证和结果的可靠性.
(3)候选生物参数.候选生物参数类型可以分为:群落组成参数、丰富度/多样性参数、敏感值/耐污值参数、营养结构/功能性参数、生物习性参数等[8-9].廖静秋等[18]总结了鱼类、底栖动物和着生藻类MMI构建的常用生物参数.
(4)参数分布范围检验.较窄的分布范围说明参数反映的自然梯度和人类胁迫梯度的范围较窄[9],包括:所有点位或参照点位生物参数值的分布范围极小,或大部分点位的参数值都为相同数值.分布范围的检验方法多样,应依据生物参数信息确定检验分布范围的方法和阈值[9].
(5)控制自然梯度影响.底栖动物群落组成、结构和功能等在时空尺度同时受到人类干扰和自然梯度的影响[19-20],混淆自然变异和人类干扰的影响,容易增加评价结果出现I型(Type I,将健康水体误判为受损水体)和 II型(Type II,将受损水体误判为健康水体)错误的概率[21].为准确评价人类干扰的影响,应尽可能地降低自然梯度的影响.依据自然特征分区和预测模型是两种主要方法.
分区(classification或者regionalization)即利用生态区(Omernik[22-23])最小化参照和评价样点间的自然特征差异性,但用于分区的自然特征并不一定是影响水生生物群落自然差异性的主要原因[24-25],而且该方法不能定量化自然梯度的影响[24,26].重复性检验 (例如:信号/噪声比)是结合生态区方法常用的,检验生物参数时空尺度稳定性的常用指标.
预测模型方法通过构建生物参数对自然梯度的响应模型,计算模型残差,达到定量化降低甚至消除自然梯度影响的目的[27],该方法理论上不受生物类群和研究水体的限制[25,27-29].模型构建方法包括:逐步多元线性回归[27,30-32]、分类与回归树[28]、随机森林[25,33-34]、促进回归树[35]等.其中,基于分类与回归树模型的优点有:可以处理自变量和应变量之间的复杂关系,计算数据不需要符合正态分布、模型不会出现过拟合、自变量共线性不会对计算结果产生影响等[36-38],已经逐渐成为目前最广泛应用的模型方法.
(6)判别能力/响应性分析.计算生物参数区分不同胁迫程度影响的能力,检验方法包括:相关性分析[9]、散点图[39]、箱式图[40]、非参数 t检验[28]、有效判别系数[41]等.判断生物参数对人类干扰梯度响应方向是判别能力分析的必要前提步骤[11].
(7)冗余分析.指生物参数的生物信息相似,或具有高度相关性[9];生物参数高度冗余易显著降低 MMI的可靠性.剔除相关性较强(例如相关系数 r>|0.70|)的生物参数和减小MMI构成参数相关系数平均值[34,42]是避免冗余的两种主要方法[9].聚类分析[28]和主成分分析[33]是近年流行的降低生物参数相关系数平均值的方法.
(8)生物参数赋值.该步骤标准化生物参数的分布范围和一致化对胁迫的响应方向,并计算MMI最终值.生物参数赋值的方法包括不连续赋值法和连续赋值法.不连续赋值法(如 3分法[10]和4分法[43])易增加MMI的不稳定性,而且限制了其在不同类型水体的应用[44].连续赋值法不仅避免了这些缺点,而且能够避免主观确定生物参数的健康条件;使用连续赋值法时通常使用参照点位和受损点位的95%和5%分位数值作为期望最佳值或最差值,避免异常值的影响[28,44].
(9)表现力评价和评价标准建立.通过精确度、准确度/偏差、响应性和敏感性等比较评价表现力[25].通常利用参照点位 MMI值的标准差(SD)衡量精确度,SD 越小则精确度越高.准确度/偏差通过构建自然环境梯度对参照点位MMI的解释模型,残留自然变异的解释量超过 10%[25]则认为偏差较大,准确度较低.响应性测量参照点位和严重受损点位 MMI值的差异性,差异性越大,说明响应性越高.

图1 构建多参数完整性指数(MMI)经典步骤的流程Fig.1 Schematic overview of the required steps to develop a Multimetric Index (MMI)
敏感性是处于非参照等级(non-reference condition, NRC)的监测点位百分比.敏感性和评价标准紧密相关,用于计算评价标准的方法包括生态学方法、统计学方法、专家判断法[45]等.生态学方法通过计算评价指数和人类胁迫的关系确定;统计学方法通过等间距方法确定健康等级;专家判断法主观性最强,通过专家经验赋值健康等级.健康标准阈值计算方法包括:通过计算生物参数和人类胁迫梯度关系的TITAN[46-47]模型法,以参照点位值的5%、10%、或25%分位数作为评价标准[25,28,43],通过参照点位 SD 确定标准[48-49],通过单尾非中心对称的不等和等价测验计算标准[33-34,50];对小于该阈值的MMI分布范围进行3或4等分,确定健康等级(例如:亚健康、一般、差、较差).
近年来 MMI构建步骤不断简化,较大判别能力和较低冗余性是选择MMI核心构成参数的重点步骤,因此将两者相结合是主要步骤,例如:Vander Laan和Hawkins[33]将t检验和PCA相结合筛选生物参数,Chen等[17]利用t检验和聚类分析相结合选择生物参数.但本文认为,分布范围检验是所有步骤的基础,较窄的分布范围说明参照点位覆盖的自然梯度范围可能较窄,而且较多0值或相同值易影响预测模型构建,从而影响最终评价结果.
1.2 O/E构建方法
O/E指数构建的参照点位确定、标准化野外采样、生物分类和数据整理等方法同MMI指数.主要步骤包括[49](图2):
(1)参照点位聚类.剔除稀有物种[51]后,根据物种组成对参照点位进行聚类分析.聚类方法包括:TWINSPAN 法[5,52-53]、Ward融合法[54]、K-means法[55]、和现阶段常用的UPGMA flexible β方法[51,56-58].
(2)点位权重计算.使用人类活动难以改变的自然因子(例如:经度、维度、海拔、河流等级等),建立参照点位聚类类群与自然因子的判别模型,计算各点位属于参照点位聚类类群的权重.多元判别模型(MDA)是经典的模型方法[25,52-53,59],逻辑斯蒂回归[60]、人工神经网络(ANN)[61]、贝叶斯网络[62]等也是较常用的模型,RF模型是近年来最流行的方法[25,33,63].
(3)物种权重计算.计算区域物种库中每个物种属于每个参照点位类群的权重.
(4)物种出现概率(Pc).将第 2和 3步的点位权重与物种权重进行加权,计算物种出现概率Pc.Pc值越大,说明物种出现的概率越高,为常见物种;Pc值越小,说明物种可能出现的概率越小,为稀有物种.通常使用 Pc≥0.5和 Pc>0两种阈值用于 O/E 计算,Pc≥0.5(常见物种)较 Pc>0的 O/E 表现力更高[64-65].
(5)观测值/期望值(O/E)比值.将大于设定 Pc阈值的所有出现物种的Pc值相加得到该点位的期望丰富度值(E),同时计算大于设定 Pc阈值的物种观测丰富度值(O).最终O/E值在理论上介于0~1之间,但也有可能略大于1.

图2 构建和应用基于RIVPACS模型的O/E指数经典步骤的流程Fig.2 Schematic representation of the general steps followed in the RIVPACS approach for O/E construction and application
(6)评价表现力和模型误差.O/E表现力的评价参数同 MMI评价表现力.但对 O/E,还可以计算重复样本标准差(RSSD)[57]占零模型标准差[57]的范围百分比(PctRange)[57-58];零模型标准差代表理论上O/E的最低精确度,RSSD代表O/E指数的变异仅来源于重复采样过程中的系统误差,是理论上O/E最高精确度,PctRange值越大说明O/E值的精确性越高.
(7)评价标准.O/E≈1代表评价点位的物种组成完整性较高,O/E<<1表示物种组成完整性受到了破坏.评价标准构建方法同 MMI评价标准建立方法.
2 MMI和O/E指数的共同点和优缺点
MMI和O/E指数都测量生物完整性,理论基础都是参照健康方法理论(RCA)[66-67],在标准化野外采样、实验室处理和数据分析等工作的基础上,联系生物特征与环境特征,最后通过数值方法直观表述健康得分,用于评估水体健康现状和退化程度.
MMI和O/E的主要区别在对生物完整性的定义、对生物群落受损状况表征和对参照点位分类3个方面[68].MMI定义的生物完整性包括个体、种群、群落和生态系统特征等,不同生物特征对不同胁迫类型的响应具有差异性,因此MMI理论上对更多的胁迫类型存在响应;O/E指数根据物种组成相似性,通过表征物种缺失代表生物完整性的退化程度.与O/E相比,MMI对生物完整性的定义更全面;但在理论和实际操作中,O/E比MMI更容易理解.O/E对物种组成变化更加敏感,评价结果不仅能够体现物种丰富度变化,而且能够表明物种的替代;而MMI不能够反映物种组成的变化,具有相同生态功能的物种替代可能不会影响 MMI.经典MMI对所有点位进行预先分区,然后对处于同一生态区的点位进行MMI的构建和应用;O/E则是通过后分区的方法,按照物种组成信息将具有相似物种组成的参照点位聚类在一起.
MMI构建需要参照点位和严重受损点位的数据,但O/E的构建仅依据参照点位数据[25].O/E在构建过程中定量检验评价点位与参照点位空间关系,但MMI并不会定量检验它们的关系[7,48].已有研究表明,MMI对中低程度的干扰较敏感,对中等到较严重干扰的响应敏感性明显降低,但O/E对不同受损程度都拥有较好的敏感性和响应关系[25,33,69].
与MMI相比,O/E指数[68]:(1)不需要将所有点位进行预先分组,(2)对参照点位是否来自于同一个研究区域不敏感,(3)利用相对独立的数据进行 O/E指数的计算,减少了未知误差的影响,(4)加权点位可能性和物种可能性,保证结果的可靠性.但O/E指数构建需要大量数据收集,且模型方法较复杂,不利于O/E的推广和应用.
3 MMI和O/E指数发展简史和国内外应用现状
3.1 MMI发展简史和国内外应用现状
Karr[10]最早基于鱼类群落建立半定量半定性的生物完整性指数,评价人类干扰对黑溪及其对应流域的影响(图3).该评价方法得到许多研究者的认可,在不断完善其构建和评价方法的基础上,应用在北美其他流域[70-71];并逐渐传播到欧洲大陆,在相对更大的空间尺度上进行应用[30,72],同时候选生物参数增加了反映生态系统功能的参数[30].在此基础上成功地应用定量程度更高的MMI评价溪流[73-74]、湖泊[75-76]、湿地[77]和河口[78-79]等水体生态健康,评价指标生物也由鱼类拓展到底栖动物[80]、藻类[28,81]、浮游动物[82]、水生植物[83]及综合生物类群[84-85].最初的 MMI用于较小空间尺度下的河流生态健康评价[10],在标准化和统一构建方法的基础上[9],MMI被逐渐应用在区域尺度[39,86]、国家尺度[87]、以及不同大洲[88-89]的水体.但由于研究区域自然梯度和干扰类型的差异性,导致 MMI在较大空间尺度上无法进行有效比较[7],因此预测模型 MMI[27]于 21世纪初开始出现,通过定量自然变量对生物群落的影响,提高 MMI在时空尺度的可比性和稳定性[34](图3).
我国的生物监测工作始于20世纪70年代环境污染调查[1],但对 MMI研究的起步较晚,王备新等[43,90]以天目山—大别山阔叶林生态区的溪流为研究对象,于2003年首次尝试构建底栖动物MMI指标体系.自此以来,以鱼类[91-92]、底栖动物[93-94]和硅藻[95]为指标生物的MMI指数被广泛应用于我国溪流[96]、河流[92,97]、湖泊[98]等水体的生态健康评价.我国主要利用 MMI确定流域水生生物健康现状(例如Huang等[99])、构建区域尺度下特定流域的生物完整性评价体系与评价标准(例如张远等[96])、分析与MMI指数显著相关的环境梯度(例如Li等[100])等.我国仅在近年开始预测模型MMI的研究,Chen等[34]利用不同季节和年份的漓江流域河流底栖动物数据,陈凯等[101]利用浙江中北部东苕溪、西苕溪、钱塘江流域和临安市河流共 4个子流域的底栖动物和环境数据,比较了预测模型和常规 MMI的评价表现力;与国外已有研究结果类似,研究结果都发现预测模型和常规MMI的核心组成参数存在差异,预测模型 MMI的精确度和准确度高于,但敏感性和响应性低于常规MMI.
3.2 O/E发展简史和国内外应用现状
英国首先提出基于底栖动物的RIVPACS模型构建O/E进行河流生态健康评价的概念[5-6](图3).90年代初RIVPACS II和RIVPACS III模型在标准化采样方法、增加参照点位数量、评估不同分类等级结果、综合多时间尺度数据、结合定性和定量数据构建模型、研究点位聚类和预测新方法、评估模型输出不确定性等方面得到了显著的提高[102].随着时间推移,RIVPACS模型方法和技术在美国得到了前所未有的推进[103],例如:RIVPACS零模型构建[57]和优化判别预测模型选择[104],通过监测物种组成完整性评价水生态健康也逐渐成为 RIVPACS的核心目标之一[105].在此基础上, Reynoldson等[106]发展适合加拿大的BEAST模型,Smith等[107]构建适合澳大利亚的AUSRIVAS模型.O/E指数评价的目标生态系统也扩展到湖泊和湿地[106,108];指标生物也从底栖动物扩展到鱼类[109]、底栖硅藻[110]、大型植物[111],综合生物类群[84,112],甚至是栖息地组成[113]等.
在我国,应用RIVPACS模型的O/E指数评价河流生态健康的研究最初仅有综述性文章介绍其基本概念,并分析优缺点等[114-119].随后,张杰等[120]尝试构建底栖动物O/E指数评价漓江生态系统健康,用于预测模型试验研究;陈凯[69]应用多季节和多年分的底栖动物数据构建浙江省多个河流流域的 O/E指数,并比较其评价表现力;Chen等[17]研究了底栖动物采样强度对O/E指数评价表现力的影响;陈凯等[121]利用已有的季风气候区RIVPACS模型评价了淮河流域典型水体的底栖动物组成完整性.
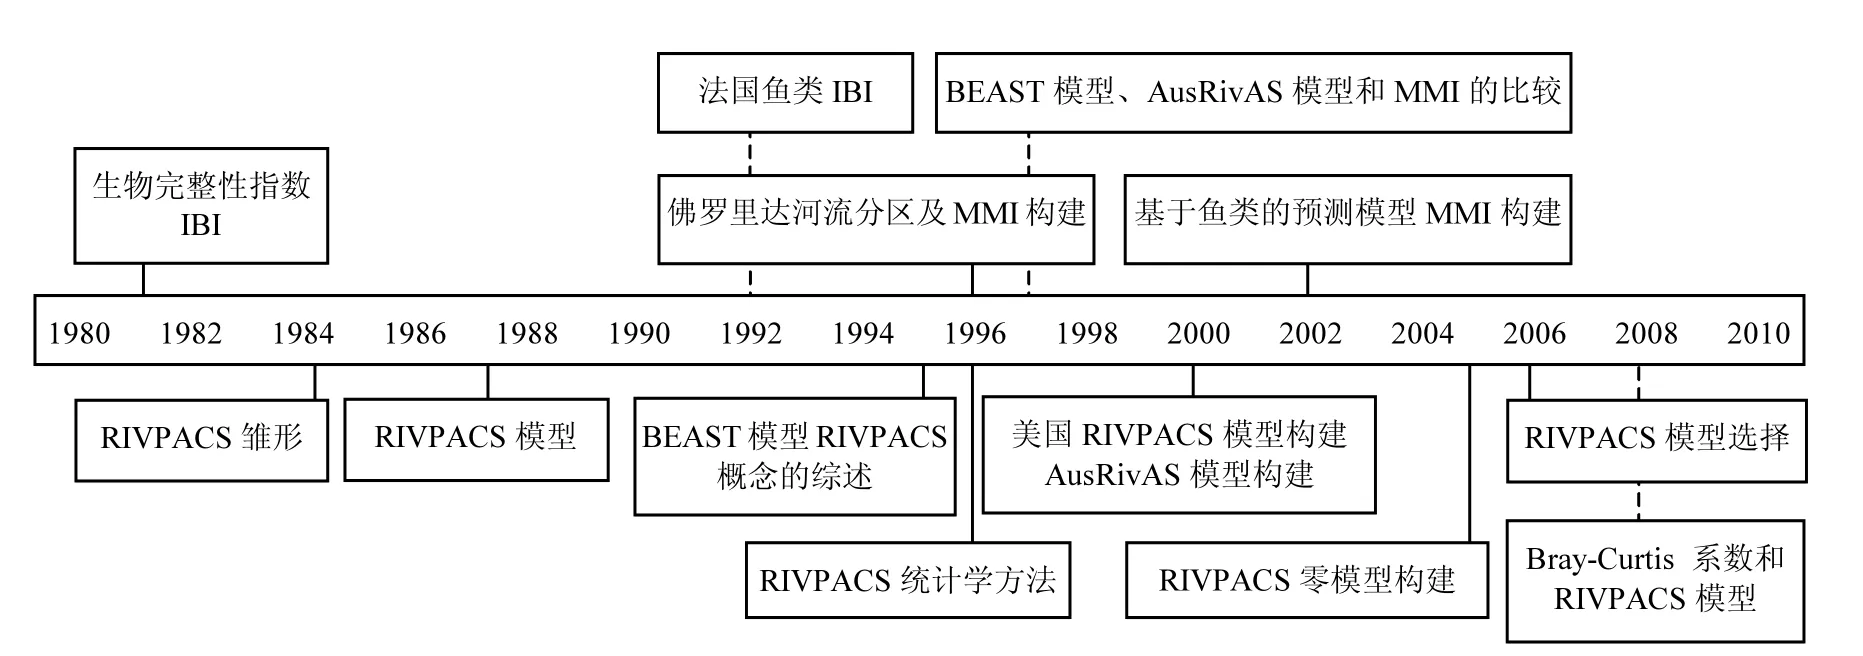
图3 MMI和O/E指数发展简史(改自Hawkins等2010[66])Fig.3 Brief history of the development, application, and interpretation of MMI and O/E indices[66]
4 国内开展MMI和O/E指数研究与应用研究建议
MMI和O/E指数的理论基础和技术方法日渐成熟,体现出广泛的应用可行性.然而,目前我国MMI和O/E指数的应用大多直接借鉴国外已有方法,缺乏适合我国水生态系统特征的生物完整性指数基础方法和技术体系的深入研究.因此,结合我国不同区域的水环境污染和干扰类型的新特点[122]、水生生物区系组成和分布等研究,提出适用于我国多种水生态系统特征的生物评价方法和技术体系,对我国水体健康现状评价、水生态系统退化原因诊断、水生态健康变化趋势预测预警、全国尺度生物评价技术及规范应用、推广和比较等有重要的积极作用.本文认为当前我国MMI和O/E指数研究工作应着重在:(1)生物和环境基础数据收集和数据库构建;(2)构建规范化方法和技术体系的适用性研究;(3)评价基准和标准.
4.1 生物与环境基础数据收集和数据库构建
我国地域辽阔,存在地形、地貌、气候、温度、水文条件等自然环境梯度从南至北和从东至西差异大、水生生物多样性丰富的特点,但不同水生生物的区域尺度和全国尺度多样性及其分布格局依然不清.因此,基础数据收集和数据库构建对我国MMI和O/E指数研究和推广应用显得尤为重要.如参照样点的数量及其空间分布是否覆盖所有水生态功能区类型,是否包含了生物群落随时间(年份、季节、月份)的变化特点,均会对MMI和 O/E指数的准确性和精确性产生影响.基础数据收集和数据库构建工作包括:(1)历史资料的收集与整理.主要是对流域内或区域内曾开展生物监测工作样点及其已有生物监测数据的收集和整理;(2)区域物种数据厘订.根据最新发表的物种鉴定与分布的数据资料,结合形态学和分子生物学手段,如分子条形码技术,完善和明确区域物种名录;(3)补充调查.结合自然环境特征,重点开展符合参照条件样点的环境和生物数据的补充调查工作;(4)建立具有检索和常用生物指数运算功能的样点与物种数据库.
4.2 构建规范化方法和技术体系的适用性研究
规范化MMI和O/E指数构建方法和技术体系,并研究和提高其对不同水生态类型的适用性,有助于不同地区类似水生态系统健康评价体系的推广应用,提高评价结果可比性,统一评价基准的构建和评价标准等级的实施.我国不同地区生物完整性指数监测技术方法发展不平衡,目前没有适合我国不同水体类型特点的且通用的生物完整性指数监测技术规范,缺乏样品野外采集和实验室处理、指示生物类群选择、指数构建方法和流程选择、空间尺度选择等构建方法和技术等方面的规范化的适用性标准.
(1)野外采集和实验室样品处理方法与规范.保证生物数据的有效性与准确性是提高生物完整性指数及其评价基准的基础条件.结合我国水生态分区的河流及对应流域的自然特征,建立适合不同水环境特征的水生生物样品野外采集(如采样工具选择、目标生境选择、固定采样面积、样本重复数量),和实验室样品处理(如抽样个体数、水生生物分类等级、混合分类单元(OTU)使用和一致化分类等级)的方法和技术规范.
(2)指示生物类群选择.确定不同水生态分区和典型流域的水环境污染现状特征、典型水环境问题及其作用空间尺度,明确指示污染类型的单一或综合生物类群,提高水生态现状评价结果的全面性和可信度.结合水环境数据收集结果,综合水生生物群落组成、结构和生物性状及其功能多样性参数的响应特征,探索生物类群权重赋值,明确评价指标构建的方法体系.
(3)候选生物参数数据库.依据收集的基础数据,建立我国水生态系统完整性评价的指导性常用候选生物参数数据库;增加能够反映生态系统功能的水生生物性状组成和功能多样性参数列表;为全面构建生物完整性提供基础参数平台.
(4)指数构建方法、流程选择和空间尺度选择方法和技术体系.对拥有复杂地质学、地理地形学、河流形态学、景观学等自然特征的不同河流类型,构建利用我国数据验证的、适合不同流域和水功能分区的生物完整性指数构建方法和技术体系,包括:合理的评价指数构建过程、自然特征差异性消除方法、评价模型和预测模型的构建和适用性检验、合适的生物完整性评价空间尺度选择、不同流域评价结果阐述内容的一致性和水生态系统健康的变化趋势等.
4.3 评价基准和标准
评价基准与标准是有效实施水生生物完整性目标的主要基础和管理依据.生物评价基准是指未受人类干扰和污染的自然状态下水生生物完整性状况,是基于科学调查、实验和科学推论的客观结果;生物评价标准是以评价基准为理论依据,综合考虑自然条件和人类干扰等因素制定的,生物对不同类型和不同程度人类干扰响应敏感性的直观评价.评价基准是制定评价标准的理论基础,决定着评价标准的科学性、准确性和可靠性,而评价标准是水环境管理的基础和目标,也是判断生物群落退化程度、评估生物群落受影响程度和确定技术方法进行管理等的依据[123],是健康评价最重要的步骤之一[45].生物评价基准确定和评价标准等级构建的科学性和系统性内容包括:(1)参照体系.参照点位质量是评价基准建立的根本,根据我国水生态分区的水体及其流域特征,确定合适的参照点位的定义,设定参照点位选择的土地利用和物理化学指标及其阈值标准,明确基于特定参照点位类群的评价标准可应用的空间尺度范围;(2)评价标准计算方法.根据我国不同水生态分区的生物完整性指数分布特点,科学选择评价标准计算方法,制定适合评价不同空间尺度水体的健康评价标准等级;(3)生物基准和标准与污染物总量控制.生物完整性基准和标准成为关系到容量总量控制能否全面实施的关键要素之一,明确污染的生态效应,基于污染物总量控制制定相应的合理生物完整性指数标准,为污染物总量控制提供数据积累和理论支持.
参考文献:
[1]金小伟,王业耀,王备新,等.我国流域水生态完整性评价方法构建 [J]. 中国环境监测, 2017,33(1):75-81.
[2]Hawkins C P, Olson J R, Hill R A. The reference condition:predicting benchmarks for ecological and water-quality assessments [J]. Journal of the North American Benthological Society, 2010,1(29):312-343.
[3]Karr J R. Biological integrity: a long-neglected aspect of water resource management [J]. Ecological Applications, 1991,1(1):66-84.
[4]Karr J R, Chu E W. Introduction: Sustaining living rivers [J].Hydrobiologia, 2000,422/423:1-14.
[5]Wright J, Moss D, Armitage P, et al. A preliminary classification of running-water sites in Great Britain based on macroinvertebrate species and the prediction of community type using environmental data [J]. Freshwater Biology, 1984,3(14):221-256.
[6]Furse M T, Moss D, Wright J F, et al. The influence of seasonal and taxonomic factors on the ordination and classification of running-water sites in Great Britain and on the prediction of their macro-invertebrate communities [J]. Freshwater Biology, 1984,14(3):257-280.
[7]Hawkins C P. Quantifying biological integrity by taxonomic completeness: its utility in regional and global assessments [J].Ecological Applications, 2006,4(16):1277-1294.
[8]Hering D, Feld C, Moog O, et al. Cook book for the development of a multimetric Index for biological condition of aquatic ecosystems: experiences from the European AQEM and STAR projects and related initiatives [J]. Hydrobiologia, 2006,566:311-324.
[9]Stoddard J L, Herlihy A T, Peck D V, et al. A process for creating multimetric indices for large-scale aquatic surveys [J]. Journal of the North American Benthological Society, 2008,4(27):878-891.
[10]Karr J R. Assessment of biotic integrity using fish communities[J]. Fisheries, 1981,6(6):21-27.
[11]Barbour M T, Gerritsen J, Snyder B D, et al. Rapid bioassessment protocols for use in streams and wadeable rivers: periphyton,benthic macroinvertebrates and fish [M]. Washington:Environmental Protection Agency, 1999.
[12]Stoddard J L, Larsen D P, Hawkins C P, et al. Setting expectations for the ecological condition of streams: the concept of reference condition [J]. Ecological Applications, 2006,4(16):1267-1276.
[13]王备新,杨莲芳.溪流底栖动物定量与半定量采样法比较研究[J]. 应用与环境生物学报, 2006,12(5):719-721.
[14]赵 静,章守宇,林 军,等.不同采样设计评估鱼类群落效果比较 [J]. 应用生态学报, 2014,25(4):1181-1187.
[15]Cao Y, Hawkins C P. The comparability of bioassessments: a review of conceptual and methodological issues 1 [J]. Journal of the North American Benthological Society, 2011,30(3):680-701.
[16]Ostermiller J D, Hawkins C P. Effects of sampling error on bioassessments of stream ecosystems: application to RIVPACS-type models [J]. Journal of the North American Benthological Society, 2004,2(23):363-382.
[17]Chen K, Hughes R M, Wang B. Effects of fixed-count size on macroinvertebrate richness, site separation, and bioassessment of Chinese monsoonal streams [J]. Ecological Indicators, 2015,53:162-170.
[18]廖静秋,黄 艺.应用生物完整性指数评价水生态系统健康的研究进展 [J]. 应用生态学报, 2013,24(1):295-302.
[19]Vannote R L, Minshall G W, Cummins K W, et al. The river continuum concept [J]. Canadian Journal of Fisheries and Aquatic Sciences, 1980,1(37):130-137.
[20]Marchant R, Hirst A, Norris R, et al. Classification of macroinvertebrate communities across drainage basins in Victoria,Australia: consequences of sampling on a broad spatial scale for predictive modelling [J]. Freshwater Biology, 1999,41(2):253-268.
[21]Vander Laan J J. Environmental assessment of streams: linking land use, instream stressors, and biological indices to infer likely causes of ecological impairment [D]. Logan:Utah State University, 2012.
[22]Omernik J M. Ecoregions of the conterminous United States [J].Annals of the Association of American geographers, 1987,77(1):118-125.
[23]Omernik J M. Ecoregions: a framework for managing ecosystems[J]. Journal of the American Water Resources Association, 1995,33(5):925-949.
[24]Hawkins C P, Vinson M R. Weak correspondence between landscape classifications and stream invertebrate assemblages:implications for bioassessment [J]. Journal of the North American Benthological Society, 2000,19(3):501-517.
[25]Hawkins C P, Cao Y, Roper B. Method of predicting reference condition biota affects the performance and interpretation of ecological indices [J]. Freshwater Biology, 2010,5(55):1066-1085.
[26]Hawkins C P, Norris R H. Performance of different landscape classifications for aquatic bioassessments: introduction to the series [J]. Journal of the North American Benthological Society,2000,19(3):367-369.
[27]Oberdorff T, Pont D, Hugueny B, et al. Development and validation of a fish-based index for the assessment of ‘river health’ in France [J]. Freshwater Biology, 2002,47(9):1720-1734.
[28]Cao Y, Hawkins C P, Olson J, et al. Modeling natural environmental gradients improves the accuracy and precision of diatom-based indicators [J]. Journal of the North American Benthological Society, 2007,26(3):566-585.
[29]Jones R C. Modeling to improve vegetation-based wetland biological assessment [D]. Logan:Utah State University, 2014.
[30]Pont D, Hugueny B, Beier U, et al. Assessing river biotic condition at a continental scale: a European approach using functional metrics and fish assemblages [J]. Journal of Applied Ecology, 2006,43(1):70-80.
[31]Moya N, Tomanova S, Oberdorff T. Initial development of a multi-metric index based on aquatic macroinvertebrates to assess streams condition in the Upper Isiboro-Sécure Basin, Bolivian Amazon [J]. Hydrobiologia, 2007,589(1):107-116.
[32]Moya N, Hughes R M, Domínguez E, et al. Macroinvertebratebased multimetric predictive models for evaluating the human impact on biotic condition of Bolivian streams [J]. Ecological Indicators, 2011,11(3):840-847.
[33]Vander Laan J J, Hawkins C P. Enhancing the performance and interpretation of freshwater biological indices: An application in arid zone streams [J]. Ecological Indicators, 2014,36:470-482.
[34]Chen K, Hughes R M, Xu S, et al. Evaluating performance of macroinvertebrate-based adjusted and unadjusted multi-metric indices (MMI) using multi-season and multi-year samples [J].Ecological Indicators, 2014,36:142-151.
[35]Esselman P C, Infante D M, Wang L, et al. Regional fish community indicators of landscape disturbance to catchments of the conterminous United States [J]. Ecological indicators, 2013,26:163-173.
[36]Cutler D R, Edwards Jr T C, Beard K H, et al. Random forests for classification in ecology [J]. Ecology, 2007,11(88):2783-2792.
[37]Breiman L. Random forests [J]. Machine Learning, 2001,1(45):5-32.
[38]Elith J, Leathwick J R, Hastie T. A working guide to boosted regression trees [J]. Journal of Animal Ecology, 2008,77(4):802-813.
[39]Mccormick F H, Hughes R M, Kaufmann P R, et al. Development of an index of biotic integrity for the Mid-Atlantic Highlands region [J]. Transactions of the American Fisheries Society, 2001,130(5):857-877.
[40]Barbour M T, Gerritsen J, Griffith G E, et al. A framework for biological criteria for Florida streams using benthic macroinvertebrates [J]. Journal of the North American Benthological Society, 1996,2(15):185-211.
[41]Stribling J B, Jessup B K, White J S, et al. Development of a benthic index of biotic integrity for Maryland streams [M].Annapolis: Maryland Department of Natural Resources, 1998.
[42]Van Sickle J. Correlated metrics yield multimetric indices with inferior performance [J]. Transactions of the American Fisheries Society, 2010,139(6):1802-1817.
[43]王备新.大型底栖无脊椎动物水质生物评价研究 [D]. 南京:南京农业大学, 2003.
[44]Blocksom K A. A performance comparison of metric scoring methods for a multimetric index for Mid-Atlantic Highlands streams [J]. Environmental Management, 2003,31(5):670-682.
[45]Birk S, Bonne W, Borja A, et al. Three hundred ways to assess Europe's surface waters: an almost complete overview of biological methods to implement the Water Framework Directive[J]. Ecological Indicators, 2012,18:31-41.
[46]King R S, Baker M E. Considerations for analyzing ecological community thresholds in response to anthropogenic environmental gradients [J]. Journal of the North American Benthological Society, 2010,29(3):998-1008.
[47]Mykrä H, Saarinen T, Tolkkinen M, et al. Spatial and temporal variability of diatom and macroinvertebrate communities: How representative are ecological classifications within a river system?[J]. Ecological Indicators, 2012,18:208-217.
[48]Clarke R T, Furse M T, Wright J F, et al. Derivation of a biological quality index for river sites: Comparison of the observed with the expected fauna [J]. Journal of Applied Statistics, 1996,2-3(23):311-332.
[49]Hawkins C P, Carlisle D M. Use of predictive models for assessing the biological integrity of wetlands and other aquatic habitats [M]. New York: John Wiley and Son, 2001:59-83.
[50]Bowman M F, Somers K M. Evaluating a novel Test Site Analysis (TSA) bioassessment approach [J]. Journal of the North American Benthological Society, 2006,25(3):712-727.
[51]Cao Y, Larsen D P, Thorne R S. Rare species in multivariate analysis for bioassessment: some considerations [J]. Journal of the North American Benthological Society, 2001,20(1):144-153.
[52]Moss D, Furse M T, Wright J F, et al. The prediction of the macro-invertebrate fauna of unpolluted running-water sites in Great Britain using environmental data [J]. Freshwater Biology,1987,1(17):41-52.
[53]Clarke R T, Wright J F, Furse M T. RIVPACS models for predicting the expected macroinvertebrate fauna and assessing the ecological quality of rivers [J]. Ecological Modelling, 2003,3(160):219-233.
[54]Ward Jr J H. Hierarchical grouping to optimize an objective function [J]. Journal of the American statistical association,1963,58(301):236-244.
[55]Moss D. An initial classification of 10-km squares in Great Britain from a land characteristic data bank [J]. Applied Geography, 1985,5(2):131-150.
[56]Mendes T, Calapez A R, Elias C L, et al. Comparing alternatives for combining invertebrate and diatom assessment in stream quality classification [J]. Marine and Freshwater Research, 2014,65(7):612-623.
[57]Van Sickle J, Hawkins C P, Larsen D P, et al. A null model for the expected macroinvertebrate assemblage in streams [J]. Journal of the North American Benthological Society, 2005,1(24):178-191.
[58]Hill R A, Hawkins C P. Using modelled stream temperatures to predict macro-spatial patterns of stream invertebrate biodiversity[J]. Freshwater Biology, 2014,59(12):2632-2644.
[59]Moss D. Evolution of statistical methods in RIVPACS [M].Ambleside: Freshwater Biological Association, 2000:25–38.
[60]Linke S, Bailey R C, Schwindt J. Temporal variability of stream bioassessments using benthic macroinvertebrates [J]. Freshwater Biology, 1999,42(3):575-584.
[61]Joy M K, Death R G. Predictive modelling and spatial mapping of freshwater fish and decapod assemblages using GIS and neural networks [J]. Freshwater Biology, 2004,49(8):1036-1052.
[62]Adriaenssens V, Goethals P, Charles J, et al. Application of Bayesian Belief Networks for the prediction of macroinvertebrate taxa in rivers [J]. Annales de Limnologie e International Journal of Limnology, 2004,40(3):181-191.
[63]Waite I R, Kennen J G, May J T, et al. Comparison of Stream Invertebrate Response Models for Bioassessment Metrics1 [J].Journal of the American Water Resources Association, 2012,48(3):570-583.
[64]Clarke R T, Murphy J F. Effects of locally rare taxa on the precision and sensitivity of RIVPACS bioassessment of freshwaters [J]. Freshwater Biology, 2006,51(10):1924-1940.
[65]Van Sickle J, Larsen D P, Hawkins C P. Exclusion of rare taxa affects performance of the O/E index in bioassessments [J].Journal of the North American Benthological Society, 2007,2(26):319-331.
[66]Hawkins C P, Olson J R, Hill R A. The reference condition:predicting benchmarks for ecological and water-quality assessments [J]. Journal of the North American Benthological Society, 2010,1(29):312-343.
[67]Reynoldson T B, Norris R H, Resh V H, et al. The reference condition: a comparison of multimetric and multivariate approaches to assess water-quality impairment using benthic macroinvertebrates [J]. Journal of the North American Benthological Society, 1997,16(4):833-852.
[68]Norris R H, Hawkins C P. Monitoring river health [J].Hydrobiologia, 2000,435(1-3):5-17.
[69]陈 凯.提高底栖动物多参数(MMI)和多变量(O/E)指数评价溪流水质能力的研究 [D]. 南京:南京农业大学, 2014.
[70]Miller D L, Hughes R M, Karr J R, et al. Regional applications of an index of biotic integrity for use in water resource management[J]. Fisheries, 1988,13(5):12-20.
[71]Steedman R J. Modification and assessment of an index of biotic integrity to quantify stream quality in southern Ontario [J].Canadian Journal of Fisheries and Aquatic Sciences, 1988,45(3):492-501.
[72]Schmutz S, Cowx I G, Haidvogl G, et al. Fish-based methods for assessing European running waters: a synthesis [J]. Fisheries Management and Ecology, 2007,14(6):369-380.
[73]Stoddard J L, Peck D V, Olsen A R, et al. Environmental Monitoring and Assessment Program (EMAP): western streams and rivers statistical summary [M]. Washington: Environmental Protection Agency, 2005.
[74]Rehn A C, Ode P R, Hawkins C P. Comparisons of targeted-riffle and reach-wide benthic macroinvertebrate samples: implications for data sharing in stream-condition assessments [J]. Journal of the North American Benthological Society, 2007,26(2):332-348.
[75]Beck M W, Hatch L K. A review of research on the development of lake indices of biotic integrity [J]. Environmental Reviews,2009,17:21-44.
[76]Drake M T, Valley R D. Validation and application of a fish-based index of biotic integrity for small central Minnesota lakes [J]. North American Journal of Fisheries Management,2005,25(3):1095-1111.
[77]Lunde K B, Resh V H. Development and validation of a macroinvertebrate index of biotic integrity (IBI) for assessing urban impacts to Northern California freshwater wetlands [J].Environmental Monitoring and Assessment, 2012,184(6):3653-3674.
[78]Weisberg S B, Ranasinghe J A, Dauer D M, et al. An estuarine benthic index of biotic integrity (B-IBI) for Chesapeake Bay [J].Estuaries, 1997,20(1):149-158.
[79]Williams M R, Filoso S, Longstaff B J, et al. Long-term trends of water quality and biotic metrics in Chesapeake Bay: 1986 to 2008[J]. Estuaries and Coasts, 2010,33(6):1279-1299.
[80]Klemm D J, Blocksom K A, Fulk F A, et al. Development and evaluation of a macroinvertebrate biotic integrity index (MBII)for regionally assessing Mid-Atlantic Highlands streams [J].Environmental Management, 2003,31(5):656-669.
[81]Wang Y, Stevenson R J, Metzmeier L. Development and evaluation of a diatom-based Index of Biotic Integrity for the Interior Plateau Ecoregion, USA [J]. Journal of the North American Benthological Society, 2005,24(4):990-1008.
[82]Kane D D, Gordon S I, Munawar M, et al. The Planktonic Index of Biotic Integrity (P-IBI): an approach for assessing lake ecosystem health [J]. Ecological Indicators, 2009,9(6):1234-1247.
[83]Feio M J, Aguiar F C, Almeida S, et al. AQUAFLORA: A predictive model based on diatoms and macrophytes for streams water quality assessment [J]. Ecological Indicators, 2012,18:586-598.
[84]Clapcott J E, Goodwin E O, Young R G, et al. A multimetric approach for predicting the ecological integrity of New Zealand streams [J]. Knowledge and Management of Aquatic Ecosystems,2014,415:3.
[85]Chen K, Hughes R M, Brito J G, et al. A multi-assemblage,multi-metric biological condition index for eastern Amazonia streams [J]. Ecological Indicators, 2017,78:48-61.
[86]Bramblett R G, Johnson T R, Zale A V, et al. Development and evaluation of a fish assemblage index of biotic integrity for northwestern Great Plains streams [J]. Transactions of the American Fisheries Society, 2005,134(3):624-640.
[87]Paulsen S, Stoddard J, Holdsworth S, et al. Wadeable streams assessment: a collaborative survey of the Nation's streams [M].Washington: Environmental Protection Agency, 2006.
[88]Harris J H, Silveira R. Large-scale assessments of river health using an Index of Biotic Integrity with low-diversity fish communities [J]. Freshwater Biology, 1999,41(2):235-252.
[89]Hering D, Moog O, Sandin L, et al. Overview and application of the AQEM assessment system [J]. Hydrobiologia, 2004,516(1-3):1-20.
[90]王备新,杨莲芳,胡本进,等.应用底栖动物完整性指数 B-IBI评价溪流健康 [J]. 生态学报, 2005,25(6):1481-1490.
[91]郑海涛.怒江中上游鱼类生物完整性评价 [D]. 武汉:华中农业大学, 2006.
[92]裴雪姣,牛翠娟,高 欣,等.应用鱼类完整性评价体系评价辽河流域健康 [J]. 生态学报, 2010,30(21):5736-5746.
[93]曹艳霞,张 杰,蔡德所,等.应用底栖无脊椎动物完整性指数评价漓江水系健康状况 [J]. 水资源保护, 2010,26(2):13-17.
[94]张方方,张 萌,刘足根,等.基于底栖生物完整性指数的赣江流域河流健康评价 [J]. 水生生物学报, 2011,35(6):963-971.
[95]Wu N, Cai Q, Fohrer N. Development and evaluation of a diatom-based index of biotic integrity (D-IBI) for rivers impacted by run-of-river dams [J]. Ecological Indicators, 2012,18:108-117.
[96]张 远,徐成斌,马溪平,等.辽河流域河流底栖动物完整性评价指标与标准 [J]. 环境科学学报, 2007,27(6):919-927.
[97]渠晓东.香溪河大型底栖动物时空动态、生物完整性及小水电站的影响研究 [D]. 武汉:中国科学院水生生物研究所, 2006.
[98]蔡 琨,张 杰,徐兆安,等.应用底栖动物完整性指数评价太湖生态健康 [J]. 湖泊科学, 2014,26(1):74-82.
[99]Huang Q, Gao J, Cai Y, et al. Development and application of benthic macroinvertebrate-based multimetric indices for the assessment of streams and rivers in the Taihu Basin, China [J].Ecological Indicators, 2015,48:649-659.
[100]Li F, Cai Q, Ye L. Developing a Benthic Index of Biological Integrity and some relationships to environmental factors in the subtropical Xiangxi River, China [J]. International Review of Hydrobiology, 2010,95(2):171-189.
[101]陈 凯,于海燕,张汲伟,等.基于底栖动物预测模型构建生物完整性指数(MMI)评价河流健康 [J]. 应用生态学报, 2017,6(28):1993-2002.
[102]Feio M J, Poquet J M. Predictive models for freshwater biological assessment: statistical approaches, biological elements and the Iberian Peninsula experience: a review [J]. International Review of Hydrobiology, 2011,96(4):321-346.
[103]Hawkins C P, Norris R H, Hogue J N, et al. Development and evaluation of predictive models for measuring the biological integrity of streams [J]. Ecological Applications, 2000,5(10):1456-1477.
[104]Sickle J V, Huff D D, Hawkins C P. Selecting discriminant function models for predicting the expected richness of aquatic macroinvertebrates [J]. Freshwater Biology, 2006,51(2):359-372.
[105]Karr, Ellen W. Chu J R. Sustaining living rivers [J].Hydrobiologia, 2000,422/423:1-14.
[106]Reynoldson T B, Bailey R C, Day K E, et al. Biological guidelines for freshwater sediment based on BEnthic Assessment of SedimenT (the BEAST) using a multivariate approach for predicting biological state [J]. Australian Journal of Ecology,1995,20(1):198-219.
[107]Smith M J, Kay W R, Edward D, et al. AusRivAS: using macroinvertebrates to assess ecological condition of rivers in Western Australia [J]. Freshwater Biology, 1999,41(2):269-282.
[108]Davis J, Horwitz P, Norris R, et al. Are river bioassessment methods using macroinvertebrates applicable to wetlands? [J].Hydrobiologia, 2006,572(1):115-128.
[109]Joy M K, Death R G. Predictive modelling of freshwater fish as a biomonitoring tool in New Zealand [J]. Freshwater Biology,2002,47(11):2261-2275.
[110]Chessman B, Growns I, Currey J, et al. Predicting diatom communities at the genus level for the rapid biological assessment of rivers [J]. Freshwater Biology, 1999,41(2):317-331.
[111]Aguiar F C, Feio M J, Ferreira M T. Choosing the best method for stream bioassessment using macrophyte communities: indices and predictive models [J]. Ecological Indicators, 2011,11(2):379-388.
[112]Mendes T, Calapez A R, Elias C L, et al. Comparing alternatives for combining invertebrate and diatom assessment in stream quality classification [J]. Marine and Freshwater Research, 2014,65(7):612-623.
[113]Davies N M, Norris R H, Thoms M C. Prediction and assessment of local stream habitat features using large-scale catchment characteristics [J]. Freshwater Biology, 2000,45(3):343-369.
[114]唐 涛,蔡庆华,刘建康.河流生态系统健康及其评价 [J]. 应用生态学报, 2002,13(9):1191-1194.
[115]杨文慧,严忠民,吴建华.河流健康评价的研究进展 [J]. 河海大学学报(自然科学版), 2005,33(6):5-9.
[116]吴阿娜,杨 凯,车 越,等.河流健康状况的表征及其评价 [J].水科学进展, 2005,16(4):602-608.
[117]戴纪翠,倪晋仁.底栖动物在水生生态系统健康评价中的作用分析 [J]. 生态环境, 2008,17(6):2107-2111.
[118]郭向楠,张晓冰,马 涛.河流健康评估的研究与应用进展研究[J]. 环境科学与管理, 2013,38(10):170-174.
[119]邓晓军,许有鹏,翟禄新,等.城市河流健康评价指标体系构建及其应用 [J]. 生态学报, 2014,34(4):993-1001.
[120]张 杰,蔡德所,曹艳霞,等.评价漓江健康的 RIVPACS预测模型研究 [J]. 湖泊科学, 2011,23(1):73-79.
[121]陈 凯,刘 祥,陈求稳,等.应用 O/E 模型评价淮河流域典型水体底栖动物完整性健康的研究 [J]. 环境科学学报, 2016,36(7):2677-2686.
[122]孟 伟,秦延文,郑丙辉,等.流域水质目标管理技术研究(Ⅲ)——水环境流域监控技术研究 [J]. 环境科学研究, 2008,21(1):9-16.
[123]孟 伟,刘征涛,张 楠,等.流域水质目标管理技术研究(Ⅱ)——水环境基准、标准与总量控制 [J]. 环境科学研究, 2008,21(1):1-8.
