Modelling of a post-combustion carbon dioxide capture absorber using potassium carbonate solvent in Aspen Custom Modeller
2018-04-08YueWuFanWuGuopingHuNoumanMirzaGeoffreyStevensKathrynMumford
Yue Wu ,Fan Wu ,Guoping Hu ,Nouman R.Mirza ,Geoffrey W.Stevens ,Kathryn A.Mumford ,*
1 Department of Chemical and Biomolecular Engineering,The University of Melbourne,Victoria,Australia
2 Peter Cook Centre for CCS Research,The University of Melbourne,Victoria,Australia
3 Particulate Fluids Processing Centre(PFPC),The University of Melbourne,3010,Victoria,Australia
Keywords:Equilibrium Rate based Modelling Absorber Potassium carbonate
A B S T R A C T The process models for an equilibrium CO2 absorber and a rate based CO2 absorber using potassium carbonate(K2CO3)solvents were developed in Aspen Custom Modeller(ACM)to remove CO2 from a flue gas.The process model utilised the Electrolyte Non-Random Two Liquid(ENRTL)thermodynamic model and various packing correlations.The results from the ACM equilibrium model shows good agreement with an inbuilt Aspen Plus®model when using the same input conditions.By further introducing a Murphree efficiency which is related to mass transfer and packing hydraulics,the equilibrium model can validate the experimental results from a pilot plant within a deviation of 10%.A more rigorous rate based model included mass and energy flux across the interface and the enhancement effect resulting from chemical reactions.The rate based model was validated using experimental data from pilot plants and was shown to predict the results to within 10%.A parametric sensitivity analysis showed that inlet flue gas flowrate and K2CO3 concentration in the lean solvent has significant impact on CO2 recovery.Although both models can provide reasonable predictions based on pilot plant results,the rate based model is more advanced as it can explain mass and heat transfer,transport phenomena and chemical reactions occurring inside the absorber without introducing an empirical Murphree efficiency.
1.Introduction
Global climate change has recently been drawing continuous attention and is of worldwide concern.The observed change in climate is often attributed to anthropogenic emissions of carbon dioxide(CO2)from energy-intensive manufacturing processes including cement,iron,steel,natural gas production,and power generation.Even though renewable energy such as solar,geothermal,wind and tidal has been put forward as a possible solution and is developing rapidly,high energy requirements are forcing traditional fossil fuels to be continued until at least 2030,and beyond for these industrial processes which contribute up to 60%of global fossil fuel emissions[1–4].The high carbon content of fossil fuels is ultimately reacted to form CO2and released to the atmosphere.In order to limit the increase in temperature due to global warming below a threshold of 2°C by 2100[3],carbon capture and storage(CCS)has become one of the most feasible mitigation technologies.
There are three basic CO2capture pathways,these are pre-combustion capture,post-combustion capture and oxy-combustion capture,which are selected based on the sources and industrial processing technologies[5].Currently post-combustion technology is of great interest in capturing CO2from flue gas emitted from coal-fired power plants as it is easy to retrofit on the downstream process without significantly impacting the power generation operation[4].Common methods applied to post-combustion capture technologies include chemical solvent absorption,adsorption,cryogenics and membrane systems[6].Among these,solvent absorption is considered the most likely to be widely adopted for capturing CO2due to its technological maturity[7].In the chemical solvent absorption based carbon capture for post-combustion process,four categories of solvents including ammonia,amines,amino acids and carbonate salts are primarily considered.In comparison with amines,amino acids and ammonia solutions,potassium carbonate(K2CO3)has a number of advantages.K2CO3is less volatile,less corrosive,non-toxic and exhibits minimal oxidative degradation,and thus has fewer negative impacts on the environment[8].K2CO3solvent is also capable of capturing SOxand NOxthat are impurities usually contained in coal-fired flue gas,which may be used to produce valuable fertiliser products[9].The main challenge associated with K2CO3solvent is the slow reaction kinetics of pure K2CO3solvent;however,the addition of promoters such as amines and amino acids,which have active amine groups,can accelerate the reaction significantly[10].
The CO2capture process using K2CO3based solvents is a chemical absorption process.The process involves complex mechanisms requiring detailed knowledge of thermodynamic properties and chemical reactions of the chemical species.In addition,heat and mass transport properties are required to understand the performance within the internal structure of columns.Therefore,an accurate process model with a comprehensive thermodynamic property package is imperative to investigate and analyse the CO2capture process using K2CO3solvent in detail.
The thermodynamic properties mainly in terms of vapour liquid equilibrium(CO2solubility)and kinetics of using K2CO3solvent to absorb CO2with or without promoters have been investigated and studied extensively using experimental and numerical techniques,which have previously been summarised by a number of review works[4,5,10,11].Due to strong electrolytes existing in K2CO3based solvent systems,Hilliard and Lee utilised all available thermodynamic experimental data to fit and regress the Electrolyte Non-Random Two Liquids(ENRTL)thermodynamic model in Aspen Plus®.This can be used to simulate and predict properties such as density,heat capacity,and CO2partial pressure in K2CO3based solvent systems precisely[12–14].Based on the ENRTL model,a number of researchers have developed process models in Aspen Plus®.Mumford et al.[15]developed and validated an industrial K2CO3–H2O–CO2absorber using the Onda correlation for mass transfer and enhancement factor for reactions.Smith et al.[16]further employed and updated this model to validate a pilot CO2absorber using boric acid promoted K2CO3solvent.Borhani et al.[17]developed and validated a built-in RadFrac module in Aspen Plus®for a CO2absorber using diethanolamine(DEA)-promoted K2CO3solvent.The model contained linear discretisation to calculate diffusion-reactions in the liquid film.A parametric study for the inlet conditions including the inlet gas flowrate and inlet CO2concentration was also conducted.
Although Aspen Plus®provides a convenient platform to build and simulate the CO2capture process,only requiring the selection and input of key design and operating parameters,the program has a number of limitations.For example,the models developed in Aspen Plus®are limited to operation at steady state conditions,and so cannot be used to examine process dynamics,thus limiting the diversity of the models.In addition,users are only required to input certain parameters and the output results are automatically calculated by Aspen Plus®.This provides convenience,but limits the customisation,as it is difficult to edit equations in the interface of Aspen Plus®.Aspen Custom Modeller®(ACM)offers an opportunity to tackle these issues.ACM can share the thermodynamic databank of Aspen Plus®,and also allow users to customise and develop advanced process models that may run at either a steady state or dynamic state,which can be further exported and compatible with any AspenOne software such as Aspen Plus®,Aspen Hysys®and Aspen Dynamics®.Ooi[18]built a customised CO2absorber and stripper for the K2CO3–H2O–CO2–H2S system with the integration of the ENRTL thermodynamic model, film theory,enhancement factor and column hydrodynamic correlations in Aspen Custom Modeller and tested it in Aspen Hysys®.
This study aims to provide and compare two mathematical models,an equilibrium column and a rate based column,for CO2absorption in a packed absorber using K2CO3solvents without promoters in ACM.Both models include hydrodynamic correlations to describe the different packing types,and are validated using the experimental data from pilot plants.A sensitivity analysis regarding the important processing parameters,including CO2concentration in inlet gas stream,CO2loading in lean solvent stream,the flow rate of the lean solvent and inlet flue gas,and K2CO3concentration in lean solvent stream are conducted in the rate based model to check the impact on CO2capture performance.The models developed here are fundamental models.Using the ACM platform,it can be further developed and customised into,for example,an advanced K2CO3based absorber with different promoters,a dynamic model of CO2capture and a CO2capture with precipitation. These diverse absorption types are the basis for the development of novel and new generations of K2CO3solvent based carbon capture technologies in the future.
2.Background
2.1.Process description
In post-combustion capture applications,the absorber is operated close to atmospheric pressures,which is similar with the state of flue gas.When CO2is absorbed into K2CO3solvents,particularly at high concentrations of K2CO3,both physical reactions(gas–liquid equilibrium and liquid–solid equilibrium)and chemical reactions(electrolyte speciation)occur in the system.The overall reaction can be described in Reaction(1)[19].

The reaction is exothermic.As aqueous K2CO3and KHCO3are strong electrolytes,the electrolyte speciation may be appropriate to represent the system,which are K+,H+,OH-,and CO2.
Reaction(1)is not a one-step reaction,and it consists of a number of elementary steps.Essentially there are two reaction mechanisms involved in the overall reaction,which is dependent on pH of the solvent[20].
Mechanism 1(alkaline conditions):

Mechanism 2(acidic or neutral conditions):

Both mechanisms are accompanied with the dissociation reaction of water.

Reactions(2),(5)and(6)are considered instantaneous,while Reactions(3)and(4)are the rate controlling steps of CO2absorption.When pH is above 9(normal pH value for K2CO3based carbon capture process),Reaction(3)dominates and the contribution of Reaction(4)to the overall reaction can be considered negligible[8].
2.2.Thermodynamic model—ENRTL
In order to build a comprehensive process model in ACM,thermodynamic properties related to K2CO3solvent need to be accurately developed and validated.The ENRTL thermodynamic model is widely selected as the thermodynamic model for K2CO3solvent systems to calculate density,viscosity,diffusivity of CO2in aqueous K2CO3,surface tension,thermal conductivity and specific heat capacity[5].The ENRTL model is developed to determine the non-ideality associated with a single salt which dissociates completely in the water[21].In this model,both long range electrostatic interactions and short range interactions between ions and molecules are considered.However,the interaction parameters among each component such as binary parameters on liquid mixture are required to be regressed from experimental data to obtain high accuracy.A number of researchers utilised the data regression system(DRS)of Aspen Plus®to estimate binary parameters and parameter correlation of the ENRTL model based on great amounts of published experimental data on the K2CO3system[12–14].
Lee et al.[12]have extensively studied the ENRTL model for the aqueous K2CO3system based carbon capture processes.Nearly 3000 experimental points mainly in terms of CO2solubility,heat capacity and viscosity were used and regressed in DRS in Aspen Plus®.The regressed ENRTL model was further validated based on other experimental sources which were not used for the regression.The results simulated from the regressed ENRTL model were highly consistent with experiments,which provides sufficient accuracy and confidence to build the CO2absorber in ACM in our work.Detailed methodology and procedure of regression in DRS can be found in Lee's article[12].
3.Equilibrium CO2 Absorber Modelling
3.1.Mathematical model
The details of the mathematical model for an equilibrium CO2absorber are given in the supplementary material section S1.The basic equations for the equilibrium CO2absorber were built based on the MESH equations(Mass balance,Equilibrium,Summation and Heat balance)[22].Each stage was modelled as an isolated unit using the MESH equations.In addition,chemical reaction equilibrium was included on each stage using the activity coefficients calculated from the ENRTL model,and electrolyte speciation,electrolyte neutrality.Packing hydraulics were also considered in the model.By combining and integrating all equations into ACM Version 9.0,a single theoretical equilibrium stage was modelled and simulated.A column model can be further built in ACM through changing the total number of theoretical stages.
3.2.Modelling results and validation with Aspen Plus®
The model built in ACM was tested by comparing the results simulated with Aspen Plus®using the same inputs.The input details are shown in Table 1,which were the same in both models.The pressure drop of the absorber in Aspen Plus®is required to be specified by the user,whereas the pressure drop in ACM is calculated based on the characteristics of the packing materials.This is the only input difference between these two models.In Aspen Plus®,the pressure drop was assumed to be zero.In ACM,a random packed metal Pall Ring was used,and the characteristics of the packing materials are indicated in Table 2.
Figs.1 to 6 present the simulation results for both models,including the temperature profile,pressure profile,liquid flowrate along theabsorber,vapour flowrate along the absorber,CO2vapour flowrate along the absorber and H2O liquid flowrate along the absorber.To ensure the ACM results were consistent with Aspen Plus®,the Murphree efficiency was not applied to the equilibrium absorber for both models,which means the results obtained from both equilibrium models were ideal.After the ACM model was validated by the Aspen Plus®model,the Murphree efficiency may be introduced to validate real experimental data,which is discussed in Section 3.3.

Table 1 Specification of input parameters for both models

Table 2 Characteristics of packing materials[18]
Overall the results of both models are in good agreement with only a small difference at the bottom of the column.This difference is likely a result of the different pressure drop estimations between the two models.No pressure drop was assumed in the Aspen Plus®model but pressure drop was considered on the basis of the hydraulics of the packing in the ACM model.As both models were calculated based on fugacity and activity coefficients,which are the function of the pressure,this may cause a slight difference in the results obtained.In addition,the default setting of convergence tolerance in ACM was 10-5,whereas default setting in Aspen Plus®was 10-4,which means theoretically the ACM model is more rigorous and accurate than Aspen Plus®.
Fig.1 presents the temperature distribution along the column.There was a temperature bulge at the bottom of the column indicating the overall reactions were exothermic,and the adiabatic assumption led to an increase in the stage temperature.The dramatic increase of temperature mainly occurred at the bottom due to the high concentration of CO2and K2CO3solutions at this location.Both models were able to capture this characteristic.The relative difference for predicting the temperature between these two models was less than 10%.
Fig.2 presents the pressure drop along the absorber.A significant pressure drop was not predicted by the ACM model,and was only 0.0025 bar from the top to the bottom.This indicates that the pressure drop calculated based on the characteristics of packing materials using the Stichlmair correlation was in a reasonable range to avoid flooding.In general,a typical value of 0.007 bar is given for each tray in a sieve tray column,and the pressure drop of a packing column is less than the typical value at the same operating conditions[23].

Fig.1.Temperature profile of the absorber(Aspen Plus®validation).

Fig.2.Pressure profile of the absorber(Aspen Plus®validation).

Fig.3.Vapour flowrate along the absorber(Aspen Plus®validation).
Fig.3 indicates the total vapour flowrate along the column.When vapour flowed through the bottom to the top,as expected,the vapour flowrate decreased.This was the most rapid at the bottom stages as CO2was absorbed dramatically by K2CO3solutions at the bottom stages.In addition,at the top half of the column,vapour flowrate did not further decrease primarily because the majority of the CO2had been absorbed at the bottom of the column as a result of the equilibrium assumption.This was also in agreement with Fig.5 which showed a reduction in CO2concentration in the bottom half of the column but remaining constant in the top half.

Fig.4.Liquid flowrate along the absorber(Aspen Plus®validation).

Fig.5.CO2 vapour flowrate along the absorber(Aspen Plus®validation).
Fig.4 shows the total liquid flowrate along the column.As the chemical reactions mainly occurred in the bottom,most CO2was absorbed and transferred into KHCO3in the liquid phase,thus resulting in the increase of overall liquid flowrate at the bottom.This also corresponded to the temperature profile shown in Fig.1,indicating that the bulge was dominated by the reactions occurring at the bottom.
Figs.5 and 6 indicate CO2flowrate in the vapour phase and H2O flowrate in the liquid phase along the absorber,respectively.Both models show the same trend in the change of the components.However,CO2flowrate has a larger deviation at up to 21%near the bottom.However,there is limited deviation on H2O flowrate in the liquid phase.One possible reason is that there is a reduced accuracy of calculation of the smaller concentration of components which in this case is CO2.
From this simulation,it is clear that the equilibrium absorber built in Aspen Plus®and ACM is consistent.Although Aspen Plus®provides convenience and simplification,it is limited to simple systems.The diversity of K2CO3solvent systems such as using different promoters and specific column design requires more flexibility and complexity in the model,which is easier to include in Aspen Custom Modeller.
3.3.Modelling results and validation with experimental data
The ACM model was further used to validate the experimental data from a pilot plant operated in the University of Melbourne.Key information of the absorber in the project was summarised in Table 3.More detail regarding the experiment design and operation can be found in previous works[24,25].Here loading represents the holding capacity or absorption capability of CO2in K2CO3solvent,which is defined using the following equation:

Fig.6.H2O liquid flowrate along the absorber(Aspen Plus®validation).

Table 3 Specification of the absorber used in the pilot plant[24]
The Murphree efficiency was applied to validate the experimental data with the ACM model,in order to rectify the non-ideal performance of the pilot plant.The definition is indicated as:

According to Mores[26],the Murphree efficiency of the CO2-amine absorption system was dependent on gas and liquid mass transfer,chemical reactions and packing hydraulics.Here a similar estimation of the Murphree efficiency related to the characteristics of the K2CO3solvent systems can be described as:

Fig.7.The validation of pressure drop between ACM and experimental data from the pilot plant.

Fig.8.Gas outlet CO2 concentrations of ACM simulation and experiments.

where h is the height of each packing section(m);a′is the effective area(m2·m-3),which can be calculated from the Onda correlation in Eq.(10);Gj′and Lj′are the gas and liquid cross-sectional mass flowrate(kg·m-2·s-1),respectively;kgand klare the gas mass transfer coefficient(kmol·m-2·s-1·kPa-1)and liquid mass transfer coefficient(m·s-1),respectively;miis the component vapour–liquid equilibrium constant;Gjand Ljare the gas and liquid molar flowrates(kmol·s-1),respectively;Ejis the enhancement factor which describes the overall absorption is enhanced by chemical reactions at the stage j,and the expression is indicated in Eq.(11).


Fig.9.Rich solvent loadings of ACM simulation and experiments.

Table 4 Summary of comparison results and operating conditions
where a is the factory packing specific area(m2·m-3);σcand σ are the critical surface tension of packing materials and liquid surface tension(N·m-1),respectively.

where kris the rate reaction constant of Reaction(3)by assuming Reaction(3)was a pseudo first order reaction(s-1);[CO2]lis the CO2mole fraction in the liquid phase;DCO2,lis the CO2diffusion coefficient in the liquid phase(m2·s-1).
The pressure drop was measured by flowing air and water through the pilot plant,at a constant water flowrate of 4 kg·m-2·s-1.The pressure drop predicted by the ACM model using the Stichlmair constants corresponding to the specific packing materials used in the absorber matched the experimental data.The validation results are shown in Fig.7.
In order to predict the absoption results more accurately,6 stages were used in the model,with each stage measuring 0.4 m based on the packing height of the absorber used in the pilot plant.
Figs.8 and 9 show the validation results between the ACM model and experimental data.The results include gas outlet CO2concentrations and rich solvent loadings.The operating conditions and comparisons are summarised in Table 4.Both figures indicate the error between simulation and experiment is within 10%,which means the results predicted by the ACM equilibrium model using the Murphree efficiency are reliable.The assumption of an equilibrium model for the chemical reaction results in a small Murphree efficiency(about 0.01)to predict the non-ideal behaviours of the absorber.ACM cannot predict the temperature accurately because it is assumed an adiabatic process in the ACM model,whereas there was significant heat loss during the experiment.The model way be modified to account for heat loss as required later.In addition,under the certain operating circumstances,for example,the inlet CO2concentration is 25 vol%,the ACM model provides stable results which are nearly the same when compared to the experiment results.
4.Rate Based CO2 Absorber Modelling
According to Ooi[18],although employing an equilibrium model in conjunction with a Murphree efficiency can achieve acceptable results for a CO2absorption process using carbonate solvents,the efficiency needs to be determined based on experimental data to get an empirical value,or determined using transport parameters such as mass transfer coefficients and enhancement factors.These parameters can be derived from a rate based model.The Murphree efficiency correlated with mass transfer coefficients and enhancement factors has been successfully applied to the equilibrium model as discussed in Section 3.This means that in order to obtain an accurate equilibrium-stage model for a CO2capture process using K2CO3solvents,a rate based model is essential and prerequisite.The difference between the two models is presented schematically in Fig.10.

Fig.10.Equilibrium model and rate based model for simulating a CO2 absorber.

Table 5 Experimental conditions of the pilot plant
In a rate based absorption process,both mass and energy are transferred across the interface of vapour and liquid phases.Generally it is assumed that the equilibrium state including thermodynamic equilibrium,reaction equilibrium and mechanical equilibrium can only be achieved at the fluid interface[22].In addition,for a CO2reactive absorption process using K2CO3solvents,the reaction kinetics,vapour–liquid–solid equilibria,the electrolyte thermodynamics and hydraulics of the packed column should be considered[27].Moreover,to design a packed column and receive reliable results,the process mechanism and the characteristics of packing materials should be comprehensively understood[28].
For a vapour–liquid reactive absorption process,it is assumed that the chemical reactions only occur in the liquid phase,and two common methods are used to implement a rate based model.A simple way involves incorporating the enhancement effect resulting from chemical reactions on the traditional physical mass transfer by introducing an enhancement factor and Hatta number.The second way is more complex and based on film discretisation theory.In this method,the liquid film is discretised into several segments,and the reaction kinetics are considered in each segment[17].A number of researchers have evaluated these two methods applied to CO2capture processes using amines[18,29],and found that both methods can generate similar results,although film discretisation requires more computation time.In addition,Asprion[30]investigated the impact of the number of film segments used and different grid distributions on the computation time and accuracy of simulating a reactive absorption process.He found that the effective way of discretising the film is highly dependent on the characteristics of reactants and absorption processes.On the other hand,numerous studies have also been published using an enhancement factor to simulate a hot potassium carbonate CO2absorption process[18,31–38].

Fig.11.Temperature profile along the column.
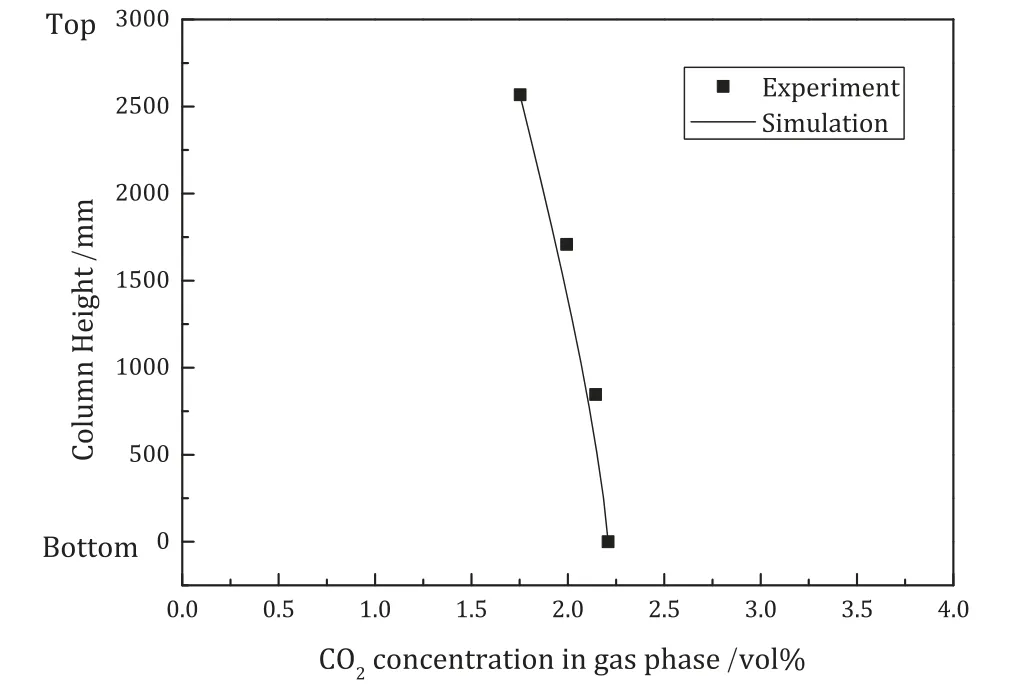
Fig.12.CO2 concentration in the gas phase.
To avoid a Murphree efficiency and obtain a more rigorous model involving in mass and energy transfer phenomena and reaction kinetics,a rate based CO2capture absorber using K2CO3solvents with an enhancement factor is developed in ACM.The regressed ENRTL thermodynamic model is remained for modelling the thermodynamic properties of the solvent system.Reaction kinetics and equilibrium constants used for the rate based model are obtained from available literature.
4.1.The mathematical model for rate based CO2 absorber
The mathematical model was built based on the two-film theory via an introduction of mass flux and energy flux across the film interface.Reaction kinetics were also considered through an enhancement factor.The mass transfer coefficients and effective interfacial area were calculated from the correlation of packing hydraulics.All details can be found in the supplementary material section S2.
4.2.Results and discussion
4.2.1.Validation of the rate based model

Fig.13.CO2 loading in the liquid phase.

Table 6 Experimental setup in the pilot plant
The experimental results,Case 4(A2),from the TU Berlin pilot plant was used to validate the rate based model[39].The column had a diameter of 100 mm with three structured packings of SULZER Mellapak 350Y.Each packing was 856 mm high.The pilot plant was controlled by an automation system.Liquid samples were withdrawn and analysed at three different positions along the absorber,and gas samples were taken and measured at four different heights via gas chromatography.The conditions of inlet gas,inlet lean solvent and column configuration are provided in Table 5.
For the rate based model,as 10 stages were used in the model,the height of each stage was 256.8 mm.The Bravo correlation for structured packing was used to determine mass transfer coefficients and effective interfacial area.The pressure at the top of the column was set to 112.3 kPa,and the overall pressure drop was set to 634 Pa.
The results of the validation for temperature,CO2concentration in the gas phase and CO2loading in the liquid phase are presented in Figs.11,12 and 13,respectively.
As shown in Fig.11,there is a slight underestimation by the simulation for the temperature profile.In this work,the column was assumed adiabatic,which means that there was no heat loss during the absorption process,and this may impact the accuracy of predicting the temperature of the experiments.
Figs.12 and 13 show that the rate based model predicts the CO2concentration in the gas and liquid phases well.This is especially the case for the CO2concentration in the gas stream at four locations along the column.There is only slight underestimation of CO2concentration in rich solvent.
The good consistency between the model and the experimental data shows that the rate based model developed in ACM is capable of simulating the key features of the CO2absorption process using the K2CO3solvent system,such as the CO2concentration in the outlet gas stream and the CO2loading in the rich solvent.

Fig.14.CO2 concentration in the outlet gas stream.
4.2.2.Simulation of the rate based model
Further simulations using the developed rate based model were conducted to predict the CO2concentration in the outlet gas stream and the CO2loadings in the outlet liquid stream based on the pilot experiments performed at the University of Melbourne.There were eight CO2absorption experiments using 30 wt%K2CO3solvents with loadings of 0.08 to 0.14 run in the pilot plant,and the CO2concentration of the inlet gas stream was either 10 vol%or 25 vol%.The column specification is the same with the column used for the equilibrium model,which is shown in Table 3,and the results of the rate based model are given in Table 6.The loading is defined in Eq.(7).As random packings were used in the pilot plant,Onda's correlation was employed in the model to evaluate the mass transfer coefficients and the effective interfacial area.
The comparison of simulation and experimental results is given in Figs.14 and 15.
The open points denote 10 vol%of CO2in the inlet gas stream,whereas the solid points represent 25 vol%of CO2in the inlet gas stream.As can be seen from Fig.14,similar with the structured packing simulation,the model can predict the CO2concentration in the outlet gas stream accurately,within an error of 5%.Fig.15 shows reasonable simulation results for CO2loadings in the rich solvent stream,with the deviation limited to approximately 10%.
4.3.Sensitivity analysis
It is paramount to investigate the sensitivity of input parameters,including CO2concentration of flue gas,CO2loadings in the lean solvent,flow rate of flue gas and lean solvent,and K2CO3concentration in lean solvent on CO2recovery,using the validated rate based model.Here,the CO2recovery is defined as:

Fig.15.CO2 loadings in the outlet liquid stream.

Fig.16.Spider diagram of the sensitivity analysis of input parameters using the rate based model.
In this sensitivity analysis,experiment number 4 in Table 6 was selected as the base case.Five investigated parameters were changed from-20%to+20%in the rate based model,and the criteria of CO2recovery were calculated correspondingly.Results are shown in Fig.16.
It can be seen that CO2concentration in flue gas and the flow rate of lean solvent have positive slopes in the sensitivity analysis.This means that an increase of CO2concentration in flue gas or the flow rate of lean solvent can increase CO2recovery,whereas an increase in CO2loadings of lean solvent,K2CO3concentration in lean solvent and the flow rate of flue gas,can decrease the CO2removal efficiency.In addition,the flow rate of flue gas and K2CO3concentration in lean solvent have the largest slope,which means the variation on these two parameters,particularly for the flow rate of flue gas,has a large impact on CO2recovery.However,it is important to note that there is an optimum value for K2CO3concentration in lean solvent to obtain the maximum CO2recovery.

Fig.17.Comparison results of output CO2 concentration between experiments and different models.

Fig.18.Comparison results of CO2 loadings in rich solvent between experiments and different models.
5.Comparison of the Equilibrium Model and the Rate Based Model
A group of simulation results using the rate based model and the equilibrium-stage model are compared,which are shown in Figs.17 and 18,respectively.
As can be seen from Figs.17 and 18,both rate based model and equilibrium-stage model can predict CO2output concentration and CO2loadings well.The rate based model performs better than the equilibrium-stage model on the CO2outlet concentration,but slightly worse on the CO2loadings in the rich solvent.However,it should be noted that the equilibrium model employs a Murphree efficiency to correct the deviation between the experimental results and the simulation results,which is generally empirical and small(approximate 0.01 in this work)due to the existence of chemical reactions.The rate based model provides a more realistic mathematical model containing mass and energy transfer phenomena,transport phenomena across the interface and reaction kinetics inside of the absorber,and the results obtained are very similar with the experimental results without the introduction of the empirical efficiency.Therefore,the rate based model is a more advanced process model to simulate CO2capture using K2CO3solvents.
6.Conclusions
The mathematical model of an equilibrium CO2absorber using K2CO3solvents has been developed in ACM.The simulation results were compared and validated in Aspen Plus®,showing that the equilibrium model in ACM well illustrated the“black box”calculation in Aspen Plus®.The model was further used to compare and validate the experimental results of a pilot plant via introducing a Murphree efficiency.The errors between simulation and experiments were within 10%.
A rate based model,including mass and energy flux,transport phenomena across the interface and reaction kinetics,was developed for a CO2absorber using K2CO3solvents.The simulation results in the form of temperature profile along the column,CO2concentration in the gas phase and CO2loading in the liquid phase were validated using the experimental results from a structured packing absorber in a pilot plant.The model also has good agreement with the experiments conducted in another pilot plant using a random packed column within a 10%error.A sensitivity analysis found that the flow rate of flue gas and K2CO3concentration in the lean solvent significantly affect CO2removal efficiency.Compared with the equilibrium model,the rate based model is more advanced to predict the CO2absorption performance using K2CO3solvents without the introduction of an empirical Murphree efficiency.
Acknowledgements
The authors acknowledge the technical and financial support from Peter Cook Centre for CCS Research.Infrastructure support from Particulate Fluids Processing Centre(PFPC)is also kindly appreciated.
Supplementary Material
Supplementary data to this article can be found online at https://doi.org/10.1016/j.cjche.2018.06.005.
杂志排行

Chinese Journal of Chemical Engineering的其它文章
- Ni/bentonite catalysts prepared by solution combustion method for CO2 methanation☆
- Mass transfer correlations for membrane gas-solvent contactors undergoing carbon dioxide desorption
- Carbon deposition and catalytic deactivation during CO2 reforming of CH4 over Co/MgO catalyst☆
- The CO2 absorption and desorption performance of the triethylenetetramine+N,N-diethylethanolamine+H2O system☆
- Recent developments and consideration issues in solid adsorbents for CO2 capture from flue gas☆
- High-efficiency and pollution-controlling in-situ gasification chemical looping combustion system by using CO2 instead of steam as gasification agent