Variational Mode Decomposition for Rotating Machinery Condition Monitoring Using Vibration Signals
2018-03-29,,,
,,,
1.Institute Noise and Vibration,Universiti Teknologi Malaysia,54100Kuala Lumpur,Malaysia;
2.Faculty of Mechanical Engineering,Universiti Teknologi Malaysia,81310Skudai,Johor,Malaysia
0 Introduction
Failures in engineering systems are basically due to the rotating components,such as the gears,bearings,turbines,shafts and rotors.Prolonged operation in harsh working conditions causes these components to deteriorate,especially the gears and bearings.In most cases,sudden failures are a major problem in industries in which such failures cause losses in finance,equipment and resources.Hence,maintaining and sustaining the rotating machinery components is very important for ensuring safe operation and avoiding fatalities.Condition monitoring technology offers a good solution for industrial staff when maintaining their assets[1].Vibration-based monitoring is one of the most popular condition monitoring technologies,and has been used in many industries because of its simple,low implementation cost and effectiveness compared with other monitoring technologies.
Much research has been carried out over recent decades to produce a more effective and efficient rotating machinery monitoring process.In recent condition monitoring investigation,the combination of signal processing method and machine learning algorithms have been widely used[1,2].The signal processing method is very important for ensuring the accuracy of the information,and characteristics used in the analysis process and in the machine learning algorithm help to reduce human interpretation errors and provide automated monitoring strategies.Empirical mode decomposition (EMD),introduced by Huang et al.,is a well-known signal processing method used in monitoring studies due to its ability to analyse non-linear and non-stationary signals,and to address the limitations of the traditional fast Fourier transform (FFT)method[3-6]as well.The EMD method has been combined with many machine learning algorithms for rotating machinery monitoring,such as neural network,Bayesian,support vector machine(SVM)and extreme learning machine(ELM)[7-11].
However,the EMD method suffers from a mode mixing problem and an end effect problem,which in most rotating machinery applications are due to the complexity of the rotating machinery signals characteristic[12,13].In order to address the issue of the EMD method,there are many improvised versions of the method that have been proposed,such as ensemble EMD(EEMD)[14],complementary EEMD (CEEMD)[5],partial EEMD(PEEMD)[15]and local mode decomposition(LMD)[16].The EEMD method has been used with neural network,artificial bee colony(ABC)and SVM[17-19].For the CEEMD method,SVM and ELM have been used as a combination for monitoring strategies[20,21]. For PEEMD and LMD,variable predictive mode-based class discrimination(VPMCD),neural network and SVM have been used[22-24].However,the end effect and the mode mixing problems still occurred in these improvised methods,which can lead to inefficient and inaccurate monitoring and diagnosis process[24,25].
Recently,an adaptive and non-recursive signal processing method called the variational mode decomposition (VMD)has been proposed by Dragomiretskiy et al.[26].The VMD method has overcome the limitations of the EMD method by having a unique decomposition procedure as compared with other decomposition procedures.However,the VMD method requires certain parameters to be determined,particularly the number of modes to be reconstructed.This becomes a problem for the VMD method,as an inaccurate set of mode numbers will affect the decomposition result.This problem is still considered as open for the VMD method[26,27].Zhang et al.have used the number of dominant frequency characteristics of the signals as the number of modes for the VMD method[28].Recently,Li et al.have used the locally weighted scatter plot smoothing method(LOWESS),which locates the number of major peaks in the envelope spectrum,and uses this as the mode number for the VMD method[27].In addition,Zhang et al.have proposed a selection method based on a correlation and energy ratio to select the mode number for the VMD method[29].
This study therefore aims to propose a mode selection number for the VMD method based on the statistical parameter ratio(SPR)plot.This proposed method is more effective in determining the mode number for the VMD method,especially when used for complex signal characteristics when compared with a selection method based on dominant frequency characteristics and major peaks in the envelope spectrum.The method can also be used as an alternative for the selection method based on correlation and energy ratio,and it will provide a better visualization in selecting the mode number for the VMD method.The statistical characteristics are used here as input for the ELM algorithm for fault classification,and the result has been compared with artificial neural network(ANN).The comparison between features extracted from the original signals,intrinsic mode functions (IMFs)and variational mode functions(VMFs)have also been compared.
1 Method Theory
1.1 Variational mode decomposition
The VMD method is a modern decomposition tool which decomposes the vibration signal into sets of sub-signals called VMFs.The sub-signals define amplitude modulated and frequency modulated(AM-FM)signals,as described in Eq.(1),and the total practical VMF Bandwidth,BWas estimated using Eq.(3)according to Carson′s rule,Eq.(2)[26].

wherekis the mode number,k(t)the a non-decreasing function,′k(t)≥ 0,the envelope is non-negativeA′k(t)≥0.The change of envelopeAk(t)and the instantaneous frequency′k(t)are much slower thank(t).Therefore,the mode componentuk(t)can be considered as a pure harmonic signal with amplitudeAk(t)and instantaneous frequency′k(t).
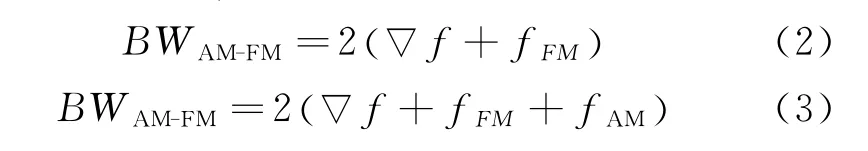
wherefis the maximum frequency deviation,fAMthe component of amplitude-modulated frequency,andfFMthe component of frequencymodulated frequency.
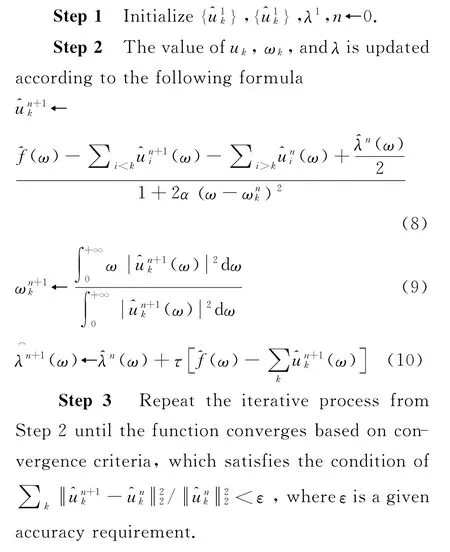
The VMD method relies on three basic concepts,i.e.,Wiener filtering,heterodyne demodulation and one-dimensional Hilbert transform.The method decomposed an input signal into different modes with a specific scale by assuming that each mode is a finite bandwidth signal with a pulse at the centre.Firstly,VMD uses Hilbert transform to obtain the single spectrum for each mode and to transfer the spectrum of each mode to the fundamental frequency by using exponential correction.This will evaluate the bandwidth of each mode and construct the constraint model of the variational problem.
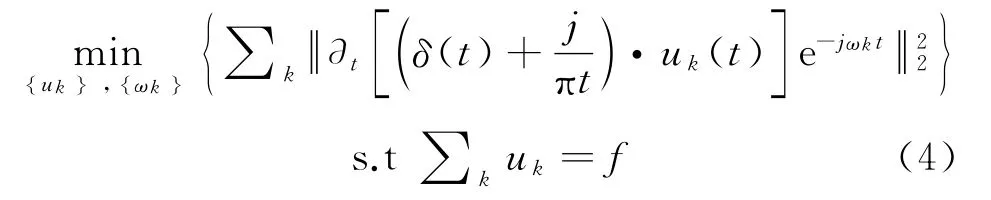
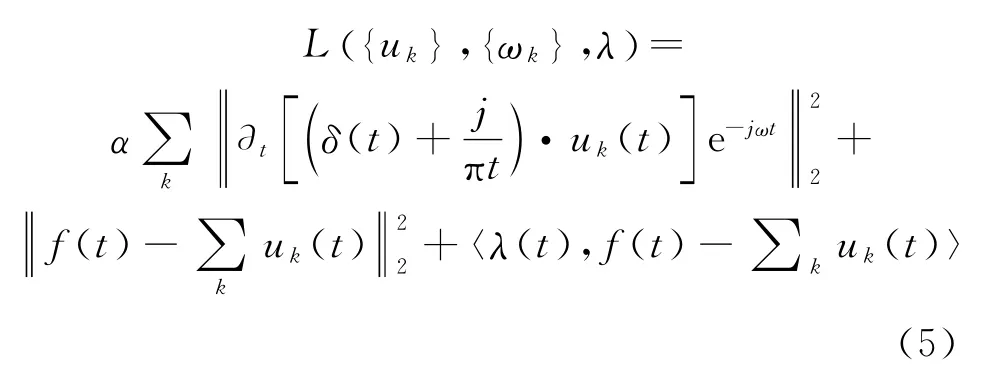
whereωkis the centre frequency of the mode,andfis the input signal.A quadratic penalty term and Lagrange multiplier,λoperator was introduced to convert the constraint problem into a non-constraint problem.
The above equation found a sub-problem in the sub-optimization method,called the alternate direction method of multipliers (ADMM).The solution to the sub-problem using Eq.(6)with respect toukand Eq.(7)with respect toωk
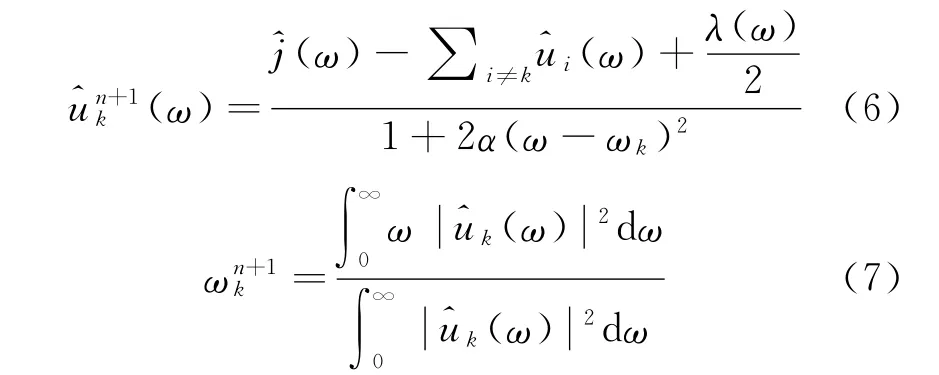
By substituting the solution with the sub-optimization method,the full algorithm for the VMD method was established as the following expression[26]:
1.2 Extreme learning machine
ELM is a simple and efficient algorithm for training single-hidden layer feedforward neural networks (SLFNs),as proposed by Huang et al.[30].SLFNs consist of the input layer,a hidden layer and an output layer,in which the input layer hasnneurons corresponding to theninput variables,the hidden layer hasIneurons and the output layer hasmneurons corresponding to themoutput variables.The algorithm randomly generates the connection weight between the input and the hidden layers,as well as the threshold of the hidden layer neurons without any adjustment in the training process.It also obtains the optimal solution by adjusting the number of hidden layer neurons.ELM provides better generalization performance at extremely fast learning speeds as compared to traditional feedforward network learning algorithms[30].ELM helps to resolve some of the issues of conventional gradient-based algorithms for SLFNs,such as algorithms becoming unstable,and diverges when the leaning rate is too large.The algorithm converges slowly when the learning rate is small,and stops at the local minima if it is located far above the global minima,which is undesirable,over-trained and time-consuming[30].The algorithm of ELM can be summarized as follows.
Given a training dataset withpclasses{xi,yi},i=1,…,Nandyi∈Rp.xi∈Rqis aqdimensional data point.IfG(x)is an infinitely differentiable activation function in the hidden layer,then the output of SLFN is express as

whereLis the number of hidden notes,andajandbjthejth hidden node′s learning parameter assigned randomly.βj∈ Rpis the output weight vector.The SLFN output of the matrix form can be and expressed as
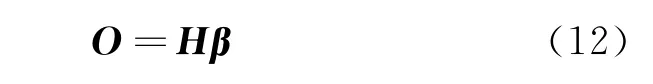
where
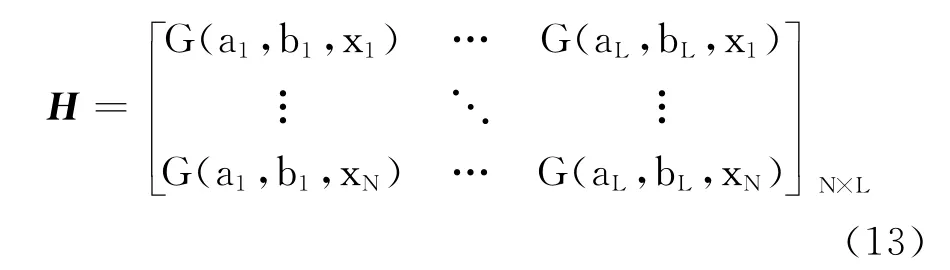
where His called the hidden layer output matrix of the network.Hijrepresents thejth hidden node with respect to the input samples,xi·β=There-fore,the objective function of ELM can be expressed as

where H+and Y =Penrose generalized inverse of matrix H.The above output weight matrixβminimizes the cost
2 The Proposed Method
The performance of the VMD method mainly depends on the accuracy of the input parameters,which comprise the balancing parameter (α),the time-step of dual ascent(τ),the number of mode(K),the initial omega(ω )and the tolerance.Some of the input parameters have a standard value.For example,the tolerance has a typical value of 1×10⁻⁶,theωis 0(allωwill start with 0)and theτis 0for noise-slack as mentioned by Ref.[26].Theαcan be set to 1 500to have a good decomposition result,as stated by Zhang et al.[29]The number of mode is an important parameter for the VMD method.This is due to the mode number determining the number of the VMF that will be reconstructed by the VMD method.Initiating an inaccurate number of mode will cause the under-decomposed and over-decomposed problem of the VMD method,as well as potential information losses from the input signal.Therefore,it is very important to have a good mode selection method for the VMD method.
Here,a selection method based on SPR has been proposed,as shown in Fig.1.The statistical parameter used in this paper is described in Table 1,in whichx(n)represents a time series of signals of thenth signal sample.In a recent study,Zhang et al.have proposed a selection method based on the correlation and energy ratio,which also provided a good selection method for the VMD method[29].This method calculates the correlation and energy ratio between each VMF and input signal and selects the high value for use in the correlation and energy ratio plot.Here,SPR calculates the ratio between the sum of the VMFs and the input signal to produce the SPR plot.Therefore,the selection method using SPR can provide an alternative approach to selecting the mode number for the VMD method.It also provides better visualization for selecting the mode number.
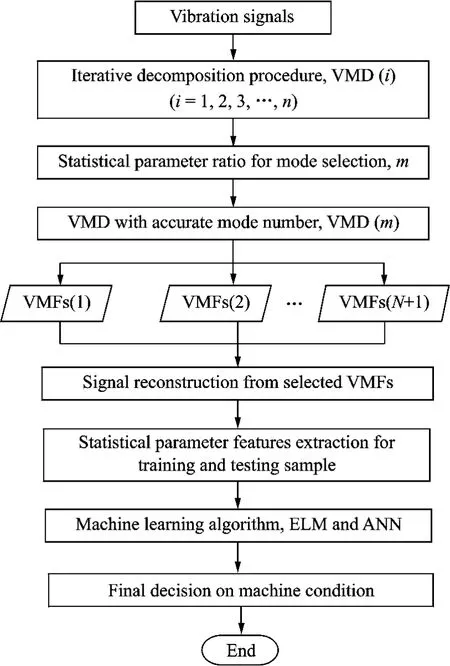
Fig.1 Flowchart of the proposed method
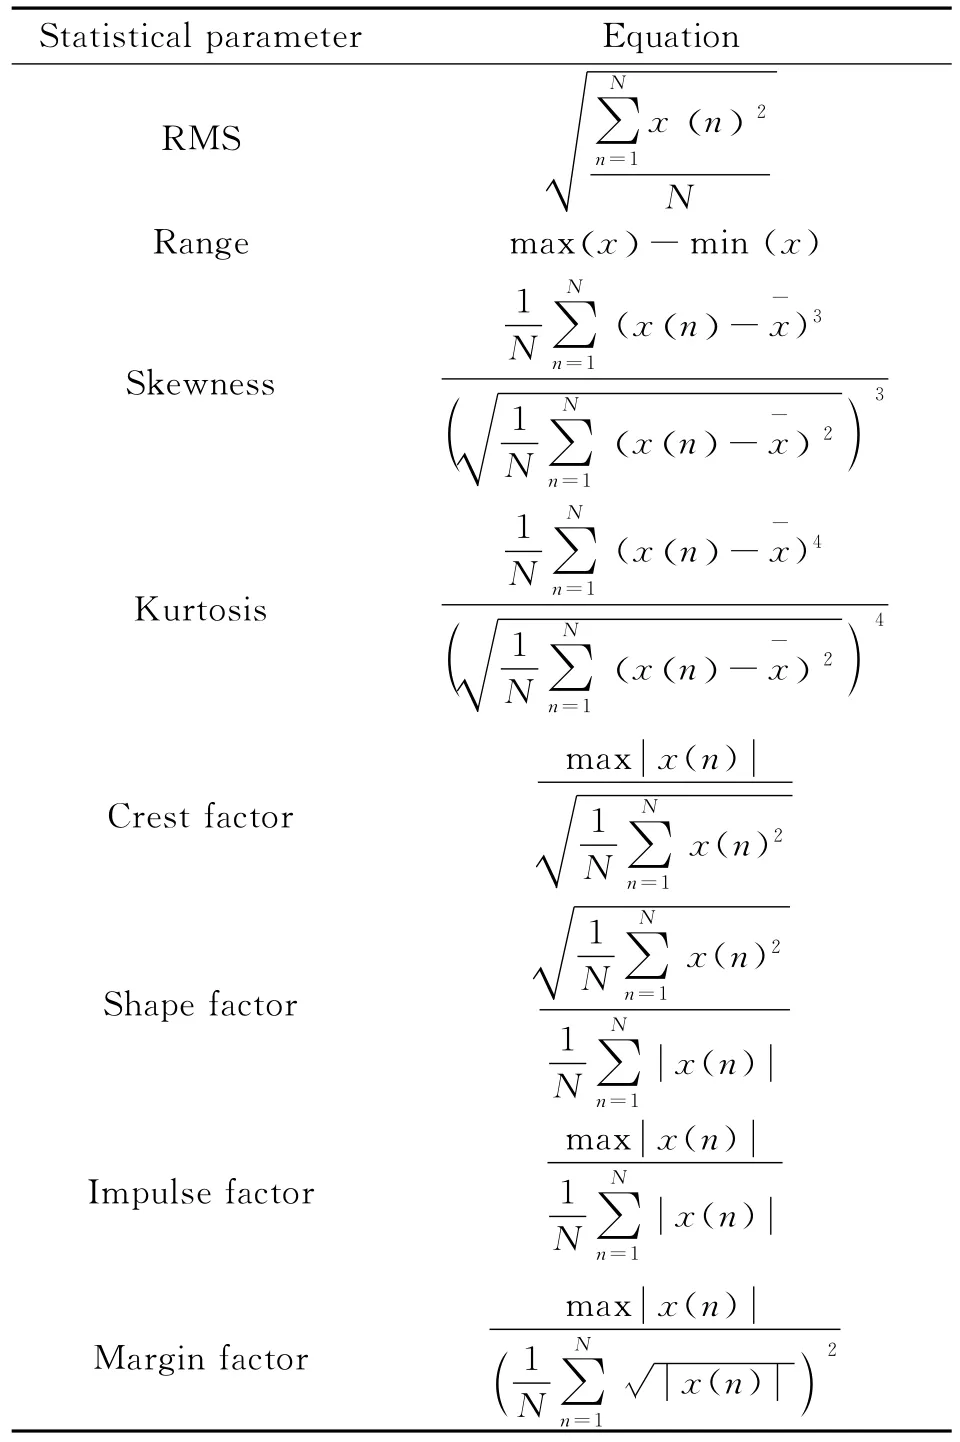
Table 1 Statistical parameters
The simulated signals have been generated and used to validate the performance of the proposed selection method.Eq.(15)describes the simulated signals

A Gaussian white noise is added to the simulated signals with a signal-to-noise(SNR)ratio of 30.The simulated signals are then iteratively decomposed using the VMD method of different mode set numbers,ranging from 1to 10.The other parameters used were initially set to the standard value,as described earlier.The statistical parameter ratios are then calculated and plotted against the number of modes.Fig.2shows the simulated signals as described in Eqs.(15—18).
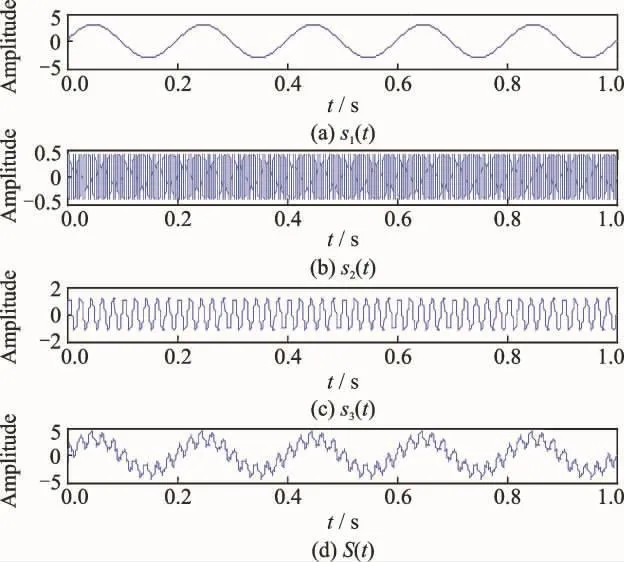
Fig.2 Simulated signals
The simulated signals in Fig.2were decomposed into three different decomposition results with the number of modes set to 3,4and 5in order to simulate the problem of the VMD method when using inaccurate mode numbers.Based on the result in Fig.3,the under-decomposed problem occurred when the decomposition was three,and where the component of the simulated signals was mixed within the reconstructed mode.When the mode is 4then the decomposition result is good,as all the components of the simulated signals were reconstructed with the fourth mode,as Gaussian noise,added.When the mode is 5,then over-decomposition occurred with an extra mode having been reconstructed,although not significantly affecting the components of the simulated signals.It can thus be concluded that the underdecomposed must be avoided in the VMD method,whereas the over-decomposed is fine,although it is better to avoid this for the sake of ensuring the accuracy of the decomposition result.
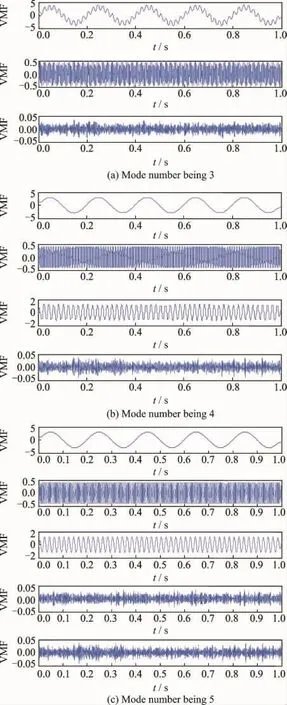
Fig.3 Decomposition results with different mode numbers
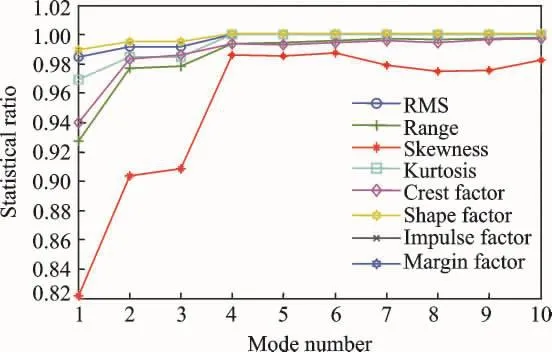
Fig.4 SPR plot for the simulated signals

Fig.5 Selected SPR plot for a simulated signal
The proposed selection method was then applied to the simulated signals.This is shown in the SPR plot in Fig.4,which consists of eight different SPR plots.To gain an adequately improved visualization for selecting the mode number,the SPR plot has been reduced to two plots consisting of RMS and shape factors,as shown in Fig.5.Hence these two SPR plots can provide better visualization and thus they avoid confusion in selecting the mode number for the VMD method.This is because the mode number will be selected based on the first point,where the plot starts to attain a steady state or a similar value.In this case the mode selected for the simulated signals is 4,referring to Fig.5.
To further validate the proposed selection method using SPR,more complex signals have been used.These are the online gearbox vibration signals downloaded from Acoustic and Vibration database provided by Bechhoefer[31].Both the healthy and the faulty signals are shown in Fig.6.The proposed selection method then applies to both the healthy and faulty signals and to the SPR plot shown in Figs.7,8.
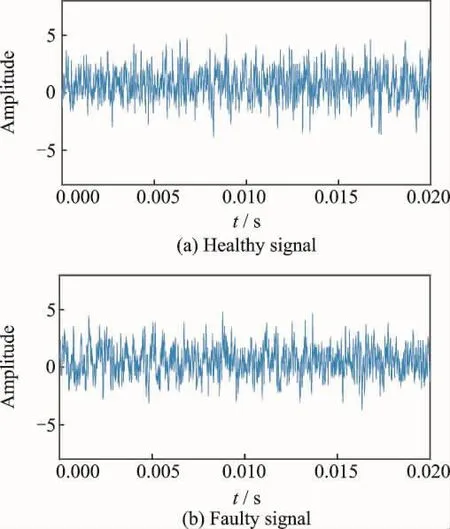
Fig.6 Online gearbox vibration signals
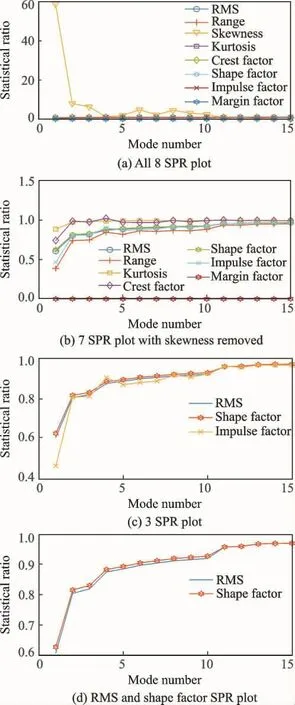
Fig.7 SPR plot for the healthy signals

Fig.8 SPR plot for faulty signal
Fig.7(a)and Fig.8(b)show all eight SPR plots for the signals.The skewness and margin factor plots have been removed as it does not show a good relation between sum of VMFs and input signals.Hence there are a further six SPR plots that need to be considered.After looking in detail at the six SPR plots,only three,which are RMS,shape factor and impulse factor,can be used based on their consistencies and adequate visualization.Finally,we decided to use only RMS and shape factor and removed impulse factor to avoid confusion during the selection process.In addition,RMS and shape factor provide very good visualization for selecting the mode number.The final SPR plots are shown in Fig.7 (d)and Fig.8(d).However,these steps may need to be repeated when new sets of signals are used because this may produce a different SPR plot,thus resulting in yet another SPR plot that is suitable for use.For this study RMS and shape factor will be used.
To select the mode number,the first point at which the plot starts to become steady,and the RMS and shape factor become similar in value is selected as the mode number for the corresponding signals.This is based on the similarities concept between the sum of VMFs and the input signals,at which particular point the value will become either one or close to one.The similarities concept basically defines when the VMD method decomposes a signal into sets of VMFs and the combination of VMFs produces a signal which is similar to the input signals.Therefore,the healthy and faulty signals shown in Fig.6will have 11modes and 12modes,respectively,as shown in Fig.7 (d)and Fig.8 (d).Fig.9shows an extra example of healthy and faulty signals.The selected mode number for the healthy signal is 9 while for the faulty signal it is 10.

Fig.9 Example of another online gearbox signals
3 Rotating Machinery Monitoring
To further validate the performance of the proposed selection method,a comparison between SPR and traditional peak searching method(PSM)has been presented.As mentioned earlier,the gearbox vibration signals used in this paper have been downloaded from Acoustic and Vibration database provided by Bechhoefer[31].The PSM method is a basic traditional method used to determine the mode number for the signals which had been used in the early implementation of VMD in rotating machinery applications[28,32].In this method,the number of dominant frequencies in the frequency spectrum is used as the number of modes for the VMD method.Basically,the dominant frequency corresponds to the gear mesh frequency(GMF)for gear applications and the inner and outer race fault frequency,and the ball pass frequency and the ball spin frequency for bearing applications.Recently,an advanced PSM has been proposed by Li et al.[27]using LOWESS,in which the number of modes are determined based on the number of peaks on the envelope spectrum.For comparison,the PSM used is the traditional PSM method using the frequency spectrum.
Based on Fig.10,the number of peaks for the healthy signals is three,while for the faulty signals it is four.The number of peaks depends upon the dominant frequency on the spectrum.
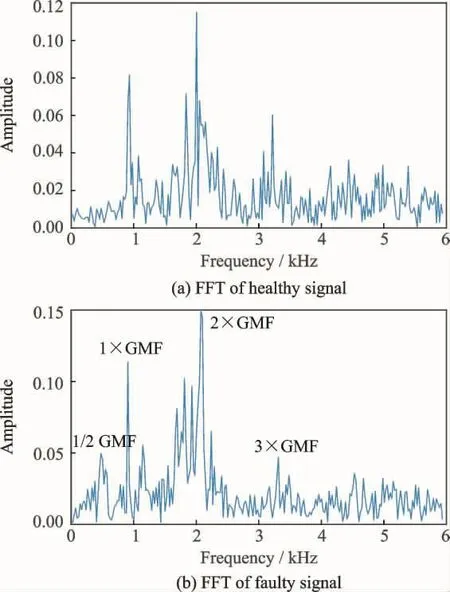
Fig.10 Frequency spectrum of gearbox signals
For a healthy spectrum,the dominant consists of 1×GMF,2×GMF and 3×GMF.For a faulty signal,the dominant consists of previous GMF frequencies with the addition of a sub-harmonic occurring at 500Hz.Hence,the PSM approach gives the number of mode for the healthy signals as three and for the faulty signals it is four.In the comparison,the mode number for the healthy signals will be set to three,and for faulty signals it will be set to four.Fig.11summarizes the comparison between the PSM approach and the proposed selection method based on SPR.The results are shown in Table 2.The performance was calculated based on Eq.(19)
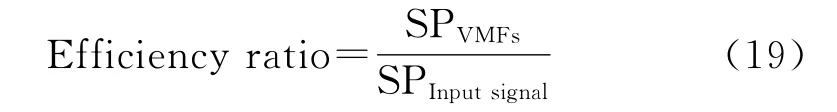
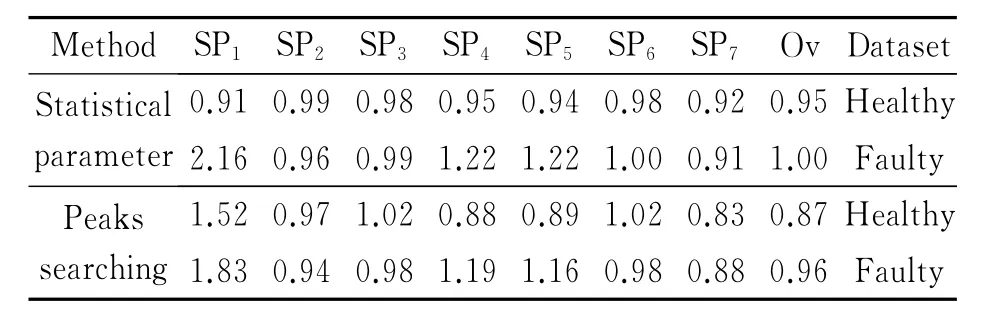
Table 2 Performance of the proposed mode determination method using statistical parameter ratio
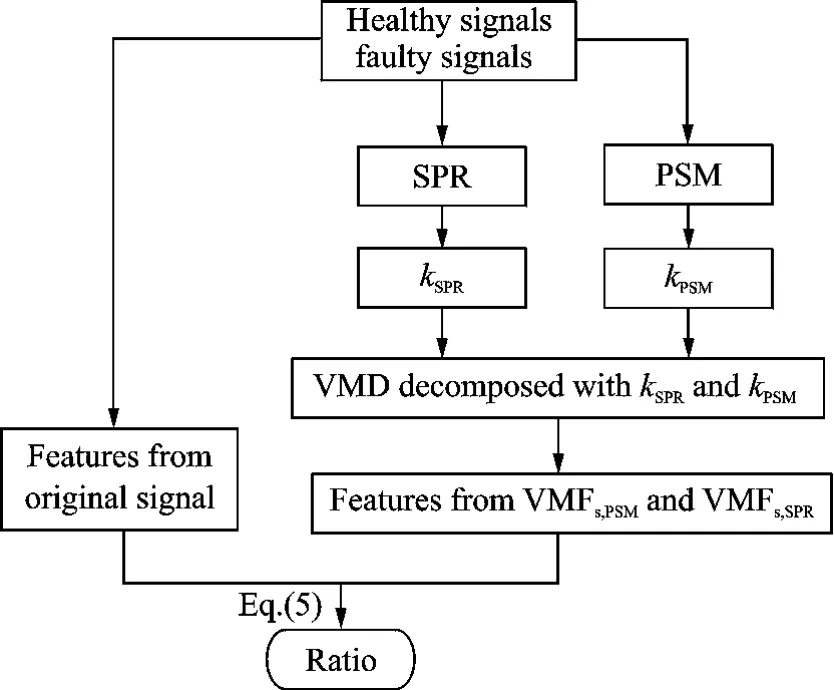
Fig.11 Summary of the comparison
Based on Table 2,SP1is defined as the skewness,SP2as the kurtosis and SP3is defined as the crest factor;while SP4is defined as the shape factor,SP5as the impulse factor;SP6as the margin factor,SP7as the range;while Ov is the overall performance.The result,shown in Table 2,indicates that the proposed selection method using SPR provides a more accurate mode number than the traditional method.When the VMD method decomposes a signal into accurate sets of VMFs,the accuracy of the VMF characteristics,together with the input signal features,will have a high efficiency ratio value.The selection method using SPR recorded 0.956 0for the healthy signal and 1.001 3for the faulty signal,which outperforms the PSM method that recorded 0.872 1for the healthy signal and 0.961 7for the faulty signal.
通过用主成份Z1和Z2替换5个温度增量t1~t5,可以将5维的热误差模型简化为2维模型。使用式(9)和式(10),49段温度变量在第1和第2个主成份上的投影Zt1和Zt2分别如下所示:
To assess the condition of the gear,two machine learning algorithms have been used,which are ELM and ANN.Both healthy and faulty gear vibration signals have been used for experimental simulation in this paper.The type of fault in the gear systems is a wear fault,and is shown in Fig.12.The healthy and the faulty vibration signals have been divided into 120sample signals:60 samples for healthy and 60for faulty.Each signal sample will be decomposed by using the VMD method into sets of VMFs.The proposed method of determination using a statistical parameter ratio has also been used to determine the number of modes for each sample of healthy and faulty signals.The statistical parameter listed in Table 1,has,as distinct from the RMS,been used as input features for both ELM and ANN.The number of modes for each sample of the healthy and faulty signals has also been used as input features.Thus,there are eight features that have been used with two output targets,healthy and faulty.The detailed-on training and testing sample used for both ELM and ANN is summarized in Table 3.

Fig.12 Wear on gear system[31]
The input features summarized in Table 3 have been fed into ELM and ANN algorithms.The basic ELM algorithm used with the ELM type is set to a multi-classification and radial basis function,and has been used as an activation func-tion.For ANN,the basic ANN tools in MATLAB have been used with the default setting.The number of neurons has been set to eight for the ANN algorithm.To show the distinction and superiority of the mode determination method using a statistical parameter ratio,as well as the VMD method of gear fault diagnosis and classification,some comparisons have been made.As shown in Table 2,the data has been recorded into three different sets,totaling 360samples.Set 1represents the statistical features sample from the reconstructed VMD signal.The first and second modes have mainly been used for signal reconstruction of the VMD.This is due to the frequency characteristic of each VMF.Here,the interest frequency is within the 1×GMF,2×GMF and 3×GMF,which has been covered by the first and second modes of the VMD decomposition result.Both the healthy and faulty signals show similar VMF frequency characteristics,which ensures that the first and second modes are used for both healthy and faulty signals in this paper.Set 2represents the statistical features sample from the original signal without any decomposition method and Set 3represents the statistical features from the reconstructed EMD signal.A cross-correlation coefficient has been used to select the most significant IMFs.The first four highest cross-correlation coefficients have been used for the signal reconstruction of EMD.
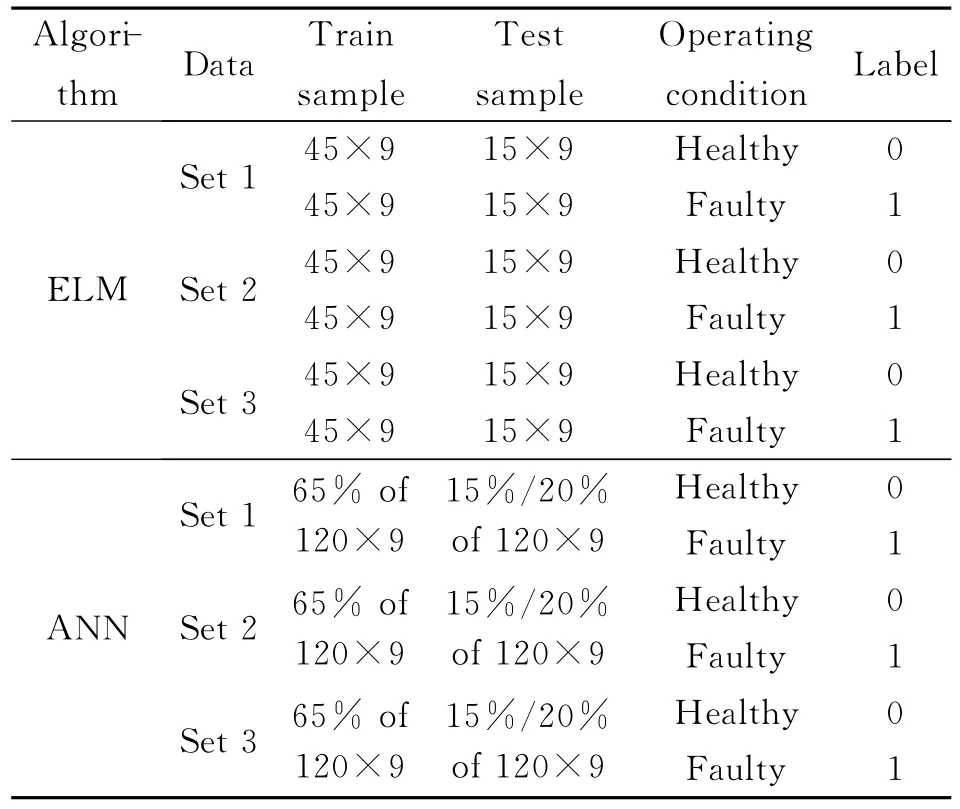
Table 3 Training samples and testing samples details for ANN and ELM
The three data sets have been used to compare the two different machine learning algorithms.For ELM,the sample was normalized as required by the algorithm.The overall performance of these three datasets is described in Table 4for ELM,and in Table 5for ANN.Set 1defines VMD-ELM and VMD-ANN,set 2defines Signal-ELM and Signal-ANN,while set 3defines EMDELM and EMD-ANN.In Table 4,A is defined as an average accuracy of between 1to 200neurons.B is defined as the average when the neurons are set to eight(to run 30times with the neurons set to eight in order to avoid the tweak problem)and C is the accuracy value when the neurons are eight.By default,aparticular number of neurons is equal to the number of features.

Table 4 Overall performance of datasets using ELM algorithm %

Table 5 Overall performance of datasets using ANN algorithm %
For all the data sets,VMD-ELM and VMDANN provide better classification accuracy(90.32%and 95.80%)when compared with Signal-ELM,Signal-ANN,EMD-ELM and EMDANN.This shows that the statistical parameter characteristics extracted from the reconstructed VMD signal are more accurate compared with those characteristics extracted from the original signals and the reconstructed EMD signal.It can be thus concluded that the decomposed signal using the VMD method helps to reduce signal noise and complexity without eliminating the use-ful information within the signal.Accurate parameters and the number of modes set for the VMD method are pivotal for ensuring the performance of the VMD method and for avoiding any elimination of the useful information following the decomposing process,thus reducing the accuracy of the VMD method in fault classification.Figs.13,14also show the performance of datasets with the ELM algorithm in terms of a different number of neurons,which in turn shows that the VMD-ELM outperforms the Signal-ELM and EMD-ELM.

Fig.13 Testing accuracy for datasets with different number of neurons
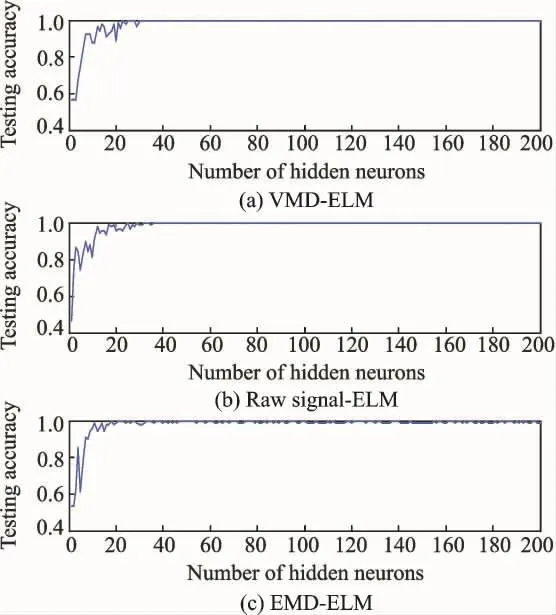
Fig.14 Training accuracy for datasets with different number of neurons
Tables 6—8show the confusion matrix for the ANN algorithm.Therefore,VMD with an accurate initial mode will provide better diagnosis and classification of gear applications.It thus offers better and more reliable machine condition monitoring for gear applications.
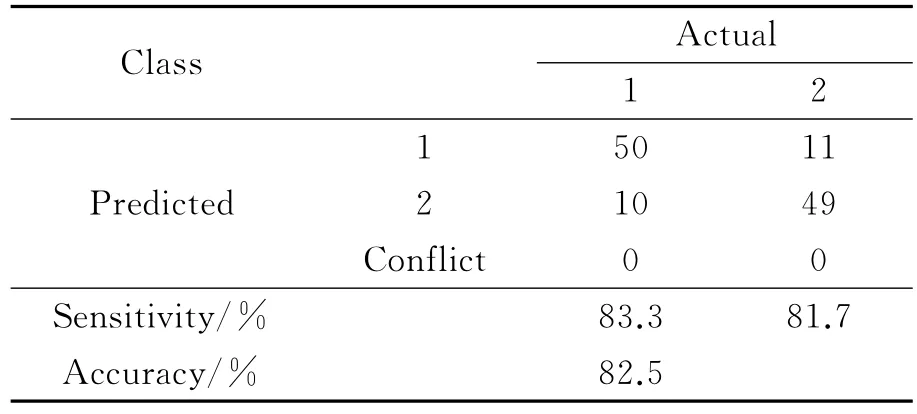
Table 6 Confusion matrix for EMD-ANN
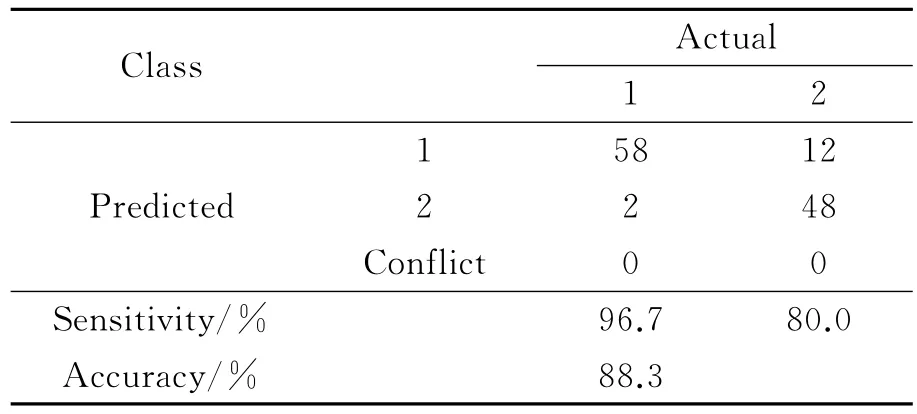
Table 7 Confusion matrix for Signal-ANN
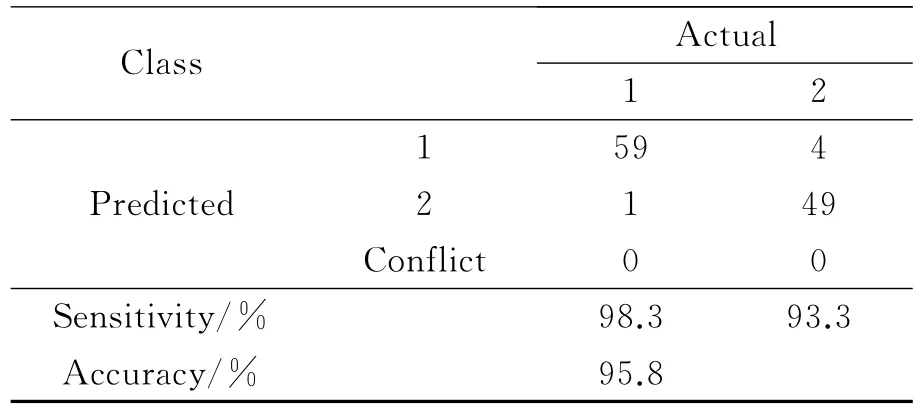
Table 8 Confusion matrix for VMD-ANN
4 Conclusions
Acknowledgements
The authors would like to extend their greatest gratitude to the Institute of Noise and Vibration UTM for funding the study under the Higher Institution Centre of Excellence(HICoE)Grant Scheme (No.R.K130000.7809.4J226).Additional funding for this research also comes from the UTM Research University Grant (No.Q.K130000.2543.11H36),and Fundamental Research Grant Scheme(No.R.K130000.7840.4F653)by the Ministry of Higher Education Malaysia.
[1] HUI K H,HEE L M,LEONG M S,et al.Vibration condition monitoring:latest trend and review[J].Appl Mech Mater.Trans Tech Publications,2015,773/774:139-143.
[2] LEI Y,LIN J,ZUO M J,et al.Condition monitoring and fault diagnosis of planetary gearboxes:A review[J].Meas J Int Meas Confed,2014,48:292-305.
[3] HUANG N,SHEN Z,LONG S,et al.The empirical mode decomposition and the Hilbert spectrum for nonlinear and non-stationary time series analysis[J].Proc R Soc A Math Phys Eng Sci,1998,454:995,903.
[4] LI Y,XU M,WEI Y,et al.An improvement EMD method based on the optimized rational Hermite interpolation approach and its application to gear fault diagnosis[J].Meas J Int Meas Confed,2015,63:330-345.
[5] YEH J R,SHIEH J S.Complementary ensemble empirical mode decomposition:A novel enhanced data analysis method[J].Adv Adapt Data Anal,2010,2:135-156.
[6] SINGH D S,ZHAO Q.Pseudo-fault signal assisted EMD for fault detection and isolation in rotating machines[J].Mech Syst Signal Process,2016,81:202-218.
[7] SHEN Z,CHEN X,ZHANG X,et al.A novel intelligent gear fault diagnosis model based on EMD and multi-class TSVM[J].Meas J Int Meas Confed,2012,45:30-40.
[8] YU Y,YU Dejie,CHEN Junsheng.A roller bearing fault diagnosis method based on EMD energy entropy and ANN[J].J Sound Vib,2006,294:269-277.
[9] ASR M Y,ETTEFAGH M M,HASSANNEJAD R,et al.Diagnosis of combined faults in rotary machinery by non-naive Bayesian approach[J].Mech Syst Signal Process,2017,85:56-70.
[10]CHENG G,CHENG Y L,SHEN L H,et al.Gear fault identification based on Hilbert-Huang transform and SOM neural network[J].Meas J Int Meas Confed,2013,46:1137-1146.
[11]BENKEDJOUH T,RECHAK S.Intelligent prognostics based on empirical mode decomposition and extreme learning machine[C]∥Model Identif Control(ICMIC),2016 8th Int Conf.[S.l.]:[s.n.],2016,943-947.
[12]YANG Y,PAN H,MA L,et al.A roller bearing fault diagnosis method based on the improved ITD and RRVPMCD[J].Measurement,2014,55:255-264.
[13]FENG Z,MA H,ZUO M J.Vibration signal models for fault diagnosis of planet bearings[J].J Sound Vib,2016,370:372-393.
[14]HUANG N E,WU Z.Ensemble empirical mode decomposition:A noise-assisted data analysis method[J].Adv Adapt Data Anal,2009,1:1.
[15]ZHENG J,CHENG J,YANG Y.Partly ensemble empirical mode decomposition:An improved noiseassisted method for eliminating mode mixing[J].Signal Processing,2014,96:362-374.
[16]SMITH J S.The local mean decomposition and its application to EEG perception data[J].J R Soc Interface,2005,2:443-454.
[17]YANG D,LIU Y,LI S,et al.Gear fault diagnosis based on support vector machine optimized by artificial bee colony algorithm[J].Mech Mach Theory,2015,90:219-229.
[18]LEI Y,HE Z,ZI Y.EEMD method and WNN for fault diagnosis of locomotive roller bearings[J].Expert Syst Appl,2011,38:7334-7341.
[19]ZHANG X,ZHOU J.Multi-fault diagnosis for rolling element bearings based on ensemble empirical mode decomposition and optimized support vector machines[J].Mech Syst Signal Process,2013,41:127-140.
[20]CHENG X,LI G,LI H.Research of planetary gear fault diagnosis based on multi-scale fractal box dimension of CEEMD and ELM[J].2017,63:45-55.
[21]LI X,DING F.Application of CEEMD-SVM in rolling bearing fault recognition[C]∥ 6th Int Conf Mechatronics.[S.l.]:Atlantis Press,2016,130:1497-1501.
[22]LI Z,WAN Z,XIONG X,et al.The application of LMD and BP neural network in gear fault diagnosis[J].[S.l.]:IEEE,2013:4609-4612.
[23]ZHANG J,MA W,LIN J,et al.Fault diagnosis approach for rotating machinery based on dynamic model and computational intelligence[J].Measurement,2015,59:73-87.
[24]ZHENG J.Rolling bearing fault diagnosis based on partially ensemble empirical mode decomposition and variable predictive model-based class discrimination[J].Arch Civ Mech Eng.Politechnika Wroc awska,2016,16:784-794.
[25]WEI Y,XU M,LI Y.A new gear fault diagnosis method based on improved local mean decomposition[M].Atl Press,2016,180:180-183.
[26]DRAGOMIRETSKIY K, ZOSSO D. Variational mode decomposition[J].IEEE Trans Signal Process,2014,62:531-544.
[27]LI Z,CHEN J,ZI Y,et al.Independence-oriented VMD to identify fault feature for wheel set bearing fault diagnosis of high speed locomotive[J].Mech Syst Signal Process,2017,85:512-529.
[28]ZHANG D,FENG Z.Application of variational mode decomposition based demodulation analysis in gearbox fault diagnosis[C]∥Conf Rec-IEEE Instrum Meas Technol Conf.Taipei,China:IEEE,2016.
[29]ZHANG M,JIANG Z,FENG K.Research on variational mode decomposition in rolling bearings fault diagnosis of the multistage centrifugal pump[J].Mech Syst Signal Process,2017,93:460-493.
[30]HUANG G B,ZHU Q Y,SIEW C K.Extreme learning machine:Theory and applications[J].Neurocomputing,2006,70:489-501.
[31]BECHHOEFER E.High speed gear dataset.Acoustics and Vibration Database[EB/OL].http://dataacoustics. com/measurements/gear-faults/gear-1/.[2013-05-18].(2016-10-15).
[32]MOHANTY S,GUPTA K K,RAJU K S.Comparative study between VMD and EMD in bearing fault diagnosis[C]∥Indusirial and Information System(ICIIS),9th International Conference.Gwalior:[s.n.],2014:2164-7011.
猜你喜欢
杂志排行

Transactions of Nanjing University of Aeronautics and Astronautics的其它文章
- Parametric Study of Low Frequency Broadband Rectilinear-to-Rotary Vibrational Energy Harvesting
- Countermeasure Against Regenerative and Forced Chatter of Flexible Workpieces in Milling Processs Using Bi-directional Excitation
- Motion Analysis of Trunk Using Simplified Human Model in Sagittal Plane
- Experiment on a Semi-Active In-Car Crib with Joint Application of Regular and Inverted Pendulum Mechanisms Using Scale Model
- Rotational Motions Excited by Vertical Harmonic Motions
- Improved Methods for In-situ Measurement Railway Noise Barrier Insertion Loss