Phenotypic variation in Phoebe bournei populations preserved in the primary distribution area
2018-03-27YingangLiXinhongLiuJunweiMaXiaomianZhangLianXu
Yingang Li·Xinhong Liu·Junwei Ma·Xiaomian Zhang·Li-an Xu
Introduction
Genetic diversity reveals the richness of intraspeci fic alleles,and is a signi ficant indicator related to resource protection and evaluation.Genetic markers,including phenotypic,cytological, biochemical and molecular markers,serve as the main methods for studying genetic diversity.Phenotypes are the result of the interaction between genetic expression and the biological environment,which is also a genetic representation of biogenetics restricted by environmental conditions.Phenotypic traits provide a comprehensive measurement of a complete genetic system or genotype;the study of phenotypic diversity is a component of the study of genetic diversity.Moreover,the study of phenotypic diversity provides the most traditional and convenient way to analyze genetic diversity through phenotypic traits(Schaal et al.1991).Currently,many scholars are taking advantage of relatively stable phenotypic traits to uncover genetic variation and evaluate the level of genetic diversity,mainly in analysis of crops(Aida et al.2007;Rabara et al.2014),horticultural plants(Garcia et al.2008;Abdeullan and Jana 2008;Marshall et al.2001)and forest species(Boulli et al.2001;Gil et al.2002;Dangasuk and Panetsos 2004;Chisha-Kasumu et al.2009;Garcia et al.2009;Mohamed et al.2009;Peterson et al.2011;Singh and Thapliyal 2012;Sreekanth et al.2014;Singh et al.2015;Xu et al.2016).
Phoebe bournei(Hemsl.)Yang,a member of Lauraceae,is a tall evergreen tree that occurs in tropical and subtropical regions in Fujian,Guangdong,Guangxi,Guizhou,Hubei,Hunan,Jiangxi and Zhejiang Provinces,China.This species thrives in broad-leaved forests in mountains and valleys(Editorial Board of Flora of China,Chinese Academy of Science 1982).P.bournei,a rare and protected plant in China,is listed in Red List of Threatened Species(IUCN 2015).Withstraightgrain, finetexture,distinctfragranceand resistance to cracks,deformation and insect damage,the wood of P.bournei is considered a good material for architectural decoration and furniture.P.bournei is also a rare evergreen ornamental tree species that grows tall and straight.Despite highly economic value and status as a threatened species,little or no research has analyzed the geneticdiversityandgeographicalvariationofP.bourneifor conservation biology.In this preliminary report,ten phenotypictraitsofleavesandseedsweresystematicallymeasured to uncover the degree of phenotypic variation and differentiation at intra-population and inter-population scales within this species.The relationship between phenotypic traits and geographical ecology was analyzed using ten populations in themainregionofitsdistribution,withanaimofprovidinga theoretical and scienti fic foundation for the preservation,properuseandgeneticimprovementofthegeneticresources of P.bournei.
Materials and methods
Sample collection

Fig.1 Distribution of P.bournei populations sampled in this study
Although P.bournei is widely distributed in China and produces valuable timber,it often occurs as single trees or small populations in evergreen forest because exploitation has caused large trees to become rare.Based on germplasm investigations in recent years,we found the main populations of P.bournei are distributed in Fujian and the adjoining Zhejiang and Jiangxi Provinces,China.Therefore,ten well-preserved populations with relatively more individuals were chosen for sample collection from twentyfive populations(Fig.1).Referring to previous research(Blue and Jensen 1988;Nadya et al.2006;Noraini and Cutler 2009;Ariane et al.2012;Verbeeck et al.2014),we chose vegetative and reproductive tissues such as fresh,mature leaves and seeds as subjects to study the genetic variation of phenotypic traits of P.bournei.Leaves and seeds were collected in November and December,2013.Collections were made from a total of 105 individuals in 10 natural populations in Datian(DT),Jiangle(JL),Pingnan(PN),Taining(TN),Yanping(YP),Yong’an(YA),Youxi(YX)and Zhenghe(ZH)in Fujian Province,Songyang(SY)in Zhejiang Province and Wuyuan(WY)in Jiangxi Province.Average or better than average trees in good condition were selected that exhibited good growth and morphological indices.Sampled trees were free from serious damages from insects and pests and were located at least 50 m apart from each other.In principle,sampled individuals from each population represented more than 30 individual plants.In reality,however,the large height of the trees,small quantity of current existing populations,shaded habitats and poor seed bearing rates,made it difficult to conduct sample collection in this study.Therefore,although as many individual trees as possible were required in the collection,the samples gathered from the ten populations were uneven in quantity.Table 1 provides the number of sampled individuals and the geographical and climate factors related to the ten sampled populations.The geographical location and elevation data were collected at the scene of sampling,whereas climate data were gathered from the Encyclopedia of Chinese Counties(Vol.East China,Ministry of Civil Affairs of the People’s Republic of China 1993).
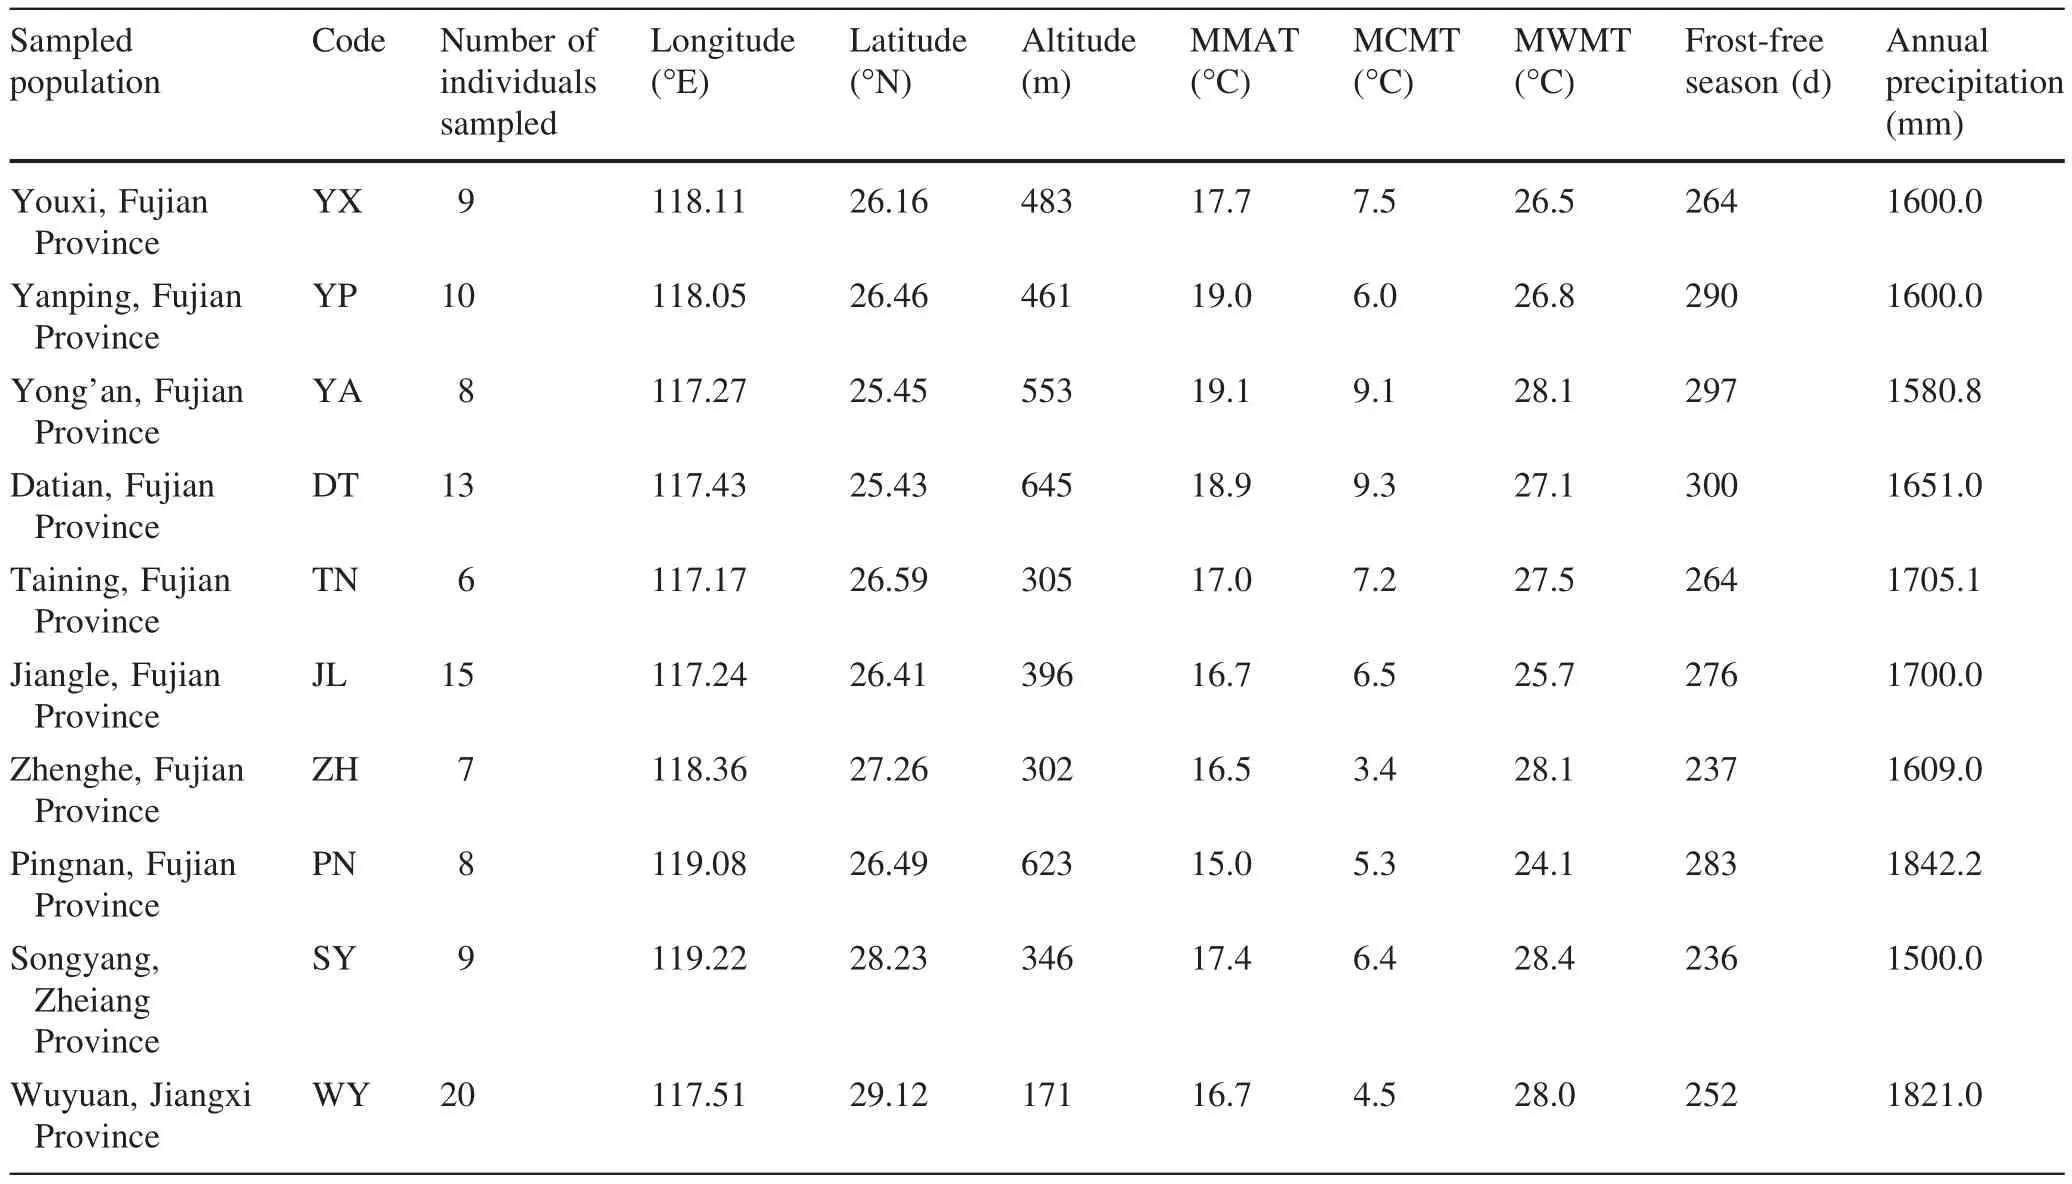
Table 1 Geographical characteristics and main climatic conditions of ten analyzed populations of P.bournei
Measurement of phenotypic traits
Sampling methods for individual trees and measurements of morphological characters were based on previous studies(Hamrick et al.1989;Maley and Parker 1993;Lee et al.1998;Matziris 1998;Panetsos et al.1998).We randomly selected five to ten current year branches from the middle and upper parts of the southfacing crown of the samples and a total of 30 fresh,matureleavesfrom thesebranches.An LI-3000C portable leaf area meter(Li-Cor Biosciences,Lincoln,NE,USA)was used to measure the length,maximum width,mean width and area of each leaf before calculating the ratio of the length to the width.More than 1.5 kg of fresh,fully intact fruit was harvested randomly from each plant and brought to the laboratory prior to analysis.A Vernier caliper was used to measure the length and width of seeds with an accuracy of 0.01 mm and the ratio of the length to the width was calculated as a morphological index.One hundred seeds were randomly selected from each individual plant and weighed with an electronic balance(SL502N,Shanghai minqiao precision scienti fic instruments co.,LTD,China)with a measurement accuracy of 0.01 g before being converted into thousand seed weight.The process was repeated four times.Next,50 mL of water was placed into a graduated 100 mL cylinder and 100 weighed seeds were placed into the cylinder for measuring total volume(A);mean seed volume(mL)was calculated as(A-50 mL)/100.
Statistical analysis
Data related to the length,width,mean width,area and the ratio of the length to the width of the leaves as well as the length,width,the ratio of the length to the width,the thousand seed weight and volume of the seed were subjected to analysis using nested analysis of variance and variance analysis.The linear mode of the nested analysis of variance is yijk= μ + αI+ βj(i)+ εijk,i=1,2,… ,a;j=1,2,…,b;k=1,2,…,n;where μ is the general average value;αiis the effect size of the ith population;βj(i)is the jth individual effect size of the ith population and εijkis the error of the ijkth observed value.The above mode can be used to analyze the characteristics of phenotypic variation within population.To correspond to the coef ficient of gene differentiationwas de fined as the coef ficient of phenotypic differentiation whereis the inter-population variance andis the intra-population variance(Ge et al.1988).Vstwas used to describe the proportion of the average inter-population variance in the general intra-population variance to illustrate the contribution of phenotypic variation to populations.
Analysis of phenotypic variations was based on the ten character measurements related to leaves and seeds.Variations among and within populations were analyzed using one-way ANOVA.Correlation between pairs of phenotypic characters and between characters and geography,climate characteristics were evaluated using Pearson’s correlation coef ficient.Principal components analysis(PCA)was applied to evaluate the underlying dimensionality of the variables,and conducted on the individual-tree mean for each trait.Clustering analysis among populations of P.bournei was performed using the Ward method in R,and the Euclidean distance among populations were calculated from z-cores.The average values of each phenotypic trait were used for cluster analysis.ANOVA,Correlation and PCA were conducted using SAS for Windows(version 9.3,SAS Institute Inc.,Cary,NC,USA).Bootstrap evaluation of cluster was performed in R with the fpc package to judge stability of cluster results.
Results
Phenotypic variation
Highly signi ficant differences among and within populations were found based on the F value(p<0.01,Table 2),which revealed broad intra-population and inter-population variation of the phenotypic traits of P.bournei.The results of the average value,standard deviation and multiple comparisons of phenotypic traits(Table 3)showed that theSY population had the largest leaf length,followed by the YX,ZH,YP and YA populations in descending order.The SY and PN populations had the largest leaf width and mean leaf width whereas YA and ZH had the smallest.The SY population had the largest length–width ratio,whereas the PN and YA populations had the smallest.The YX population had the largest seed length,seed width,seed volume,thousand seed weight and the smallest length–width ratio.The ZH population had the largest seed length–width ratio.Seed length of ZH,seed width of JL and thousand seed weight of PN were similar to values from YX,which remained relatively high.WY ranked last among the ten populations in seed length,seed width and seed volume.

Table 2 Variance analysis of phenotypic leaf and seed characteristics among and within populations of P.bournei
Differentiation among populations
The average percentages of variance components of the ten phenotypic traits in inter-and intra-population measurements and random error were 34.92,26.20 and 38.88%,respectively(Table 4).Coef ficients of differentiation in inter-population phenotypic traits ranged from 15.31 to 82.02%.Traits with the largest and second largest coef ficients of differentiation were seed width(82.02%)and length–width ratio of the leaf(69.41%),respectively.Traits with the smallest coef ficient of differentiation were length(15.31%)and area(19.75%).The average phenotypic differentiation coef ficient of seed traits was 66.52%was 41.02%for leaf traits.The average inter-population phenotypic differentiation coef ficient was 53.77%,which suggested that the contribution of inter-population variation to phenotypic diversity of P.bournei was as high as 53.77%whereas the intra-population contribution was 46.23%.As inter-population phenotypic diversity was slightly higher than intra-population phenotypic diversity,inter-population phenotypic diversity was the main source of phenotypic variation.
Characteristics of phenotypic variation
The average coef ficient of variation of ten traits in different individuals was 12.12%,ranging from 6.67 to 24.16%(Table 5).The coef ficient of variation of the length–width ratio(shape index)of leaves was 12.73 and was 7.40%for seeds.The average coef ficient of variation of the five leaf traits was 15.64%and that of the five seed traits was 8.6%(1.82 times less).The coef ficient of variation of the same trait can vary among populations,indicating that environmental heterogeneity causes differences in phenotypic variation.After comparing the average coef ficient of variation of different populations,the SY,JL and YX populations were found to have larger coef ficients of variation(14.41,12.99 and 12.96%,respectively),re flecting the richness of phenotypic variation and higher diversity in those populations.By contrast,the ZH and TN populations had the smallest coef ficients of variation(9.94 and 10.70%,respectively),which re flects their lower genetic diversity.

?
PCA of phenotypic traits
Covariance PCA of ten phenotypic traits showed that the contribution of the first three main PCs was as high as 98.951%,which suggests that nearly all the information in the original factors could be retained(Table 6).The traits contributing the most variation to the first PC,with a contribution rate 57.371%and an eigenvalue of 24.771,were leaf area(0.892),thousand seed weight(-0.352)and leaf length(0.267).The traits contributing the most variation to the second PC,with a contribution rate 38.860%and an eigenvalue of 16.781,were thousand seed weight(0.916)and leaf area(0.351).The trait contributing the most variation to the third PC,with a contribution rate 2.720%and an eigenvalue of 1.175,was leaf length(0.841).Therefore,PCA revealed that the phenotypic diversity of P.bournei mainly arose from leaf area,leaf length and thousand seed weight,further supporting the results of CV analysis of phenotypic traits.
Correlations analysis
Highly signi ficant positive correlations were observed between leaf width and mean leaf width,and between leaf area and leaf length,width and mean width.Signi ficant negative correlations were observed between leaf length–width ratio(shape index)and leaf width and mean width(Table 7).Seed length and width were signi ficantly and highly signi ficantly positively correlated with thousand seed weight,respectively.However,only seed width was highly signi ficantly positively correlated with seed volume.Seed volume was highly signi ficantly positively correlated to thousand seed weight,which indicated that seeds with larger volumes could provide room for inclusions,allowing for an increase in thousand seed weight.Overall,no signi ficant correlation was observed between leaf and seed traits.Importantly,no signi ficantcorrelations were observed between phenotypic traits and geological/ecological factors.
Cluster analysis
Using a hierarchical clustering algorithm(Ward’s method),the ten populations were divided into three clusters(Fig.2).Cluster 1 comprised three populations with higher leaf length and area,of which SY,TN and PN were the top three populations.Populations in Cluster 1 also exhibited higher-than-average thousand seed weight,except SY(20.80)was less than the average(23.05).Cluster 2 consisted of only one population(YX)with the largest thousand seed weight(31.55)but lower leaf length and area.Cluster 3 contained six populations(YP,YA,DT,JL,ZH and WY)with leaf area and thousand seed weight less than the average(21.75 and 23.05)except for JL.Leaf length of six populations in cluster 3 was close to the average(10.65).Bootstrap evaluation showed that the cluster of populations with high leaf length,leaf area and thousand seed weight(cluster 1)is highly stable(cluster stability=0.86).Cluster 3 is also relatively stable(cluster stability=0.76).Cluster 2(cluster stability=0.65)has the characteristics of a so-called ‘other’cluster.Cluster results did not follow a clear geographical pattern among populations.This result demonstrated that in addition to geographical distance, differences in status and environmental factors of populations also in fluenced the genetic relationship among populations.
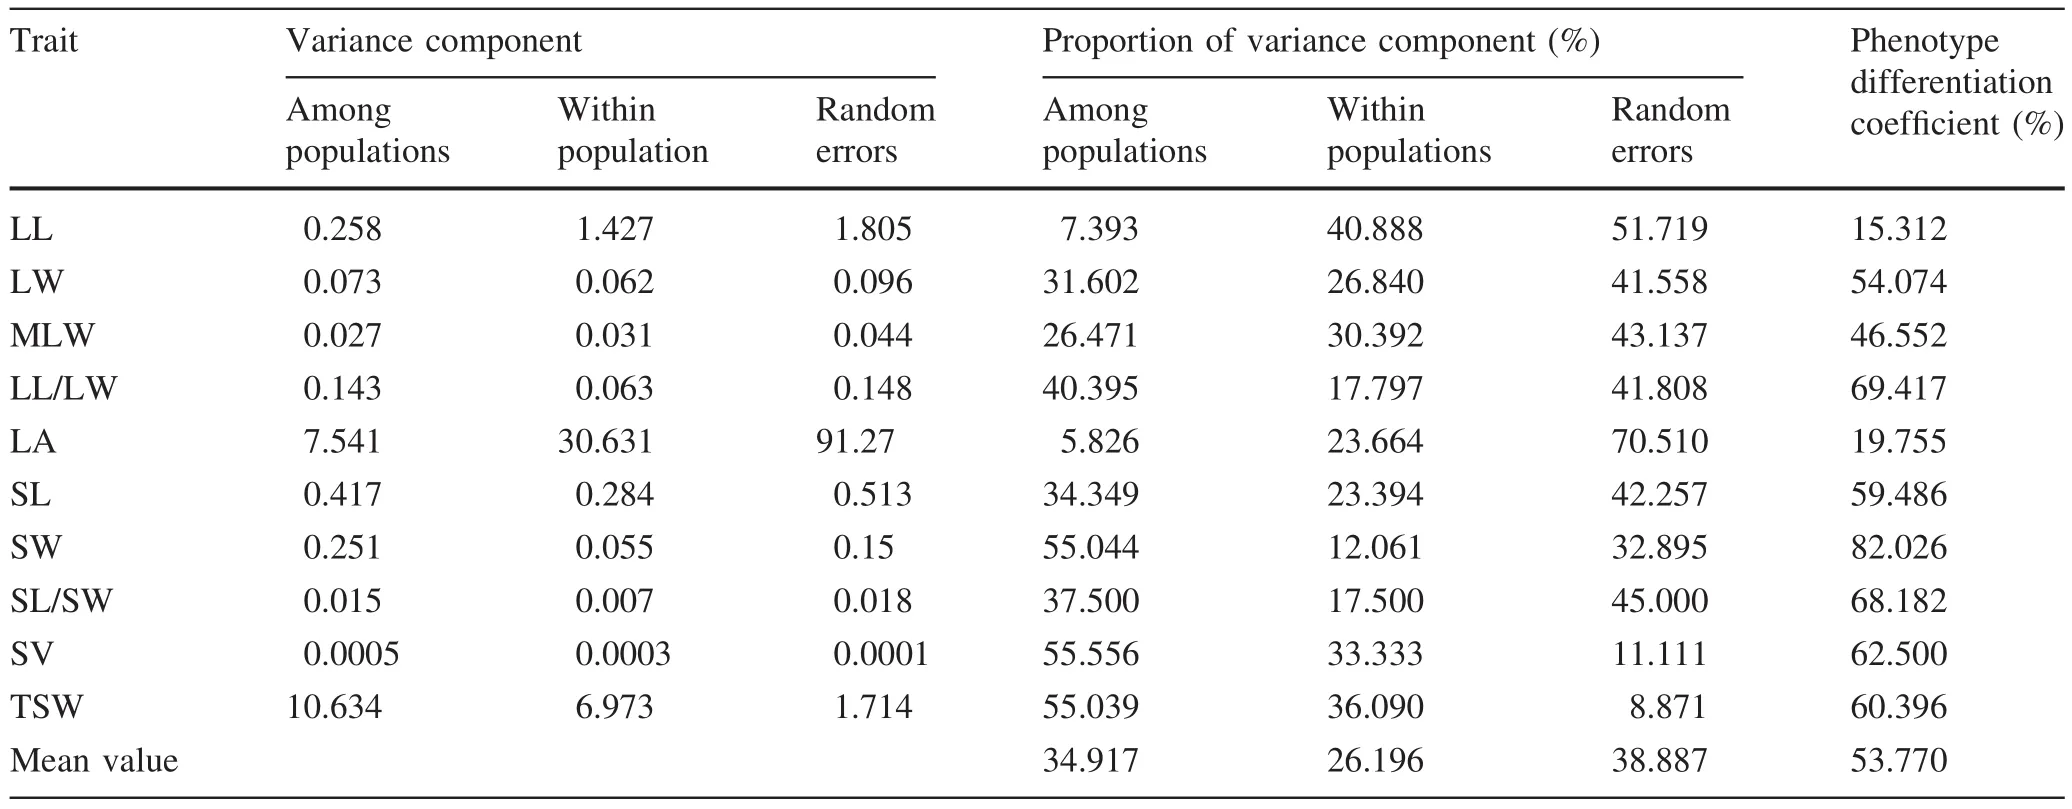
Table 4 Variance component and phenotypic differentiation coef ficient among populations of P.bournei
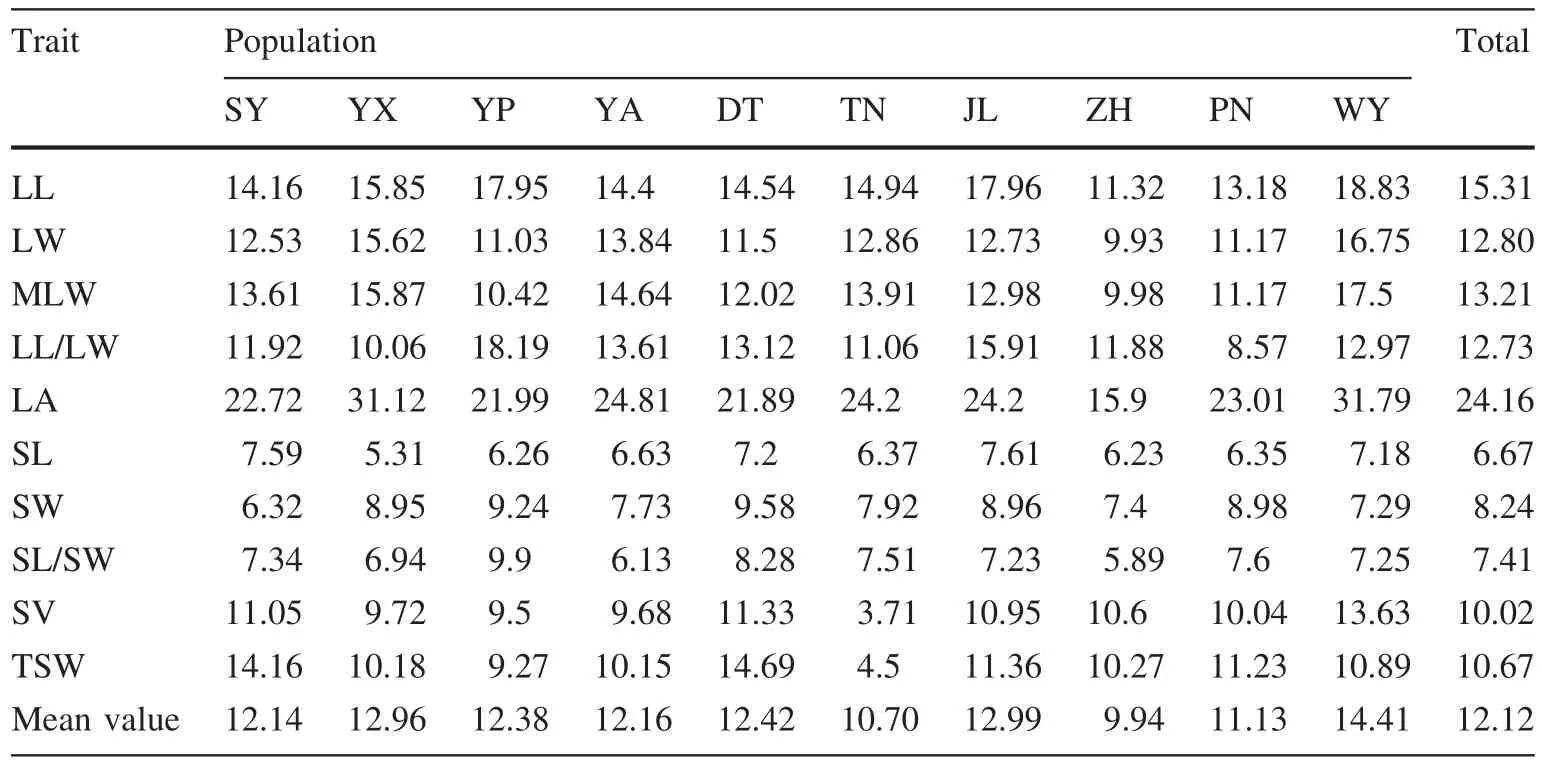
Table 5 Coef ficients of variation of phenotypic traits in populations of P.bournei
Discussion
The analysis of ten phenotypic traits from ten populations in the primary distribution area of P.bournei,including leaf length,leaf width,average leaf width,leaf length–width ratio,leaf area,seed length,seed width,seed length–width ratio,seed volume and thousand seed weight,indicated that extremely distinct inter-and intra-population differences existbetweenphenotypictraits.Thisresultisconsistentwith the results of other trees species in China,such as Acermono Maxim.(42.61%)(Ji et al.2012)and Cyclocarya paliurus(Batal.)Iljinsk.(She et al.2009).The observations in thepresent study were caused by the combined effects of inheritance and environment.The average inter-population phenotypic deviation revealed that the amplitude of differentiation of the coef ficients representing the ten phenotypic traits ranged from 15.31 to 82.02%,with a mean differentiation coef ficient of 53.77%.Inter-population phenotypic diversity was slightly higher than intra-population phenotypic diversity,indicating that the former is the main source of phenotypic deviation of P.bournei.
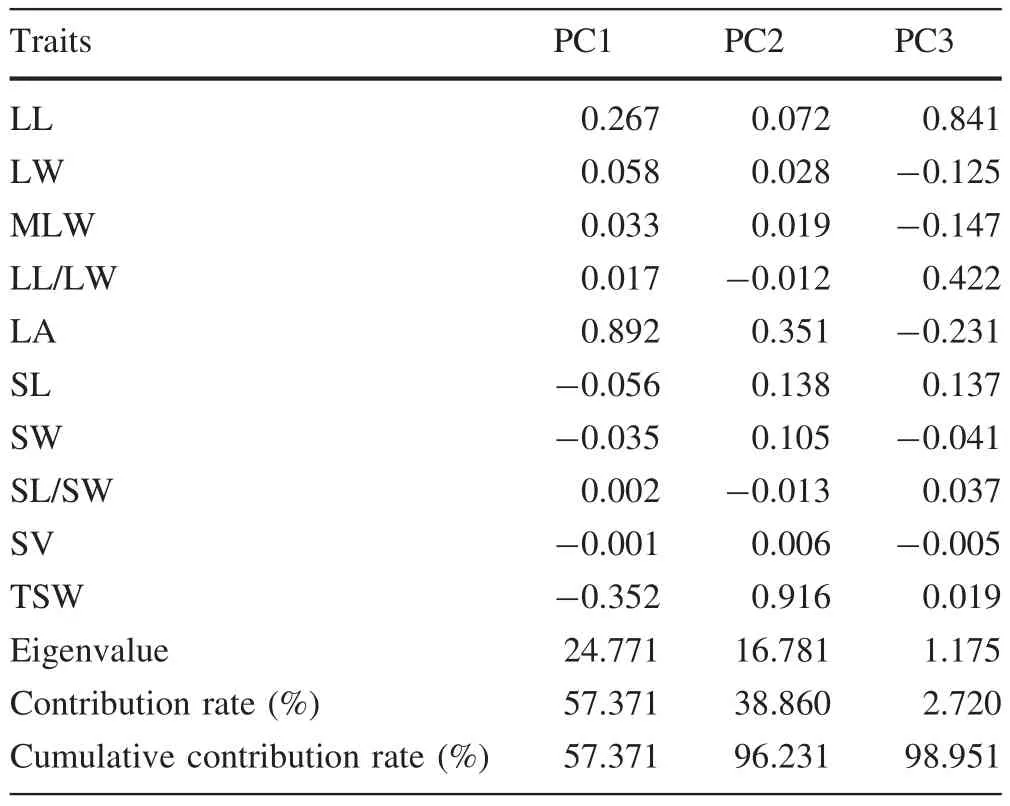
Table 6 Factor loadings,eigenvalue,contribution rate and cumulative contribution rate of the first three principal components(PCs)
The phenotypic differentiation coef ficientofP.bournei was higher than that of some coniferous trees in China,such as Pinus densata Mast.(28.77%;Mao et al.2007)and Picea likiangensis var.balfouriana(Rehd.et Wils.)Hillier ex Slsvin(36.53%;Gu et al.2009).However,the phenotypic differentiation coef ficient was close to that of broad-leaved trees,such as A.mono(42.61%;Ji et al.2012)and Quercus mongolica Fisch ex Ledeb(56.09%;Li and Gu 2005).The breeding system is the most important factor that in fluences the genetic structure of populations,especially as it relates to the mating system and gene flow(Hamrick and Godt 1990).Coniferous trees are mostly wind and cross-pollination species whose pollens have long distance transmission and strong pollinating ability.Pollen immigration from exterior and distant environments reduces inter-population differences.Their seeds are small in size and could be carried long distances so that spread and diffusion of seeds is possible,allowing for genetic communication.The flowers of P.bournei are insect pollinated,meaning that pollen travels far shorter distances than that of wind pollinated plants.Hence,inter-population pollen communication is limited.P.bournei is a Category II State Protection Rare Plant,mostly distributed in remote mountains,nature reserves and other areas dif ficult to access.The ten populations in this study were located at distances of tens to hundreds of kilometers apart.This distance,along with heavy seeds makes inter-population genetic differentiation possible.The preferred habitats of P.bournei include valleys and streamside with insuf ficient sunshine,resulting in limited seed production.The dif ficulty in inter-population communication is further intensi fied by a shortage of seeds.Although seeds of P.bournei could be transmitted via birds,they dry and crack easily,causing a loss of viability.This loss leads to low germination rates in open field conditions.Limited seed production and low germination rates both accelerate genetic deviation among P.bournei populations.
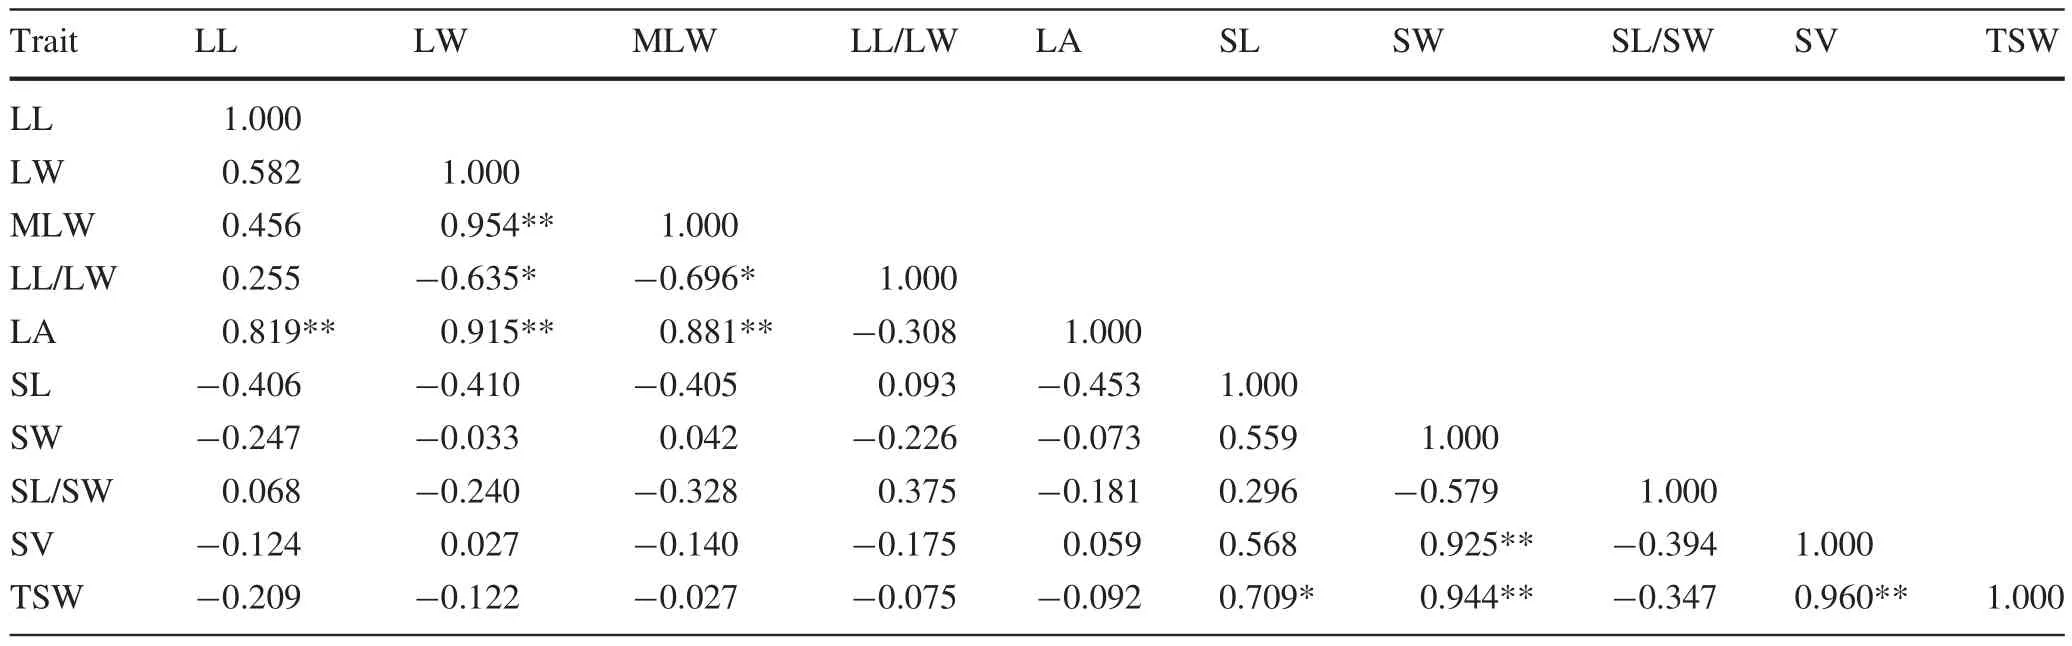
Table 7 Pearson coef ficients of correlation between morphological characters determined for leaves and seeds of populations of P.bournei
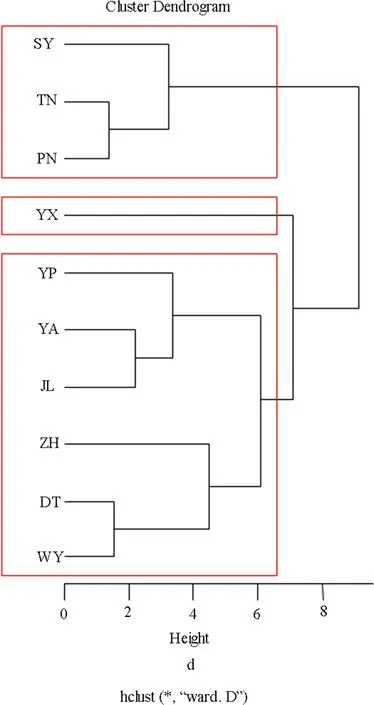
Fig.2 Cluster dendrogram the ten phenotype traits in R with the fpc package
The coef ficient of variation can measure the degree of dispersion of observed values.The greater the coef ficient of variation,the higher the degree of dispersion of observed values and the richer the phenotypic diversity.As noted,the average coef ficient of variation of leaf phenotypic traits was 1.82 times greater than in seed traits.The coef ficient of variation of the length–width ratio of leaves was 1.72 times greater than that of seeds.This indicates that the seeds of P.bournei have greater genetic stability than leaves.The WY,JL and YX populations possessed higher coef ficients of variation and genetic diversity,whereas the ZH and TN populations ranked at the bottom of these measurements.Aside from the different variations in genetic richness of individual populations,the uneven sample quantities of populations in this study may have also played a role in the differences of coef ficient of variation.The sample quantities of WY,JL and YX were 20,15 and 7,respectively,whereas that of ZH and TN were only 7 and 6.
Analysis of the CV of ten phenotypic traits showed that the range of variation for leaf area and leaf length were larger than that of other leaf traits,and that the range of variation range of thousand seed weight was the largest among seed traits.These three traits may contain most of the phenotypic variation in P.bournei.PCA of the ten phenotypic traits also indicated that phenotypic diversity was mainly derived from these three traits.Thus,we can infer that leaf area,leaf length and thousand seed weight are most dominant for controlling the direction of phenotypic variation and will make future study of the phenotypic variation of P.bournei more convenient.
No distinct correlation was observed between phenotypic traits of P.bournei and geological/ecological factors,likely because the climatic zones of the ten populations studied here were very similar.In general,P.bournei is a tropical and subtropical species.According to the new plan of climate zone division in China(Zheng et al.2010),P.bournei occurs in the following four climate zones:(1)mid-subtropical areas including mountainous regions in the southern part of the Yangtze River,(2)the western part of Hunan and Hubei Provinces,(3)the Plateau of Guizhou Province and(4)the southern subtropical areas including lower mountains and plains in Fujian,Guangdong and Guangxi Provinces.This study focused on populations in the mountainous areas from the southern part of Yangtze River with similar temperature,frost-free period and annual precipitation.This study was located at 25.43°–29.12°N,117.17°–119.22°E in an area with elevations ranging from 171 to 645 m.The comparatively minor environmental and climatic differences among the sites of the ten populations resulted in as light correlation between phenotypic traits and climatic factors.By comparison,the correlations between geological/ecological factors and phenotypic traits of C.paliurus(She et al.2009)and Q.mongolica(Li and Gu 2005),as those sample populations were located in areas with larger differences in climate zones and higher spatial heterogeneity.
The wood known as ‘Gold Phoebe’mainly comes from several Phoebe species,including P.bournei,Phoebe sheareri(Hemsl.)Gamble,Phoebe zhennan S.Lee,Phoebe chekiangensis C.B.Shang and Phoebe lichuanensis S.Lee.Two of these,P.zhennan and P.chekiangensis are unique to Southwest and East China,respectively.The extremely small population of P.lichuanensis occurs only in a small site called Lichuan,a county in western Hubei Province.Aside from P.sheareri,P.bournei has the widest natural distribution among the ‘Gold Phoebe’species,but its quantity and quality indices are to some extent better than those of P.sheareri.For example,P.bournei typically has a straighter stem,greater height under branch and faster growth,which make it an ideal tree used for developing high-value timber forests in subtropical areas.Currently,most P.bournei exist in the form of small populations in nature reserves,or as trees preserved for good luck or as ancient tree populations around villages and temples.Fragmentation of the current resources is a serious problem and the number of individuals continues to decline.As a result,the following suggestions are proposed for the protection and rational exploitation of P.bournei.First,the protection of existing resources should be strengthened and appropriate arti ficial intervention should be implemented to protect this species.A good growth environment should be created to promote natural regeneration of seedlings and young individuals.Second,an analysis of the genetic structure and the mechanism underlying endangerment of the species should be conducted to determine the most important areas to be protected followed by the development of protection strategy.Third,intra-population phenotypic variation of P.bournei comprises 46.23%of the total variation,which is meaningful for the study of the genetic improvement of the species.Based on the above findings,genetic improvement of P.bournei can take advantage of both the inter-and intra-population variation so that population selection can be combined with trees selection within populations.This approach will facilitate the selection of the best parent plants for seed orchards to meet the demands of seedling for developing arti ficial high-value timber forests while minimizing the damage to current genetic resources.
Abdeullan AJ,Jana LR(2008)Phenotypic divergence and population variation in Cuphea.J Agron 7(1):25–32
Aida A,Hussein M,Mohamad AS,Hani S,Sameer M(2007)Assessment of phenotypic diversity among Jordanian barely landraces(Hortkum vulgare L.).Biotechnology 6(2):232–238
Ariane R,Barbos A,Cecilia F,Fiorini Viviane SP,Renato MS,Eduardo LB(2012)Geographical genetic structure and phenotypic variation in the Vellozia hirsute(Velloziaceae)ochlospecies complex.Am J Bot 99(9):1477–1488
Blue MP,Jensen RJ(1988)Positional and seasonal variation in oak(Quercus:Fagaceae)leaf morphology.Am J Bot 75:939–947
Boulli A,Baaziz M,Mhirit O(2001)Polymorphism of natural populations of Pinus halepensis Mill.in Morocco as revealed by morphological characters.Euphytica 119(3):309–316
Chisha-kasumu E,Woodward S,Price A(2009)Phenotypic variation among five provenances of Pterocarpus angolensis in Zimbabwe and Zambia.South For 71(1):41–47
Dangasuk OG,Panetsos KP(2004)Altitudinal and longitudinal variations in Pinus brutia(Ten.)of Ctete Island,Greece:some needle,cone and seed traits under natural habitats.New For 27(3):269–284
Editorial Committee of Flora of China,Chinese Academy of Sciences(1982)Flora of China,vol XXXI.Science Press,Beijing,pp 112
Garcia JQ,Ivancic A,Lebot V(2008)Morphological variation and reproductive characteristicsofwild gianttaro (Alocasia macrorrhizos,Araceae)populations in Vanuatu.N Z J Bot 46(2):189–203
Garcia R,Siepielski AM,Benkman CW(2009)Cone and seed trait variation in white bark pine(Pinus albicaulis;Pinaceae)and the potential for phenotypic selection.Am J Bot 96(5):1050–1054
Ge S,Wang MX,Chen YW(1988)An analysis of population genetic structure of Masson pine by isozyme technique.Sci Silvae Sin 24(4):399–409(In Chinese)
Gil L,Climent J,Nanos N,Mutke S,Ortiz I,Schiller G(2002)Cone morphology variation in Pinus canariensis Sm.Plant Syst Evol 235:35–51
Gu YJ,Luo JX,Wu YW,Cao XJ(2009)Phenotypic diversity in natural populations of Picea balfouriana in Sichuan,China.Chin J Plant Ecol 33(2):291–301(In Chinese)
Hamrick JL,Godt NJW(1990)Allozyme Diversity in Plant Species.In:Brown AHD,Clegg MT,Kahler AL,Weir BS(eds)Plant population genetics,breeding,and genetic resources.Sinauer Association,Sunderland,pp 43–63
Hamrick JL,Blanton HM,Hamrick KJ(1989)Genetic structure of geographically marginal populations of ponderosa pine.Am J Bot 76(11):1559–1568
IUCN(2015)In–situ The IUCN red list of threatened species.http://www.iucnredlist.org
Ji ZF,Gao YH,Li L,Mao SX,Zhao L,Geng QY,Wang YL(2012)Phenotypic diversity of populations of Acer mono in Huoshan Mountain of Shanxi at different altitude.Acta Hortic Sin 39(11):2217–2228(In Chinese)
Lee SW,Choi WY,Norbu L,Pradham R(1998)Genetic diversity and structure of blue pine(Pinus wallichiana Jackson)in Bhutan.For Ecol Manag 105(1):45–53
Li WY,Gu WC(2005)Study on phenotypic diversity of natural population in Quercus mongolica.Sci Silvae Sin 41(1):49–56(In Chinese)
Maley ML,Parker WH(1993)Phenotypic variation in cone and needle characters of Pinus banksiana(jack pine)in northwestern Ontario.Can J Bot 71(1):43–51
Mao JF,Li Y,Liu YJ,Liu H,Wang XR(2007)Cone and seed characteristics of pinus densata and their adaptive fitness implications.Chin J Plant Ecol 31(2):291–299(In Chinese)
Marshall B,Harrison RE,Graham J,Mcnico JW,Wright G,Squire GR(2001)Spatial trends of phenotypic diversity between coloniesofwild raspberry Rubusidaeus.New Phytol 151(3):671–682
Matziris D(1998)Genetic variation in cone and seed characteristics in a clonal seed orchard of Aleppo pine grown in Greece.Silvae Genet 47:37–41
Ministry of Civil Affairs of the People’s Republic of China,Ministry of Development of the People’s Republic of China(1993)Encyclopedia of Chinese Counties,vol East China.China Social Press,Beijing,pp 583,953,957,974,982,1052,1064,1095,1125,1274
Mohamed MS,Mohammed EH,Nadia W,Aziz O,Abdelali B,Abdelmajid H(2009)Fruit and seed diversity of domesticated carob (Ceratonia siliqua L.) in Morocco.SciHortic 123(1):110–116
Nadya W,González-Martínez Santiago C,Ismaı¨l EH,Abdelali B(2006)Variation of morphological traits in natural populations of maritime pine(Pinus pinaster Ait.)in Morocco.Ann For Sci 63(1):83–92
Noraini T,Cutler DF(2009)Leaf anatomical and micromorphologicalcharactersofsomeMalaysian Parashorea (Dipterocarpaceae).J Trop For Sci 21(2):156–167
Panetsos KP,Aravanopoulos FA,Scaltsoyiannes A(1998)Genetic variation of Pinus brutia from Islands of the northeastern Aegean Sea.Silvae Genet 47(2):115–119
Peterson BJ,Graves WR,Sharma J(2011)Phenotypic and genotypic diversity of eastern leatherwood in five populations that span its geographic distribution.Am Midl Nat 165(1):1–21
Rabara RC,Ferrer MC,Diaz CL,Newingham MCV,Romero GO(2014)Phenotypic diversity of farmers’traditional rice varieties in the Philippines.Agronomy 4(2):217–241
Schaal BA,Leverich WJ,Rogstad SH(1991)A comparison of methods for assessing genetic variation in plant conservation biology.In:Falk DA,Holsinger KE (eds)Genetics and conservation of rare plants.Oxford University Press,New York,pp 123–124
She CQ,Yang WX,Fang SZ,Shang XL(2009)Phenotypic diversity of natural Cyclocarya paliurus populations seed traits.Chin J Appl Ecol 20(10):2351–2356(In Chinese)
Singh O,Thapliyal M(2012)Variation in cone and seed characters in blue pine(Pinus wallichiana)across natural distribution in western Himalayas.J For Res 23(2):235–239
Singh O,Bordoloi S,Mahanta N(2015)Variability in cone,seed and seedling characteristics of Pinus kesiya Royle ex Gordon.J For Res 26(2):331–337
Sreekanth PM,Balasundaran M,Nazeem PA(2014)Genetic and morphological variation in natural teak (Tectona grandis)populations of the Western Ghats in Southern India.J For Res 25(4):805–812
Verbeeck H,Betehndoh E,Maes WH,Hubau W,Kearsley E,Buggenhout L,Hufkens K,Huygens D,Acker JV,Beeckman H,MweruJPM Boeckx P,Steppe K(2014)Functional leaf trait diversity of 10 tree species in Congolese secondary tropical forest.J Trop For Sci 26(3):409–419
Xu YL,Woeste K,Cai NH,Kang XY,Li GQ,Chen S,Duan A(2016)Variation in needle and cone traits in natural populations of Pinus yunnanensis.J For Res 27(1):41–49
Zheng JY,Yin YH,Li BY(2010)A new scheme for climate regionalization in China.Acta Geogr Sin 65(1):3–13 (In Chinese)
杂志排行

Journal of Forestry Research的其它文章
- Vascular bundle connection between seed stalk and seed coat of Caragana arborescens
- Effects of continuous nitrogen addition on microbial properties and soil organic matter in a Larix gmelinii plantation in China
- Reconstructing the size of individual trees using log data from cut-to-length harvesters in Pinus radiata plantations:a case study in NSW,Australia
- Effects of soil drought stress on photosynthetic gas exchange traits and chlorophyll fluorescence in Forsythia suspensa
- Flavonoid content and radical scavenging activity in fruits of Chinese dwarf cherry(Cerasus humilis)genotypes
- The selection and stability analysis of stable and high Taxol-producing cell lines from Taxus cuspidata