Detection of Cyanide in Pollution-free Livestock Product Breeding Water by Ion Chromatography
2018-03-21,,
, ,
Supervision, Inspection & Testing Center of Agricultural Products Quality and Safety of Xi’an City, Xi’an 710077, China
1 Introduction
With constant development and progress of science and technology, the living environment of human beings is increasingly damaged, and the most serious pollution is water pollution. Cyanide is a type of highly toxic environmental pollutants containing cyano. Once entering the human body, it will lead to hypoxia of tissues, and lead to suffocation of organism. Besides, molecules of some cyano compounds may directly inhibit the central nervous system. At present, cyanide parameter has become an essential examination item in pollution-free livestock product breeding water and farmland irrigation water.
In existing national standards and industry standards, cyanide detection methods are divided into two categories: one is volumetric titration with the limit of detection of 0.25 mg/L, the other is spectrophotometry (isonicotinic acid pyrazolone spectrophotometry) with the limit of detection of 0.004 mg/L; the isonicotinic acid-barbituric acid spectrophotometry with the limit of detection of 0.001 mg/L; pyridine-barbituric acid with the limit of detection of 0.002 mg/L[1-2]. These two methods have complex analysis procedure. Samples need distillation, the operation safety is poor, it takes long time, and the operation process has many influencing factors[3-4]. As an advanced instrumental analysis method, ion chromatography is simple, rapid, safe, and selective, and has been widely used, but the ion analysis of cyanide is not mature yet. In practical applications, due to influence of separation column and eluent, we evaluated the above factors through experiment, and made a comparison with volumetric titration and isonicotinic acid pyrazolone spectrophotometry, to verify the feasibility of the ion chromatography in the detection of cyanide in the pollution-free livestock product breeding water.
2 Materials and methods
2.1Materials
2.1.1Test samples. There is large difference in the limit of detection between different detection methods. Thus, we selected two representative samples: 17JCS003 (2017 No. 3 water sample) with high concentration of cyanide and 17JCS004 (2017 No. 4 water sample) with low concentration of cyanide as test samples.
2.1.2Reagents. Sodium carbonate, sodium bicarbonate, sodium hydroxide (guaranteed reagent, GR), phthalic acid, sulfamic acid, Disodium ethylenediaminetetraacetate (EDTA-2Na), sodium sulfite, phosphoric acid, anhydrous potassium dihydrogen phosphate, anhydrous disodium hydrogen phosphate, chloramine T, isonicotinic acid, pyrazolone, p-Dimethylaminobenzylidenerhodanine (DMABR), potassium chromate (analytical reagent, AR), and acetone (gas chromatography reagent).
2.1.3Cyanide standard solution. Standard stock solution of cyanide: 50 mg/L standard stock solution (Institute for Environmental Reference Materials of Ministry of Environmental Protection); standard solution of cyanide: 1.00 mg/L standard solution, absorbed 1.00 mL stock solution and added to a 50.00 mL volumetric flask, and ultrapure water was used to fix volume and dilute the solution.
2.1.4Instruments and equipment. Ion chromatography system: Metrohm 861 (manufactured by Metrohm China Limited), column size 2.0 mm × 60.0 mm; particle size: 5.0 μm; flow rate: 0.70 mL/min; pressure 7.5-15.0 MPa; chromatographic column: Metrosep A Supp 5 and Metrosep Anion Dual 1; Milli-Q ultrapure water machine; Sartorius Scientific Instruments (Beijing) Co., Ltd.; all-glass distiller; brown acid burette; spectrophotometer: TU1901 Double Beam UV-Vis Spectrophotometer (produced by Beijing Purkinje General Instrument Co., Ltd.). The glass ware used in the experiment was Grade A.
2.2Methods
2.2.1Selection of anion separation column and eluent. Using anion column Metrosep A Supp 5 and Metrosep Anion Dual 1 manufactured by Metrohm China Limited, we measured the peak area of the same concentration CN-. In the experiment, we set five kinds of eluent: 8 mmoL/L phthalic acid, 2% acetone; 2.4 mmoL/L NaHCO3+2.5 mmoL/L Na2CO3, 2% acetone; 4 mmoL/LNaHCO3+1 mmoL/L NaOH, 2% acetone; 1 mmoL/L NaHCO3+4 mmoL/L NaOH, 2% acetone; 1 mmoL/L NaOH.
2.2.2The linear relationship, detection limit and reproducibility of ion chromatography. First, absorbed 0.50, 1.00, 2.00, 3.00, 4.00, 5.00, 6.00, and 8.00 mL cyanide standard solution and added to 50.00 mL volumetric flask, and fixed the volume with ultrapure water. The concentration of this standard curve was 0.01, 0.02, 0.04, 0.06, 0.08, 0.10, 0.12, and 0.16 mg/L respectively. Then, we carried out repeated detection using 0.020, 0.010, 0.005, and 0.001 mg/L (decreasing concentration) standard solution for 7 times. Next, we conducted repeated detection of standard solution with concentration of 0.02, 0.06, and 0.10 mg/ L for 6 times.
2.2.3Comparison between titration and ion chromatography. We took 10.00 mL standard solution (1 mg/L ) and added into a 50.00 mL volumetric flask, used the test sample 17JCS003 to fix the volume to 50.00 mL, and make into spiked samples. Then, we took the test sample 17JCS003 and conducted repeated measurement for 6 times by ion chromatography and titration.
2.2.4Comparison between isonicotinic acid pyrazolone spectrophotometry and ion chromatography. We took 10.00 mL standard solution (1 mg/L ) and added into a 50.00 mL volumetric flask, used the test sample 17JCS004 to fix the volume to 50.00 mL, and make into spiked samples. Then, we took the test sample 17JCS004 and conducted repeated measurement for 6 times by ion chromatography and isonicotinic acid pyrazolone spectrophotometry.
3 Results and analyses
3.1Detectionresultsofionchromatography
3.1.1Detection results of chromatography and eluent. The results show that the sensitivity of Supp 5 column is higher during determining peak area of the same concentration CN-. Supp 5 column is more suitable for cyanide separation than Anion Dual 1. With the rise of the pH of the eluent, the CN-retention time decreased, while the peak area increased accordingly, 1 mmoL/L NaOH eluent had the best separation effect, 1 mmoL/L NaHCO3+4 mmoL/L NaOH and 2% acetone had basically the same separation effect, but 1 mmoL/L NaOH had great damage to separation column of anion, thus we decided to adopt 1 mmoL/L NaHCO3+4 mmoL/L NaOH and 2% acetone eluent.
3.1.2The linear relationship, detection limit and reproducibility of ion chromatography. Through the determination of the standard sequence, the cyanide concentration and the corresponding peak area showed a linear relationship. The linear regression equation of cyanide ion wasy= 0.090 7x, and the linear correlation coefficient was 0.999 5 with the concentration as the ordinate and the peak area as the abscissa, and unit mg/L. The standard curve was shown in Fig. 1. Using 0.001 mg/L standard solution with concentration of 0.020, 0.010, 0.005 and 0.001 mg/L (decreasing concentration), we made measurement 7 times, the relative standard deviations of peak area was 0.91%, 0.91%, 0.93% and 0.94%, respectively, so the limit of detection was about 0.001 mg/L; in the selected chromatographic conditions, at the signal-to-noise ratio of 3∶1, the calculated detection limit was 0.000 87 mg/L. Then, we measured the standard solution with concentration of 0.02, 0.06, and 0.10 mg/L for 6 times, and the relative standard deviations of peak area was 0.97%, 0.94%, and 0.91% respectively.
3.2SampledetectionresultsoftitrationandionchromatographyWe took test sample 17JCS003 and detected by ion chromatography and titration 6 times, and detection results were listed in Table 1. Through comparison experiment, cyanide in pollution-free livestock product breeding water had lower relative standard deviation by the ion chromatography than the titration, and the recovery rate was higher and detection results had higher accuracy; the limit of detection of titration method was 0.25 mg/L (GB/T5750.5-2006), while the limit of detection of the ion chromatography was 0.001 mg/L.

Fig.1Standardcurveofpeakareaandconcentration
Table1Detectionresultsandrecoveryrateofsamplesbytitrationandionchromatography

SampleCyanideconcentrationinsample(ionchromatography)mg/LCyanideconcentrationinsample(titration)mg/L17JCS003⁃10.3540.34117JCS003⁃20.3560.35217JCS003⁃30.3570.34917JCS003⁃40.3590.36017JCS003⁃50.3510.36117JCS003⁃60.3530.353Averagevalue0.3550.353Relativestandarddeviation∥%0.8102.100Sampleconcentration∥mg/L0.4830.472Recoveryrate∥%99.50094.800
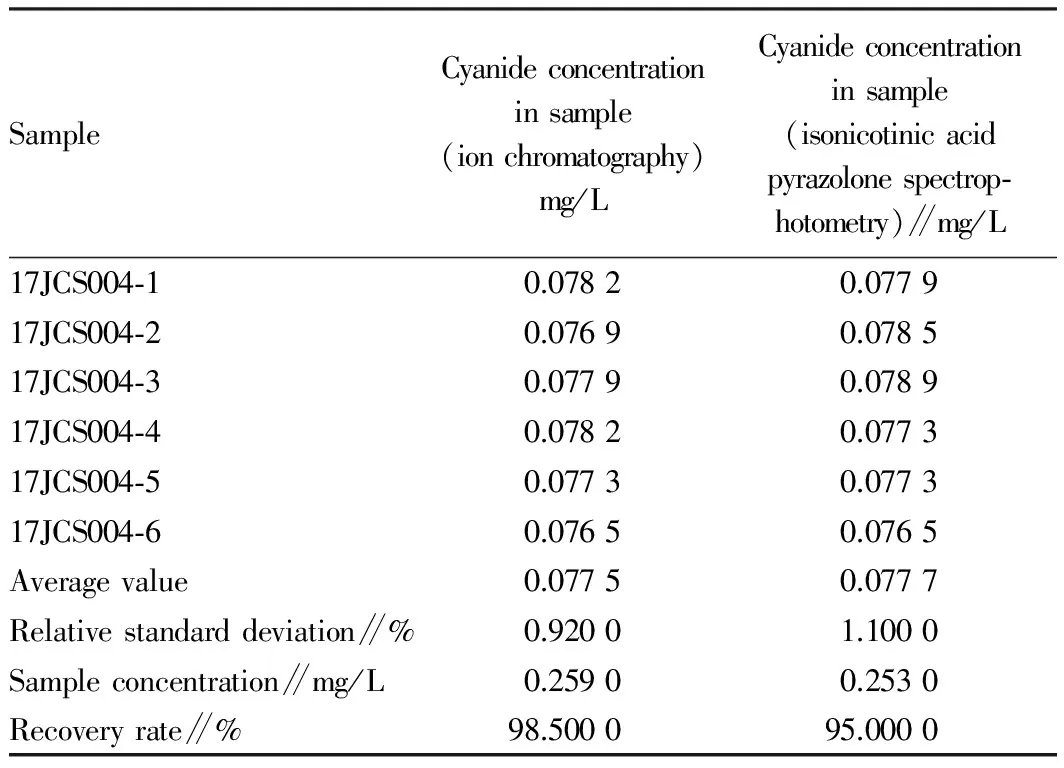
3.3SampledetectionresultsofisonicotinicacidpyrazolonespectrophotometryandionchromatographyWe took test sample 17JCS004 and detected by the ion chromatography and the isonicotinic acid pyrazolone spectrophotometry 6 times, and detection results were listed in Table 2. Compared with the ion chromatography, the isonicotinic acid pyrazolone spectrophotometry has more complex analysis procedure, more influencing factors, so it easily brings human error. Through comparison experiment, cyanide in pollution-free livestock product breeding water had lower relative standard deviation by the ion chromatography than the isonicotinic acid pyrazolone spectrophotometry, and the recovery rate was higher and detection results had higher accuracy; the limit of detection of the isonicotinic acid pyrazolone spectrophotometry was 0.004 mg/L (GB/T5750.5-2006), while the limit of detection of the ion chromatography was 0.001 mg/L, so the ion chromatography is more suitable for detection of cyanide than the isonicotinic acid pyrazolone spectrophotometry.
Table2Detectionresultsandrecoveryrateofsamplesbyisonicotinicacidpyrazolonespectrophotometryandionchromatography
SampleCyanideconcentrationinsample(ionchromatography)mg/LCyanideconcentrationinsample(isonicotinicacidpyrazolonespectrop⁃hotometry)∥mg/L17JCS004⁃10.07820.077917JCS004⁃20.07690.078517JCS004⁃30.07790.078917JCS004⁃40.07820.077317JCS004⁃50.07730.077317JCS004⁃60.07650.0765Averagevalue0.07750.0777Relativestandarddeviation∥%0.92001.1000Sampleconcentration∥mg/L0.25900.2530Recoveryrate∥%98.500095.0000
4 Conclusions and discussions
4.1Pooreffectofcyanidedetectionbythetitrationmethod
In alkaline conditions, the cyanide ions in the sample interact with silver nitrate to form soluble silver-cyanide complex ions. Excess silver ions react with p-Dimethylaminobenzylidenerhodanine (DMABR) indicator and the solution changes from yellow to orange-red[5]. Compared with the surface water, domestic sewage, and industrial wastewater, breeding water has less influencing factors. However, the Hg2+, Cu2+and Ni2+are not distilled, and they will react with cyanide ion and produce a stable complex, resulting in the decrease of the detection results. In the distillation of samples, the sulfide and cyanide ions react to form hydrogen cyanide and hydrocyanic acid, which can be detected through absorption by liquid[6]. Due to the influence of these disturbing factors, the sample needs to be titrated after the distillation is completed, but the distillation process is extremely complex and the safety is low, and it takes a long time. Therefore, it is not suitable for testing large quantities of samples.
4.2PooreffectofcyanidedetectionbyisonicotinicacidpyrazolonespectrophotometryIn neutral conditions, cyanide reacts with chloramine T, and generates cyanogen chloride, and then reacts with the isonicotinic acid, and generates glutaraldehyde through hydrolysis, finally condenses with pyrazolone into blue dye. At the wavelength of 638 nm, we measured the absorbance. The composition of cyanide is complex, and the state is unstable, thus for sampling, it is necessary to first add cadmium carbonate or lead carbonate to avoid the influence of sulfide. If the samples are not detected in time, they should be stored at temperature below 4℃, and before detection, distillation treatment should be carried out[4]. The isonicotinic acid pyrazolone spectrophotometry requires more stringent color development conditions, and color developer, color solution pH, and color development time will influence the color of solution product. For example, chloramine T easily loses effect at room temperature, it will influence the concentration of the reaction product, thus Chloramine T solution needs to prepared when it is needed; the solution has the best color development at pH 6.5-7.2. In other cases, the color development is not obvious or no color development, so the preparation of phosphate buffer solution is the key. The color development temperature is stable at 25-35℃, It takes about 40 min, so the laboratory generally takes 25-35℃ water bath for 40 min to ensure full detection of cyanide.
4.3BenefitsoftheionchromatographyforcyanidedetectionIn summary, through the comparison of the ion chromatography with the titration and isonicotinic acid pyrazolone spectrophotometry in the detection of cyanide in livestock product breeding water, it found that the ion chromatography has the best detection effect of cyanide in the breeding water. Just through filtering by 0.45 μm filter membrane, the ion chromatography can be used for detection. In optimized conditions, the spectral absorption peak and cyanide concentration show excellent linear relationship, the sample detection results have high reproducibility, the sample recovery rate is up to 95%-105%, and the limit of detection is 0.001 mg/L. Compared with the titration and isonicotinic acid pyrazolone spectrophotometry, the ion chromatography is simple, safe and has few disturbing factors in the experimental process. Besides, this method has the benefits of low relative standard deviation of repeated measurement, high sample recovery rate, small system error and human error, thus it is suitable for testing large quantities of samples.
[1] PAN FY. Study on method for determination of total cyanide by spectrophotometry with ISO nicotinic acid[J].Guangzhou Chemical Industry and Technology,2017,45(11):171-172.(in Chinese).
[2] DI YM, ZHU J, CHANG J,etal. Recent advance of detection method of cyanide[J].Physical Testing and Chemical Analysis Part B:Chemical Analgsis,2011,47(12):1491-1494.(in Chinese).
[3] WANG MG, LI SH, XIAO TF,etal. Techniques for the determination of cyanide in environmental samples:A review[J].Earth and Environment,2010,38(4):519-526.(in Chinese).
[4] LONG DQ, BI XC. Detection on the cyanide in drinking water by spectrophotometry [J].Journal of Yunyang Teachers College,2000, 20(6):66-70.(in Chinese).
[5] PU BZ. Uncertainty analysis on total cyanide determined by AgNO3titration[J].Inner Mongolia Environmental Protection,2011,23(6):129,131.(in Chinese).
[6] LIU HC, HE J. Determination of trace cyanide in wastewater by means of silver titration[J].Technical Communication of Zhejiang University of Chemical Technology,1978(10):62-65.(in Chinese).
杂志排行

Asian Agricultural Research的其它文章
- System Factors for Land Corruption in China
- Value Appeal of Harmonious Moral Life of Chinese College Students
- Interaction between Hosts and Guests of Rural Tourism in Northeast China Based on Symbolic Interaction Theory
- Rules for Access of Foreign Capitals to Agricultural Field in Countries along the "Belt and Road"
- Promoting Cotton Green Production in Shandong through Accelerating Simplified Cultivation Technique
- Comprehensive Evaluation of Main Traits of Sugarcane Germplasm Resources with High Sucrose Content