Dynamic Water and Salt Changes in Saline Wasteland on the Lower Edge of Plain Reservoirs in the Desert Oasis Region
2018-03-21
College of Water Conservancy and Architecture Engineering, Tarim University, Alar 843300, China
1 Introduction
The Alar reclamation area in southern Xinjiang is located in the southern foot of Tianshan Mountains, on the northern edge of Taklamakan Desert, with rare precipitation. The groundwater in the area is high in mineralization, and the main source of water for the industrial and agricultural production and domestic use relies on the Tarim River. With the gradual decrease of annual runoff in the Tarim River, the inadequate fresh water supply severely restricts the economic and social development in the area. In order to rationally utilize and adjust the limited freshwater resources, many plain reservoirs have been built in the desert oasis area. As of 2010, the number of all kinds of reservoirs in Xinjiang reached 564, dominated by the small and medium-sized reservoirs and the plain reservoirs[1]. The construction of plain reservoir has effectively alleviated the problem of water shortage, but the leakage of plain reservoirs will raise the surrounding groundwater level, resulting in secondary salinization of the surrounding soil, which has a certain adverse effect on the development of agriculture in arid area and the ecological environment around the reservoir[2]. Therefore, the research on the groundwater table depth and soil water and salt dynamics in the saline wasteland around the plain reservoirs[3]is of important practical significance to optimizing the management of soil and water resources around the plain reservoirs and the sustainable development of the regional agriculture.
For this purpose, based on the fixed-point monitoring results, this paper studied the effect of the plain reservoirs on the groundwater and soil in the surrounding saline wasteland, in order to ascertain the water and salt distribution characteristics in the non-irrigated saline wasteland and windbreak growing region around the plain reservoirs, and provide theoretical guidance for the use of water for local production.
2 Materials and methods
2.1OverviewofthestudyareaFrom March 2014 to September 2015, the test was conducted in Duolang Reservoir (40°48′-40°51′ N, 80°43′-80°49′ E) within the XPCC Agricultural Division Alar area. The experimental site is 50 km away from the city of Alar. Duolang Reservoir is one of the three major plain reservoirs in the Aksu Basin. It is divided into three regions and it is a large plain reservoir. The average annual temperature in the reservoir area is 10.7℃, the average annual sunshine time is 2 556-2 991 h, and the average annual precipitation is only 50 mm or so. The annual evaporation is up to 2 500 mm, and the difference in temperature changes within a day can reach 18°C. It has a typical temperate continental arid climate featured by dry and cold winters and hot summers, the spring and autumn temperature changes rapidly. The ecological forest in the saline wasteland around the reservoir area mainly relies on the supply of groundwater. In this study, we selected the saline wasteland around the southern reservoir area in the south of Ata Highway for fixed-point monitoring of dynamic changes in the soil water and salt.
2.2PointdistributionmethodsandprinciplesThe diversiform-leaved poplar, reeds and windbreaks mainly grow in the saline wasteland around the southern area of Duolang Reservoir. In the test area, we set one groundwater monitoring well, and set four corresponding soil sampling points according to the principle of different distances from the reservoir and different ecological conditions, for fixed-point monitoring and sampling.
2.3SamplingandtestingFrom late March 2014 to September 2015, the groundwater buried depth monitoring was performed once monthly; at the same time, the soil auger was used for collecting soil samples, and the depth of each point was 10, 20, 30, 40, 50, 60, 70, 80, 90, 100 cm, respectively. The soil moisture content and total soil salt content were measured, respectively.
The specific measurement method is as follows: (i) Determination of the groundwater buried depth. The dynamic groundwater change was monitored through the groundwater monitoring wells arranged in the study area. (ii) Determination of the soil water content. The water distribution in 0-100 cm deep soil in the study area was determined by the drying weighing method. (iii) Determination of soil salt content. After the dried soil samples were crushed, the soil solution was prepared according to the soil-water ratio of 1∶5, and the conductivity of the leachate was measured after shock filtration using the conductivity meter. The soil salt content was calculated according to the salt content and conductivity conversion formula.
3 Results and analysis
3.1Variationofsoilwaterandsaltovertimeinsalinewasteland
3.1.1The moisture variability of different soil layers with time. According to classical statistics, this paper analyzed the degree of variation of samples to reflect the dynamic change in the water content and salt content of each soil layer with time in the saline wasteland around the reservoir area, that is, in the analysis of data, we took the data about the same soil layer and different monitoring periods as the analysis object, to get the coefficient of variation (Cv) of moisture content and salt content in each soil layer over time. The percentage of the sample standard deviation in mean was the sample coefficient of variation. As for the general assessment ofCvvalue[4], whenCv≤0.1, there was the weak variability; when 0.1 ≤Cv≤1.0, there was the medium variability; whenCv>1.0, there was the strong variability. Table 1 shows the results of specific statistical analysis.
Table1Analysisofvariabilityofsoilmoisturecontentwithtime(naturalecologicalforestandwindbreak)
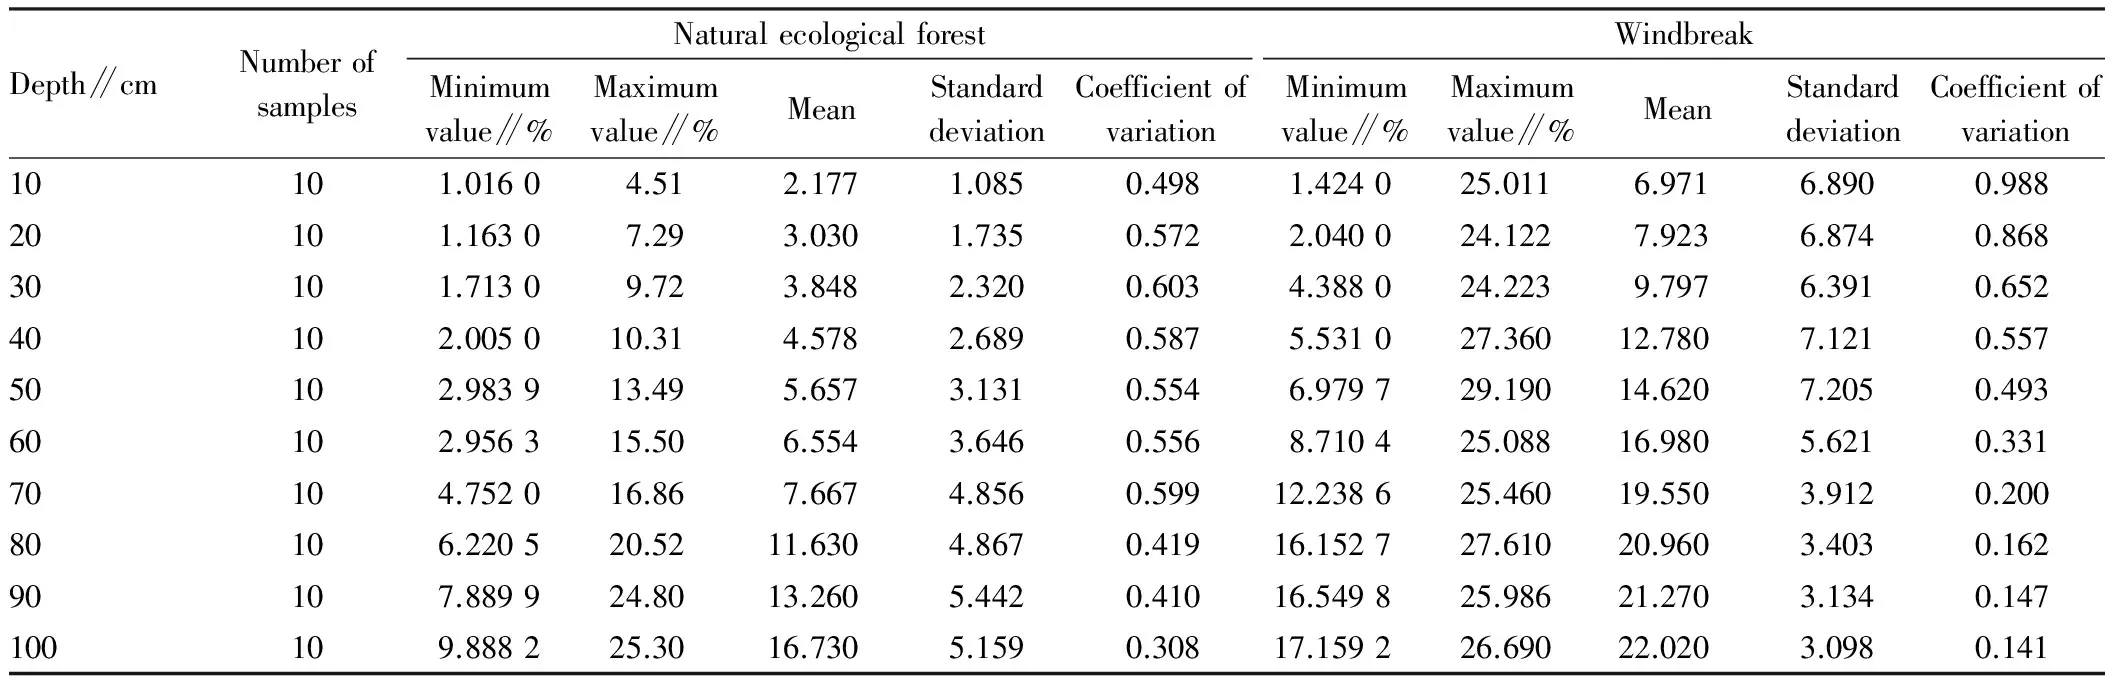
Depth∥cmNumberofsamplesNaturalecologicalforestMinimumvalue∥%Maximumvalue∥%MeanStandarddeviationCoefficientofvariationWindbreakMinimumvalue∥%Maximumvalue∥%MeanStandarddeviationCoefficientofvariation10101.01604.512.1771.0850.4981.424025.0116.9716.8900.98820101.16307.293.0301.7350.5722.040024.1227.9236.8740.86830101.71309.723.8482.3200.6034.388024.2239.7976.3910.65240102.005010.314.5782.6890.5875.531027.36012.7807.1210.55750102.983913.495.6573.1310.5546.979729.19014.6207.2050.49360102.956315.506.5543.6460.5568.710425.08816.9805.6210.33170104.752016.867.6674.8560.59912.238625.46019.5503.9120.20080106.220520.5211.6304.8670.41916.152727.61020.9603.4030.16290107.889924.8013.2605.4420.41016.549825.98621.2703.1340.147100109.888225.3016.7305.1590.30817.159226.69022.0203.0980.141
By the analysis of data about the water content of the soil in the natural ecological forest and windbreaks in the saline wasteland around the reservoir from March 2014 to September 2015 (Table 1), it was found that there was an increase in the average moisture content of different soil layers with the increasing depth. This is mainly due to the fact that the test area is around the reservoir, and the ponds are replenished artificially to make the groundwater level stable and buried depth little. The observation records of groundwater buried depth for two consecutive years can be seen in Table 2.
Table2Thechangeofgroundwaterburieddepthinthesalinewastelandin2014and2015

DateGroundwaterburieddepth∥mDateGroundwaterburieddepth∥mDateGroundwaterburieddepth∥m2014.3.301.632014.8.61.112015.5.311.282014.5.181.232014.8.191.212015.6.211.242014.6.71.282014.9.281.232015.7.71.172014.6.141.312014.10.251.362015.9.281.212014.7.41.292015.4.121.452015.10.201.262014.7.131.322015.5.11.26
As can be seen from Table 2, in the two-year experimental study, the maximum buried depth of groundwater table was 1.63 m, the minimum buried depth of groundwater table was 1.11 m, and the average buried depth of groundwater table was 1.28 m in the test area. In general, the buried depth change was steady within two years, the fluctuation range was not large, and the variation range between the maximum value and the minimum value was 0.52 m. The main reason is that there is artificial fishpond around the reservoir for replenishment. The groundwater level of the surveyed area was slightly affected by the seasonal change. From the coefficient of variation of water content, whether it was the natural ecological forest land or shelter forest land, the coefficient of variation (Cv) of soil water content was at the level of moderate variability; for the natural ecological forest land, the coefficient of variation of each soil layer first increased and then decreased, and the coefficient of variation gradually increased in the 0-30 cm soil layer, mainly because the end of March, beginning of April, was selected as the observation period in which the permafrost was not melted fully so as to replenish the topsoil, making the moisture content of this soil layer vary greatly.
In addition, in some observation periods throughout the year, the outside temperature increased rapidly, and the soil moisture in the overall moved up under the external evaporation, making the soil moisture increase. However, as for the coefficient of variation of various soil layers in the shelter forest land, it gradually decreased with the increase of depth, and the law that the soil moisture content in the surface layer changed greatly also appeared.
3.1.2The salt content change of different soil layers with time. As shown in Table 3, it was found that in the 0-100 cm soil layer, the average salt content of different soil layers showed a large value for the topsoil, and with the increase of the depth, the salt content showed a decreasing trend. The conversion equation of electrical conductivity and salt content is as follows:
y=0.363x+0.010 8,R=0.986 6
wherexis the soil solution conductivity value;yis the soil salt content (g/kg).
From the coefficient of variation of salt content, whether it was the natural ecological forest land or the shelter forest land, the coefficient of variation (Cv) of salt content in different soil layers was at the level of moderate variability; for the coefficient of variation of different soil layers in the natural ecological forest land, it increased first and then decreased, that is, the coefficient of variation was the largest in the 40 cm soil layer, while the large coefficients of variation of different soil layers in the shelter forest land were concentrated in the surface layer. Through comparative analysis of the coefficient of variation of soil water content and salt content in the natural ecological forest land and the shelter forest land in Table 1 and Table 3, it was found that the variability was at the middle level, and except for the 10 cm and 20 cm soil layers in the ecological forest land and 10 cm soil layer in the shelter forest land, the coefficient of variation of salt content was greater than the coefficient of variation of water content in other soil layers, indicating that under the same conditions, the degree of variation of salt in the soil was higher than the degree of variation of moisture content in the soil.
Through comparative analysis of the coefficient of variation of soil water content and salt content in the natural ecological forest land and the shelter forest land in Table 1 and Table 3, it was found that the variability was at the middle level, and except for the 10 cm and 20 cm soil layers in the ecological forest land and 10 cm soil layer in the shelter forest land, the coefficient of variation of salt content was greater than the coefficient of variation of water content in other soil layers, indicating that under the same conditions, the degree of variation of salt in the soil was higher than the degree of variation of moisture content in the soil.
Table3Analysisonvariabilityofsaltcontentindifferentsoillayerswithtime(naturalecologicalforestandwindbreak)

Depth∥cmNumberofsamplesNaturalecologicalforestMinimumvalueg/kgMaximumvalueg/kgMeanStandarddeviationCoefficientofvariationWindbreakMinimumvalueg/kgMaximumvalueg/kgMeanStandarddeviationCoefficientofvariation10101.0848.8565.072.4630.4860.2303.7021.451.1590.80420101.2417.0593.972.2500.5660.1993.8031.451.3280.91330100.7007.8402.862.0380.7140.2973.0991.200.9130.75840100.7785.0191.851.3540.7330.2802.0940.970.5690.58750100.8705.1791.841.3180.7170.2761.7090.950.5010.52760100.6683.0411.710.9870.6380.1511.9770.950.5870.60970100.6632.9101.370.8260.6130.2071.7120.910.5930.64980100.6103.1501.360.8630.6130.2302.1700.900.5680.60890100.4852.0721.280.5770.4510.2072.4200.840.5340.635100100.5413.3391.290.5780.4480.2721.8320.840.5020.599
3.2Thespatialdistributioncharacteristicsofsoilmoisturecontentandsaltcontent
3.2.1The spatial distribution characteristics of soil moisture content in the saline wasteland. By selecting the soil moisture content of the natural ecological forest in the saline wasteland from the test observation data in 2014 and 2015 (Fig. 1 and Fig. 2), it was found that the overall soil moisture content increased with the increase of soil depth in two years, the overall trend was the same, and the soil moisture content showed an increasing trend in 2015 compared with 2014. Especially the moisture content of the 60-100 cm soil experienced great fluctuations compared with other soil layers, and the soil moisture content in the 60-100 cm was significantly higher than the soil moisture content in other soil layers, and in the 80-100 cm soil layer, the soil moisture content in 2015 was significantly higher than the soil moisture content in 2014, which was directly related to the decrease of groundwater buried depth in the test area. In the 0-60 cm soil layer, the soil moisture content showed the same curve characteristics. From the change rate of soil moisture content, the moisture content change in the 30-60 cm soil was relatively flat compared with the moisture content change in the 0-30 cm surface soil. The maximum soil moisture content was 25.30% in two years.
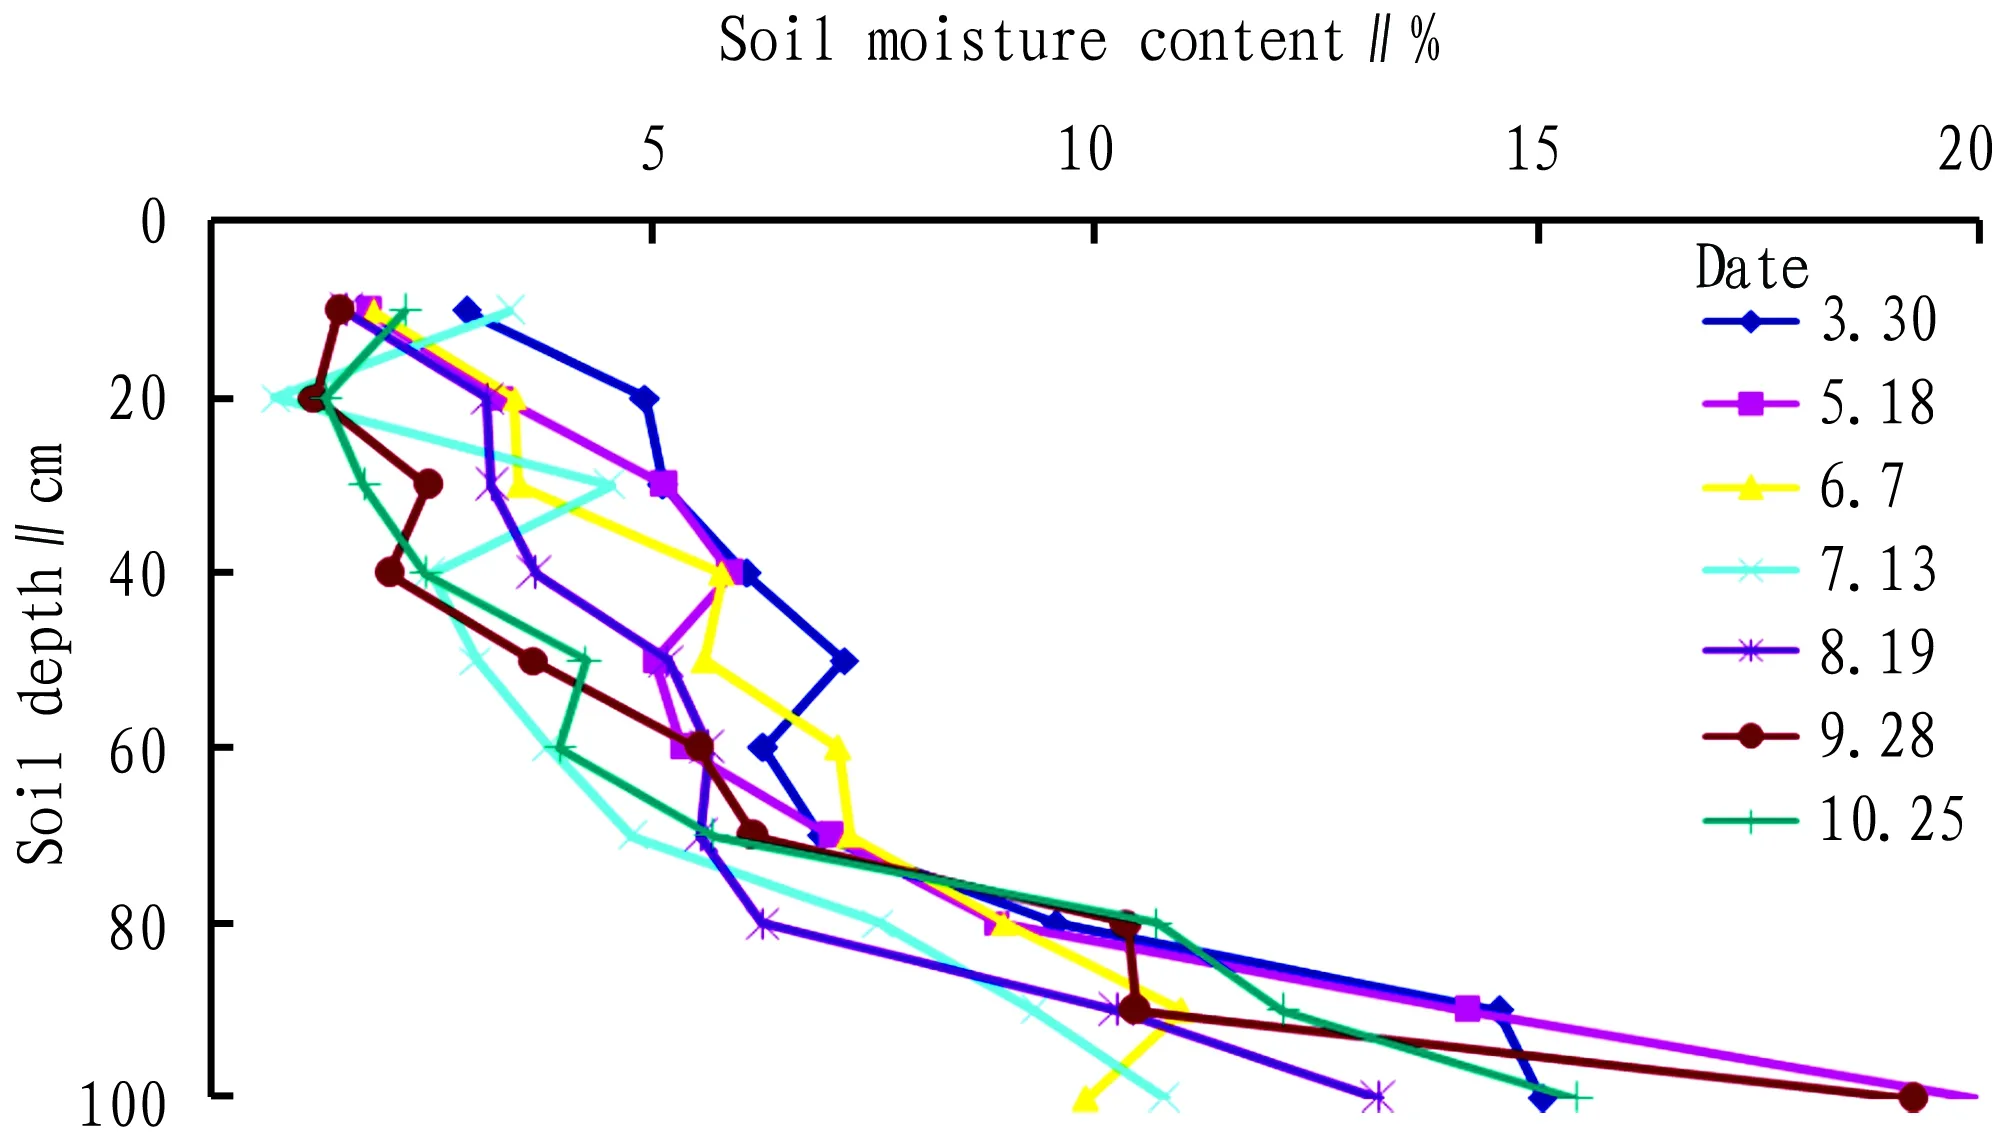
Fig.1Thesoilmoisturecontentchangeinthesalinewastelandin2014

Fig.2Thesoilmoisturecontentchangeinthesalinewastelandin2015
3.2.2The spatial distribution characteristics of soil salt content in the saline wasteland. From Fig. 3 and Fig. 4, it was found that the soil salt content of the the natural ecological forest land in the saline wasteland increased obviously compared with the same period in 2014. According to the content difference of different soil layers in the year, the total soil salt content decreased with the increase of soil depth, the salt content change was obvious in the 0-40 cm soil layer, and there was significant surface accumulation of salt; in the 40-100 cm soil layer, the salt content change was small, in the range of 1.5 g/kg. During the monitoring period, the salt content of different soil layers in the saline wasteland was affected by seasonal changes, and the salt content was high in the shallow soil in summer, mainly due to the large amount of evaporation in summer, the soil salt would accumulate on the surface with the evaporation of water; in other monitoring periods, the relative salt content was low in the shallow soil, but in the whole period, there was small change in the salt content of soil layer less than 40 cm, tending to be stable, and the soil salt content in the saline wasteland changed in the range of 0.48-8.86 g/kg in two years.

Fig.3Thesoilsaltcontentchangeinthesalinewastelandin2014
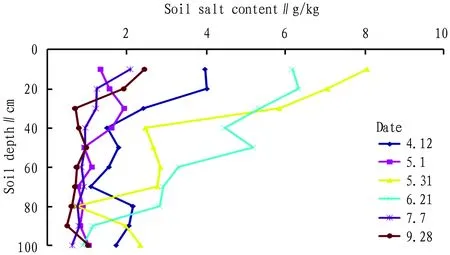
Fig.4Thesoilsaltcontentchangeinthesalinewastelandin2015
As shown in Fig. 5, it was found that the change of total soil salt content in different soil layers in the shelter forest land around saline wasteland was consistent with the change of total soil salt content in different soil layers in the natural ecological forest land in 2014 and 2015. In the 0-40 cm soil, the soil salt content in the shelter forest land obviously decreased compared with the natural ecological forest land.

Fig.5Thesoilsaltcontentchangeintheshelterforestlandin2014and2015
4 Conclusions and discussions
By analyzing the monthly moisture content and salt content of soil samples for two consecutive years from the shelter forest land and the natural forest land in saline wasteland on the lower edge of the southern area of Duolang Reservoir, it was found that the soil was mainly sandy soil, and there were certain seasonal characteristics in the soil water and salt change in the saline wasteland around the reservoir area; it was also in close relationship with the groundwater buried depth. In the two years, through the dynamic change in the groundwater monitored with the groundwater observation wells in the study area, it was found that there was small change in the groundwater buried depth in the saline wasteland with the monitoring period, and the groundwater buried depth was 1.11-1.63 m, with a mean of 1.28 m in the two years. At the same time, the secondary salinization of soil in the reservoir area leads to serious land degradation and abandonment, which brings about not only the destruction of soil resources, but also the loss of agricultural production in the local farm. And it of course poses a threat to the ecological environment. In addition, although some conclusions are drawn by studying, there are still many problems, and there is a need to further study the relationship between the soil water and salt change and the groundwater buried depth in the saline wasteland around the reservoir area. Meanwhile, the comparison with the soil water and salt dynamics in the crop areas surrounding the reservoir area, grasping the law of soil water and salt transport, is of great practical significance to preventing secondary salinization of soil surrounding the plain reservoir and improving agricultural productivity.
(i) Through the monitoring of water and salt dynamics in the saline wasteland at different periods within two years, it was found that the variability of moisture content and salt content in different soil layers was at the medium level, and under the same conditions, the variability of salt content was greater than the variability of moisture content, and the large coefficient of variation appeared on the soil surface.
(ii) The soil moisture content increased with the increase of soil depth in two years, and the soil moisture content in 2015 was significantly higher than the soil moisture content in 2014, which was directly related to the groundwater buried depth change in the test area.
(iii) In the vertical direction, the total salt content in different soil layers showed a decreasing trend with the increase of soil depth. The salt content in the 0-40 cm soil layer showed obvious changes, with significant surface accumulation of salt, and the soil salt content in the shelter forest land was significantly lower than the soil salt content in the natural ecological forest land.
[1] YAN CQ. Discussion on the plain reservoir in Xinjiang[J]. Xinjiang Farmland Reclamation Science, 2001(5):32-33. (in Chinese).
[2] SHEN ZX, ZHOU JL, YANG GY. Review on studies of ecological environment of plain reservoir surrounding in inland arid area[J]. Ground Water, 2013, 35(1): 61-63. (in Chinese).
[3] ZHANG M. The study of dynamic movement of water and salt in soil nearby campestris reservoirs of arid and semiarid region—Taking LIUCHENGZI reservoir in FUKANG 222 corps as an example[D]. Urumqi: Xinjiang University, 2005: 38-39. (in Chinese).
[4] ZENG ZD, YANG SX, XIE SC,etal. Soil water dynamics[M]. Beijing : Tsinghua University Press,1988. (in Chinese).
[5] GUO QE, MA ZM, WANG YQ, XIE SC,etal. Effect of water table on soil saltions transfer and variation[J]. Journal of Irrigation and Drainage, 2010, 29(6): 64-67. (in Chinese).
[6] CHANG C, BAO AM, LI JL. Spatiotemporal evolution of cultivated land in the headwaters of the tarim river[J]. Arid Zone Research, 2016, 33(2): 239-245. (in Chinese).
[7] MAO HT, FAN ZC, HE HX,etal. On the effects of reservoirs in plain area to soil salinization in arid and semi-arid area[J]. Arid Zone Research, 2016, 33(1):74-79. (in Chinese).
[8] GONG L, LIU ZY, TASHPOLAT TYB. Soil salinity characteristic and its determinant factors at different soil types in oasis of extreme arid region[J]. Arid Zone Research, 2015, 32(4):657-662. (in Chinese).
EBSCO Publishing, headquartered in Ipswich, Massachusetts, is an aggregator of premium full-text content. EBSCO Publishing’s core business is providing online databases via EBSCOhost to libraries worldwide. EBSCOhost is used by libraries, schools, academic institutions, medical institutions, and corporations. The company is a subsidiary of Birmingham, Alabama-based EBSCO Industries. EBSCO Industries is located at number 196 of the top 200 privately held companies in the United States by Forbes Magazine. The company’s core business is providing online databases via its proprietary software, EBSCOhost, to libraries. EBSCO provides over 350 full-text and secondary databases. Content for these databases include full-text journals, magazines, books, monographs, reports, ebooks, business book summaries and various other publication types. It also provides databases for reference to the health and business sectors, such as DynaMed.
杂志排行

Asian Agricultural Research的其它文章
- System Factors for Land Corruption in China
- Value Appeal of Harmonious Moral Life of Chinese College Students
- Interaction between Hosts and Guests of Rural Tourism in Northeast China Based on Symbolic Interaction Theory
- Rules for Access of Foreign Capitals to Agricultural Field in Countries along the "Belt and Road"
- Promoting Cotton Green Production in Shandong through Accelerating Simplified Cultivation Technique
- Comprehensive Evaluation of Main Traits of Sugarcane Germplasm Resources with High Sucrose Content