Spatial Distribution Characteristics of Heavy Metals Cu and Zn in Coastal Wetland Sediments
2018-03-21,,
, ,
College of Resources and Environmental Engineering, Binzhou University, Binzhou 256600, China
1 Introduction
The Yellow River Delta is one of the important economic development zones in the Bohai Rim. The Yellow River crosses north of our country, it not only carries a large amount of silt in the Loess Plateau, but also brings domestic garbage from many important cities in the basin and pollutants from factories and mines into the sea, resulting in the pollution of the Yellow River Delta wetlands. Therefore, the pollution status of wetland sediments in the Yellow River Delta naturally becomes an important issue that we are increasingly paying attention to.
Cu and Zn are essential trace elements in the process of animal and plant growth, but they are also the heavy metals that cause soil pollution. Cu and Zn elements have great biological toxicity in the case of excess, and it can pose a serious threat to the human health through enrichment in the food chain. They can migrate, transform and accumulate in the soils and organisms through geochemical cycles[1]. In recent years, due to human activities such as oilfield development and agricultural planting, it has caused disturbances in the Yellow River Delta, which may affect the distribution of these elements in the region.
Currently, due to the rapid development of industry and agriculture in coastal areas, many coastal wetlands have become the wastewater and domestic sewage discharge area. The coastal wetlands can absorb, immobilize and transform the toxic pollutants such as heavy metal elements through physical, chemical and biological processes, but when the depositional environment of wetlands is seriously polluted and exceeds their carrying capacity, the heavy metals will be released from the suspended substances or sediments again, to form the secondary pollution, even through the food chain to threaten human survival[2]. Therefore, the heavy metal pollution in the coastal wetlands of the Yellow River Delta has very important research significance, which has aroused widespread concern of many scholars at home and abroad[3]. Domestic and foreign research extensively covers the pollution distribution of heavy metals in coastal wetlands in different regions[5], the cumulative characteristics of heavy metals and environmental quality evaluation[4]. At present, there are some researches on the nutrient elements and vegetation distribution in the coastal wetlands of the Yellow River Delta. For example, Pang Shoujietal. have studied the rare earth elements in the coastal wetlands of the Yellow River Delta, but there are few studies on the trace elements.
Based on the comparison of descriptive statistics of Cu and Zn in the surface sediments of wetlands, horizontal distribution characteristics of Cu and Zn in the sediments, vertical distribution characteristics of Cu and Zn in the sediments of wetlands, and distribution characteristics of Cu and Zn in the sediments under different vegetation cover, this paper studied the spatial distribution characteristics of Cu and Zn in the sediments from the coastal wetlands in the Yellow River Delta. The quantitative determination as well as theoretical analysis on the heavy metals Cu and Zn in the sediments was conducted, in order to provide a scientific basis and solutions for the protection and utilization of coastal wetlands[5].
2 Materials and methods
2.1TestsoilsamplesIn Binzhou Protected Area, the samples were collected in the site 30 km away from the south of Xiaobutou Town management station for the experiment. According to the deposition of the nature reserve, in the direction of the vertical coastline, a sample line was set at an interval of 500 m, a total of three parallel sample lines (A1, A2, A3). In each of the sample line, the sample was collected at an interval of 50 m from the land to the sea. The soil samples were taken from each sampling point according to five hierarchical levels (0-20 cm, 20-40 cm, 40-60 cm, 60-80 cm, 80-100 cm). The sample collected was a mixed sample, and the quartering method was used to retain about 1 kg of soil sample. The collected soil samples were put into ziplock bags, recorded, and brought back to the laboratory for analysis. A total of 25 sampling points were set up on three parallel sample lines, and a total of 125 soil samples were collected.
Meanwhile, in different vegetation cover areas, the soil under three kinds of typical vegetation cover (Phragmitescommunis,Suaeda,Tamarix) was selected to set up sampling points, and the soil samples were collected according to five hierarchical levels (0-20 cm, 20-40 cm, 40-60 cm, 60-80 cm, 80-100 cm). Three sampling points were set up in each vegetation cover area, and a total of 45 samples were collected. All samples were mixed samples, and the quartering method was used to retain about 1 kg of soil sample. The soil samples were packed in ziplock bags, recorded, and brought back to the laboratory for analysis.
2.2Testmethods
2.2.1Soil salinity treatment. After the sample was naturally air-dried, it was crushed with a stick to remove the animal and plant debris in the soil sample. Then the right amount of soil sample was taken and ground in the mortar, so that it was sifted through the 2 mm nylon sieve to remove the sand of more than 2 mm. later, 30 g of soil samples sifted through the 2 mm nylon mesh were taken and re-ground so that all samples were sifted through 0.15 mm mesh nylon and mixed uniformly for later determination.
Then, 0.1-0.2 g of soil samples through 0.15 mm nylon mesh were accurately weighed using an electronic balance and placed in the digestion tube. Using hydrochloric acid-nitric acid-perchloric acid digestion method, the mineral lattice of soil was completely destroyed, so that all the elements in the test sample entered into the test solution. After digestion in the digestion furnace until the liquid was viscous and slightly cooling down, the inner wall of the digestion tube was rinsed with deionized water 3 to 5 times, and the rinse solution was transferred to a 50 mL volumetric flask, and 5 mL of lanthanum nitrate solution was added. After cooling and reaching the constant volume, the solution was shaken for measurement. At the same time, the deionized water was used to replace the test sample, and the same steps and reagents as the test sample were adopted to prepare the full program blank solution. The Flame Atomic Absorption Spectrometry was used for the determination of Cu, Zn content in the soil[6].
Excel 2003 and SPSS softwares were used for statistical processing and analysis of data.
3 Results and analysis
3.1StatisticaldescriptionofCu,ZninsedimentsThe descriptive statistical analysis results of Cu and Zn in the surface sediments of coastal wetland in the Yellow River Delta are shown in Table 1. As can be seen from Table 1, the Cu, Zn content range of surface sediments was 16.70-50.40 mg/kg and 18.15-48.80 mg/kg, respectively, and the average content was 31.12 mg/kg and 36.74 mg/kg, respectively. The background values of two metal elements (Cu, Zn) in the surface soil were 13.46 mg/kg and 42.31 mg/kg, respectively in Shandong Province. The average content of Cu in the sediments of coastal wetland in the Yellow River Delta was significantly higher than the background value of heavy metal element Cu content in soil, and the average content of Cu was 2.3 times the background value, while the average content of Zn was lower than the background value. It indicated that the Zn content in the wetland surface sediments was at a normal level, while the surface soil of the Yellow River Delta wetlands was heavily polluted by heavy metal Cu. The coefficient of variation (CV) of Cu was 22%, and the coefficient of variation (CV) of Zn was 24%. The coefficients of variation of the content of two elements showed little difference, indicating that the content distribution of Cu and Zn was consistent in the surface layer. Cu had a skewness of 0.18 greater than 0, and the sampling point data were located on the right side of the average, indicating that the Cu content of most sampling points was higher than the average value; the skewness of Zn was less than 0, indicating that the Zn content of most sampling points was lower than the average.
Table1ThedescriptivestatisticsofCu,Zninthesurfacesediments

HeavymetalMinimumvaluemg/kgMaximumvaluemg/kgTheaveragevaluemg/kgStandarddeviationCoefficientofvariation∥%KurtosisSkewnessCu16.7050.4031.127.00220.810.18Zn18.1548.8036.748.9024-0.46-0.89
3.2AnalysisonthehorizontaldistributioncharacteristicsofCu,Znandinfluencingfactors
3.2.1Horizontal distribution characteristics of Cu. For ease of comparison analysis, the sampling regions were divided into the inshore areas, the offshore areas and the middle areas in accordance with the distance from the sea. Fig. 1 reflected the changes with the distance from the sea, and the changes in the content of Cu in the sediments. As can be seen in Fig. 1, the overall content of Cu in the sediments in the middle areas was higher than the overall content of Cu in the sediments in the inshore areas and the offshore areas. The main sources of heavy metal elements included sediments input from the Yellow River, seawater input (through tides and seawater intrusion,etc.), atmospheric input (wet-dry deposition) and the man-made pollution in the study area. The content of Cu in the 0-20 cm sediments was the highest in the offshore areas, possibly because the chemical fertilizer containing Cu was applied to the vegetation in the offshore areas so as to make Cu accumulated at 0-20 cm, or the heavy metals accumulated in the 0-20 cm sediments due to human activity, garbage discarding and other factors[7]. Through the analysis of the Cu content in each region, it was found that the content of Cu in the sediments of the inshore areas was 26.48-32.83 mg/kg, and the average content was 29.31 mg/kg. From the surface to the cross-section with a depth of 60 cm, the content of Cu in the sediment gradually increased; from 60 cm to 100 cm, the content of Cu decreased. In the 60-80 cm and 80-100 cm, the content of Cu in the sediment was high in the 100 cm sediments. For the middle areas, the content of Cu in the sediments was 30.26-37.25 mg/kg, and the average content was 34.33 mg/kg; similar to the inshore areas, between the surface layer and 20-40 cm layer, the content of Zn in the sediments gradually increased; at 40-100 cm, the content of Cu showed an increasing trend in a small range, and the content of Cu was the lowest at 60 cm. Overall, down from 40 cm, with increasing depth, the content of Cu increased in a small range, and the content of Cu was the highest at 80 cm. Finally, for the offshore areas, the content of Cu in the sediments ranged from 29.87 to 33.76 mg/kg, with an average value of 33.00 mg/kg. From the surface to the 20-40 cm layer, the content of Cu in the sediments decreased sharply. Down from 40 cm, the content of Cu gradually increased in a small range, and there was a small difference in the content of Cu, indicating that Cu in this region was maintained at a relatively stable level from 60 cm below[8]. In conclusion, the spatial distribution characteristics of Cu in the surface sediments of wetlands were as follows: the offshore areas>the middle areas>the inshore areas. The spatial distribution characteristics of Cu below 40 cm were as follows: the offshore areas >the middle areas >the inshore areas.
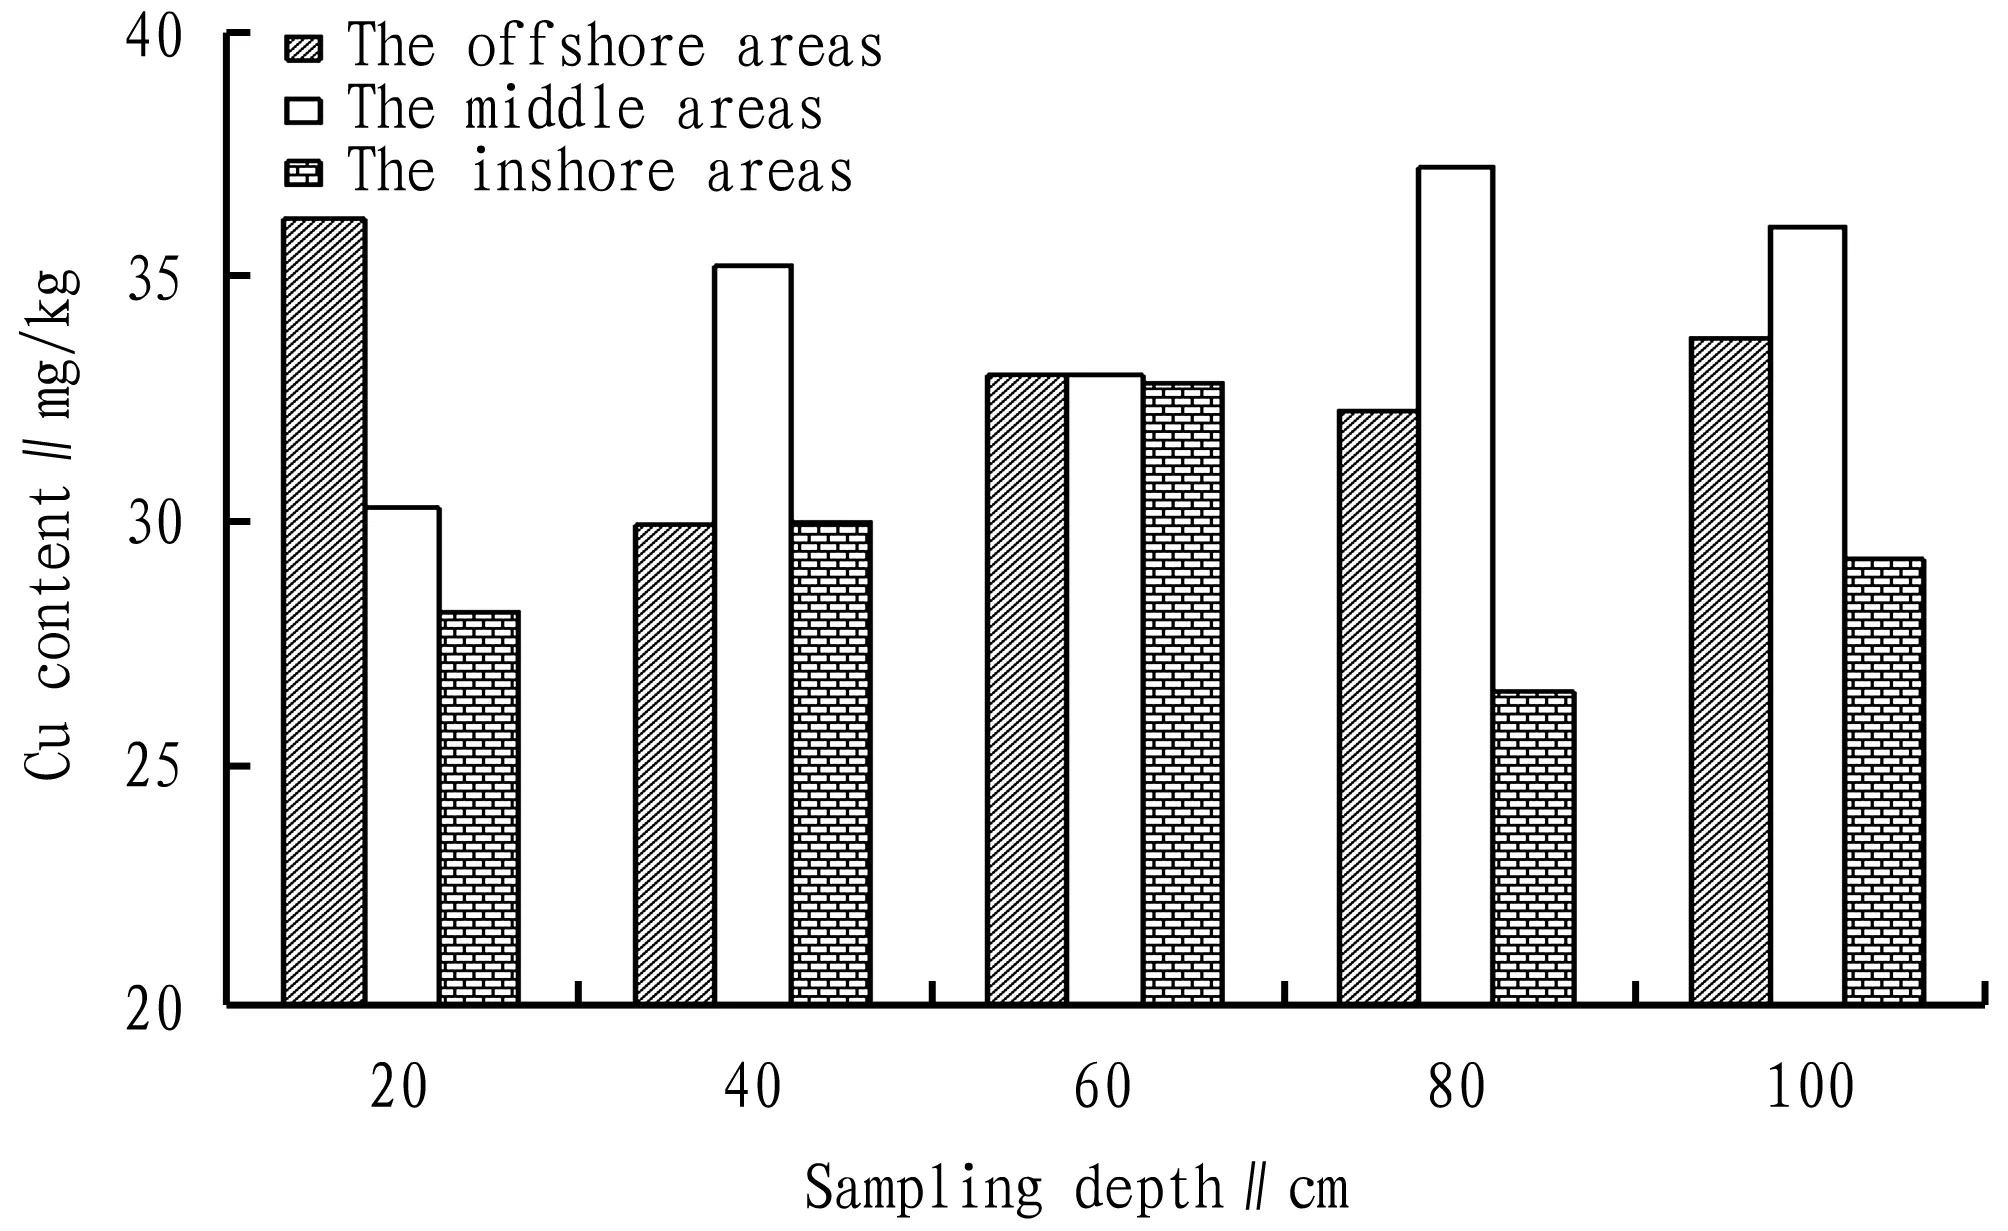
Fig.1ThehorizontaldistributionofCuinthecoastalwetlandsedimentsoftheYellowRiverDelta
3.2.2Horizontal distribution characteristics of Zn. From Fig. 2, it was found that the content of Zn in surface sediments was in the order of the offshore areas> the middle areas> the inshore areas, possibly because the hydrodynamic conditions affected the distribution of heavy metals along the coastal wetland, and in the offshore areas with the weak hydrodynamic conditions, the heavy metals accumulated obviously in the surface sediments, while in the inshore areas with the strong hydrodynamic conditions, the content of heavy metals was generally low in the surface sediments. With the increase of depth, the content of Zn in the sediments in the middle areas was gradually higher than the content of Zn in the sediments in the offshore areas. Next, we analyzed the content of Zn in the sediments in each area, and it was found that in the inshore areas, the content of Zn in the sediments was 30.20-39.61 mg/kg, with an average value of 33.52 mg/kg. From the surface to the cross-sectional depth of 60 cm, the content of Zn in the sediments gradually increased, probably due to the migration of the soil microorganisms to Zn; from 60 cm to 100 cm, the content of Zn gradually decreased, and there was a small difference in the content of Zn at 80 cm and 100 cm, indicating that Zn remained at a relatively stable level at a depth of less than 80 cm in this area. Secondly, for the middle areas, the content of Zn in the sediments was 33.03-41.52 mg/kg, and the average content was 38.80 mg/kg; similar to the inshore areas, from the surface to the cross section with a depth of 40 cm, the content of Zn in the sediments gradually increased; from 40 cm to 60 cm, the content of Zn gradually decreased, and the content of Zn at 100 cm was slightly higher than the content of Zn at 80 cm. Overall, down from 40 cm, with increasing depth, the content of Zn increased in a slight range, but the content of Zn was lower than that at 40 cm. Finally, for the offshore areas, the content of Zn in the sediments was 35.05-40.86 mg/kg, and the average content was 37.59 mg/kg; from the surface to the cross-section with a depth of 40 cm, the content of Zn in the sediments gradually decreased; below 40 cm, the content of Zn increased gradually, and the content reached the maximum value of 40.86 mg/kg at 100 cm.

Fig.2ThehorizontaldistributionofZninthecoastalwetlandsedimentsoftheYellowRiverDelta
3.2.3Analysis of influencing factors. From the above results, it can be seen that the content of Cu, Zn in the coastal wetland sediments of the Yellow River Delta was in the order of the offshore areas > the middle areas> the inshore areas. The reasons are as follows: (i) The offshore areas are located near the river. The runoff action of the river is greater than the dynamic action of the ocean, and the coast keeps growing outward. After the considerable sediments carried by runoff enter the offshore areas, due to planar spread of water flow and jacking of seawater, the flow slows down, so that a lot of sediments rapidly settle to the bottom, and the heavy metals are also deposited after being adsorbed by the surface sediments. (ii) Affected by the pollution discharge from industry and agriculture and domestic sewage, the concentration of heavy metals was significant in the vicinity of the offshore areas. (iii) In the inshore areas with strong hydrodynamic effect, due to storms and tides, the heavy metals are re-carried with the suspended sediments in the case of strong winds and big waves. (iv) In the middle areas, the tidal flat is broad, and mainly affected by the combined action of waves and currents. The shore is in a relatively stable state of erosion and sedimentation, and the content of heavy metals is generally lower than that of the offshore areas.
3.3VerticaldistributioncharacteristicsofCu,Zn
3.3.1Vertical distribution characteristics of Cu. Fig. 3 showed the vertical distribution characteristics of Cu in the wetland sediments. As can be seen from Fig. 3, from 20 to 40 cm, the content of Cu in the sediments gradually decreased, but then it gradually increased from 40 cm, and decreased rapidly at 60 cm. The content of Cu in the bottom layer was obviously higher than the content of Cu at 60-80 cm. The possible reasons for the high content of Cu in the 0-20 cm sediments are as follows: (i) Due to human activities, atmospheric deposition and other factors, the heavy metals accumulated in the 0-20 cm sediments. (ii) The wetland plant root’s selective absorption of the trace elements at 10-20 cm caused the content at 20-40 cm to be slightly lower than the content at 0-20 cm. However, in general, the content of Cu in the bottom layer was obviously higher than that on the surface, which indicated that the content of Cu on the surface in this area was mainly controlled by the primary geochemical conditions. The general distribution was that the content of Cu increased with increasing depth, but fluctuated within a small range.
3.3.2Vertical distribution characteristics of Zn. The change in the content of Zn in the sediments with depth can be shown in Fig. 3. As can be seen from Fig. 3, as the depth increased, the content of Zn fluctuated in a small range, showing an irregular increasing trend, a slight decrease at 60-80 cm. The highest content of Zn appeared at the lowest level, reaching 38.41 mg/kg, while the lowest content of Zn was at 0-20 cm from the surface, reaching 34.54 mg/kg. Compared with the Cu element, the two showed similar vertical distribution features, which might be not only due to the similar origin of coastal wetland sediments for the two, but also due to the impact of approximately the same factors[9].
3.4ThecharacteristicsofCu,Zndistributioninthesedimentsofdifferentvegetationcoverareas
3.4.1Cu distribution in the sediments of different vegetation cover areas. The spatial distribution characteristics of Cu in the sediments of different wetland vegetation cover areas can be shown in Fig. 4. The content of Cu in the 0-60 cm sediments of three vegetation cover areas was higher than the content of Cu in the 60-100 cm sediments of three vegetation cover areas. The content of Cu in the sediments ofTamarixcover areas was significantly lower than the content of Cu in the sediments ofSuaedacover areas andPhragmitescommuniscover areas. The content of Cu in the sediments ofTamarixcover areas ranged from 18.03 mg/kg to 26.04 mg/kg, with an average of 22.62 mg/kg. The content of Cu in theP.communiscover areas andSuaedacover areas was 23.16-30.93 mg/kg, 24.81-32.07 mg/kg, respectively, and the average content was 27.65 mg/kg and 28.53 mg/kg, respectively. The content of Cu in the 20-60 cm sediments ofSuaedacover areas was the highest (29.06-32.07 mg/kg), followed by the content of Cu in theP.communiscover areas (29.33-30.93 mg/kg), while the content of Cu in the 20-60 cm sediments of Tamarix cover areas was the lowest (23.93-24.56 mg/kg). As can be seen from Fig. 4, generally, the content of Cu in the sediments of three kinds of vegetation cover areas gradually decreased downward[10].
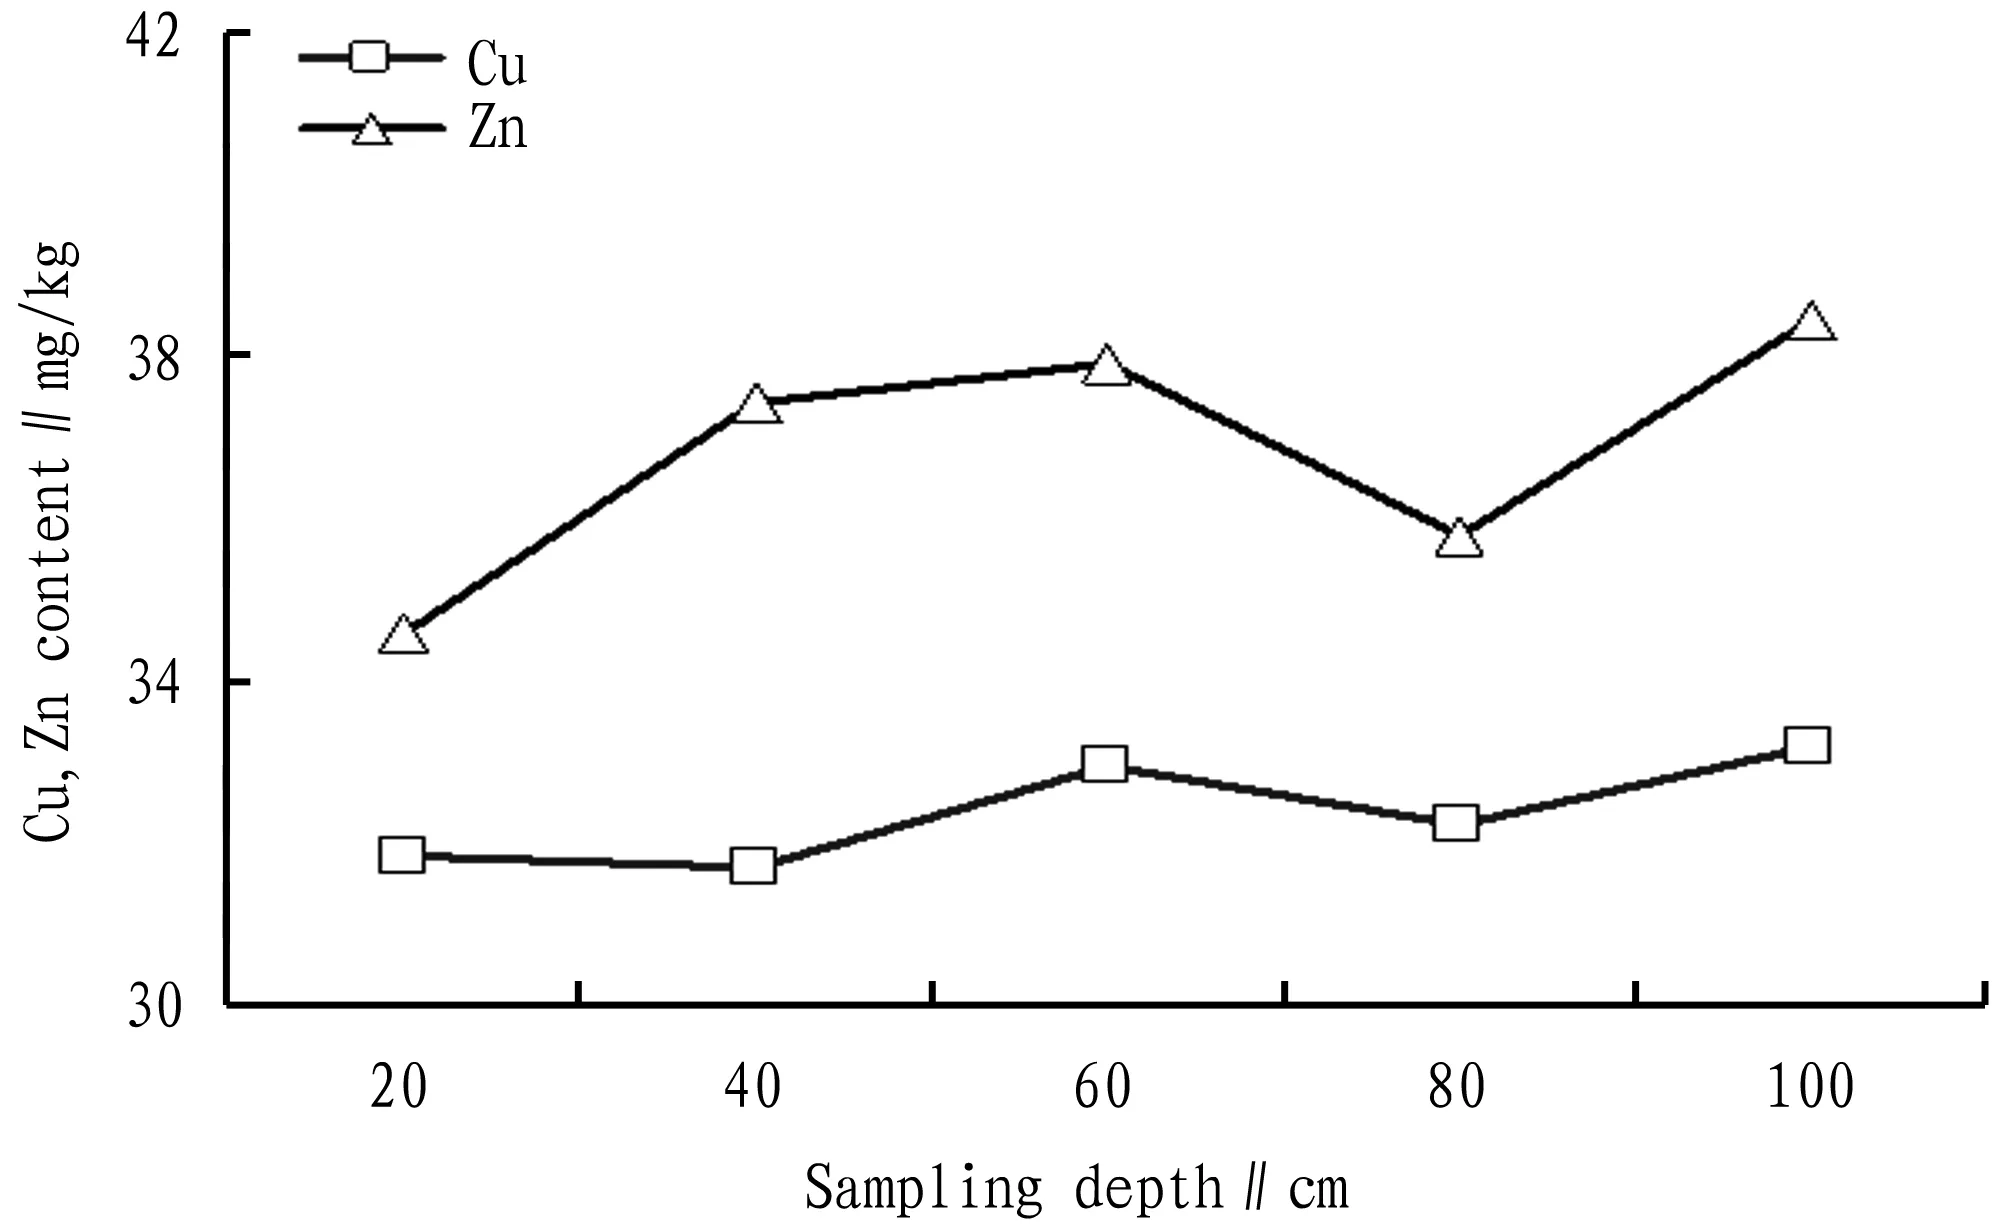
Fig.3VerticaldistributionofCu,ZninthecoastalwetlandsedimentsoftheYellowRiverDelta
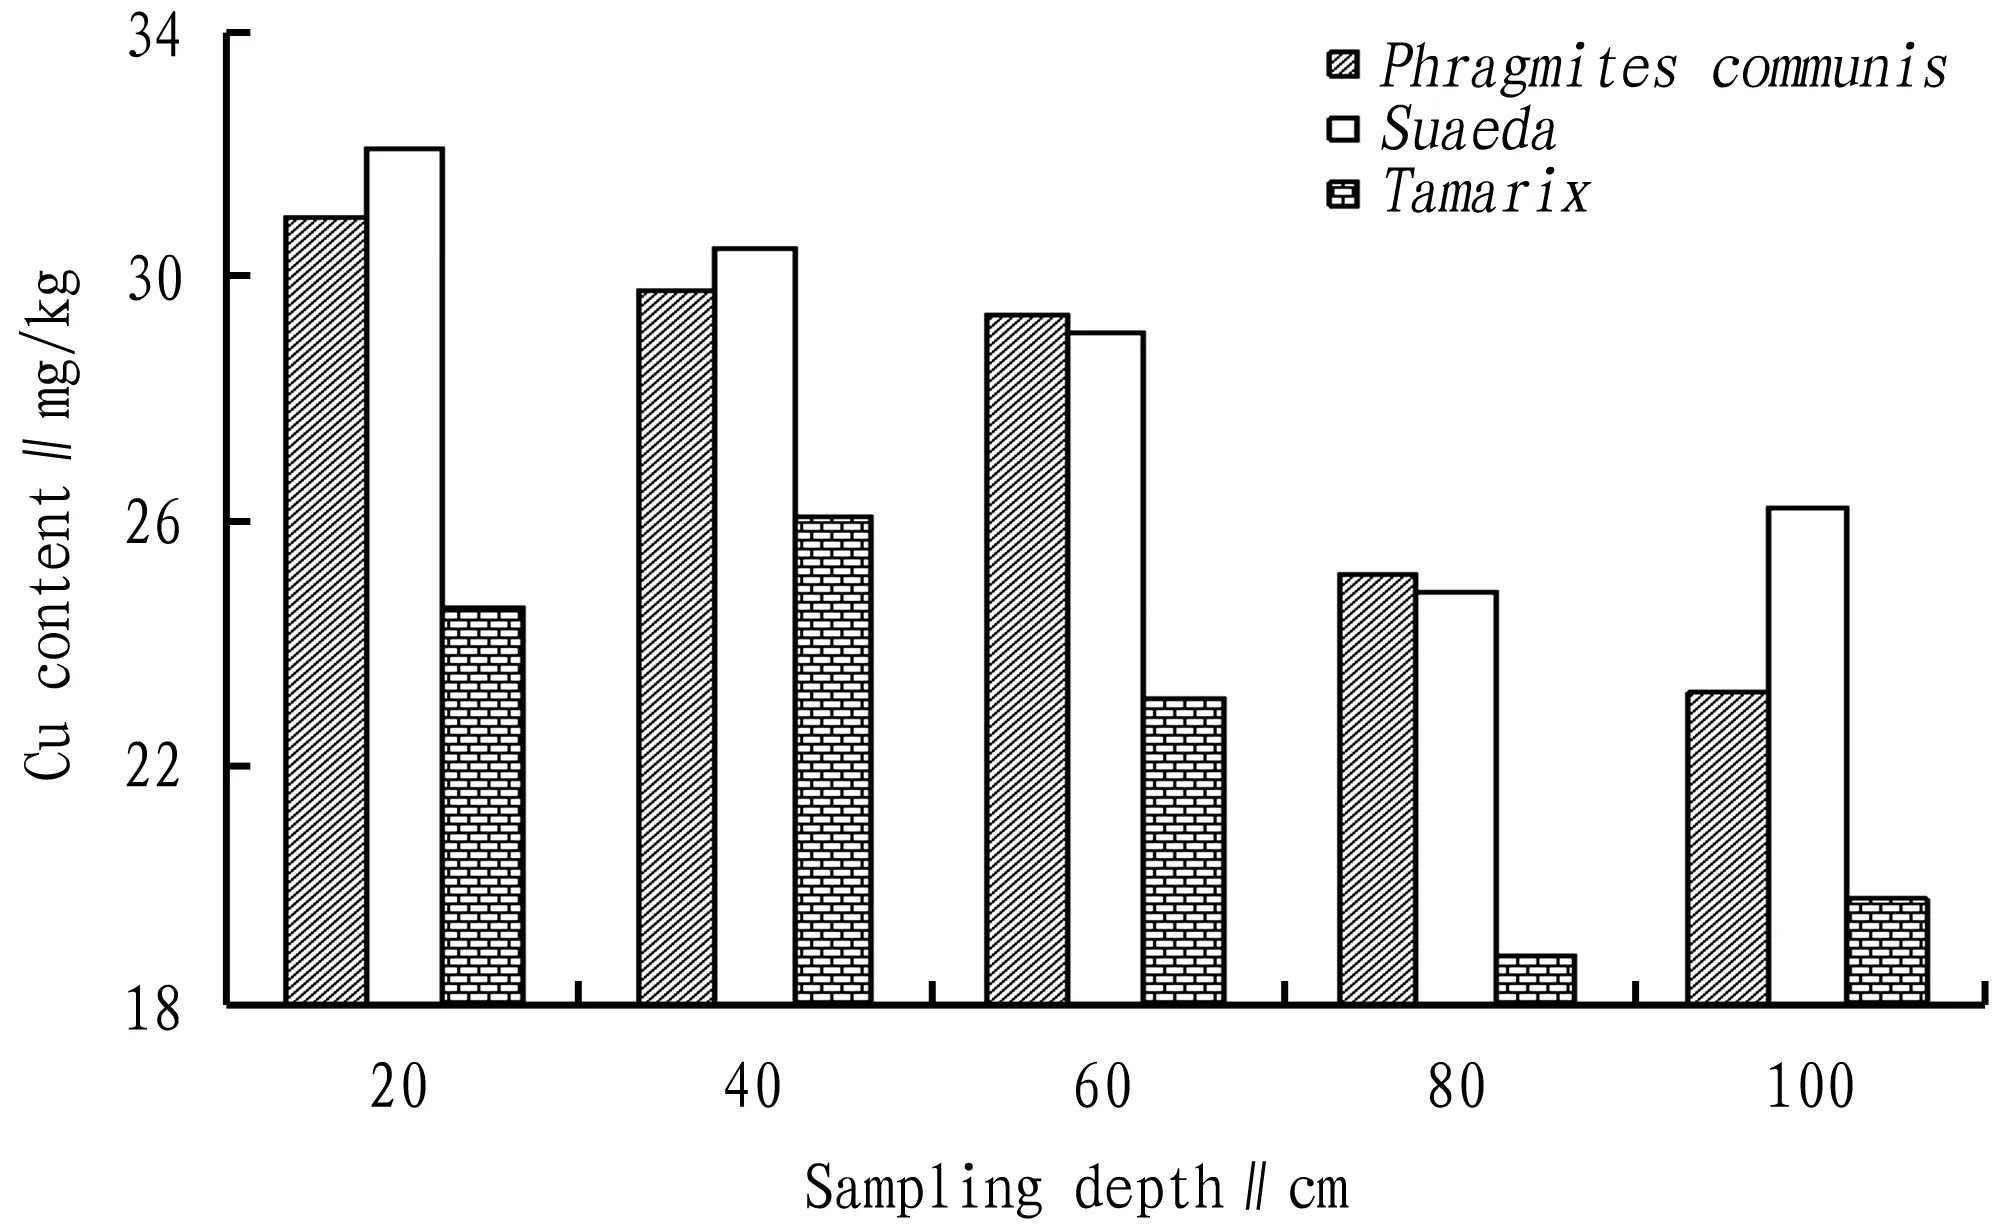
Fig.4ThedistributioncharacteristicsofCuinthewetlandsedimentsofdifferentvegetationcoverareas
3.4.2Zn distribution in the sediments of different vegetation cover areas. Fig. 5 showed the spatial distribution characteristics of Zn in the coastal wetland sediments of three typical vegetation cover areas. At 0-20 cm, the content of Zn in the sediments was almost the same inSuaedaareas andTamarixareas. However, the content of Zn in the sediments ofTamarixarea was higher than the content of Zn in the sediments ofSuaedaarea at 20-40 cm, while the content of Zn in the sediments ofSuaedaarea was higher than the content of Zn in the sediments ofTamarixarea at 40-80 cm. The content of Zn in the sediments ofTamarixcover areas and Suaeda cover areas was generally higher than the content of Zn in the sediments ofP.communiscover areas. The content range of Zn in the sediments of three vegetation cover areas (P.communiscover areas,Suaedacover areas andTamarixcover areas) was 28.81-39.90 mg/kg, 34.90-43.83 mg/kg and 33.63-44.07 mg/kg, respectively, and the average content was 35.21 mg/kg, 39.01 mg/kg and 39.21 mg/kg, respectively. As for the three vegetation cover areas, the content of Zn in the sediments at 0-60 cm was higher than the content of Zn in the sediments at 60-100 cm, and especially forTamarixcover areas, the highest value of Zn in the sediments ofTamarixcover areas reached 44.07 mg/kg. In general, the content of Zn in the sediments of three vegetation cover areas gradually decreased with the increase of sampling depth[11].
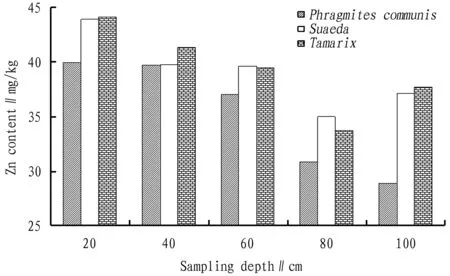
Fig.5ThedistributioncharacteristicsofZninthewetlandsedimentsofdifferentvegetationcoverareas
From the above results, it was found that the wetland plants had the ability to absorb heavy metals in the soil, and different plants could be planted to reduce the content of heavy metals in the soil.
4 Conclusions
(i) The experimental results showed that in the coastal wetland surface sediments of the Yellow River Delta, the content of Cu, Zn was 16.70-50.40 mg/kg and 18.15-48.80 mg/kg, respectively, and the average content was 31.12 mg/kg and 36.74 mg/kg, respectively. Compared with the background value of surface soil in Shandong Province, the content of Cu in surface sediments exceeded the standard, while the content of Zn was within the normal range. It showed that the wetland soil in the Yellow River Delta was in a serious state of pollution by heavy metal Cu. The probable cause was the application of copper-containing fertilizers, such as copper fertilizer or copper-containing compound fertilizer, making the copper accumulate in the surface soil.
(ii) The horizontal direction results showed that in the surface (0-20 cm) sediments, the content of Cu, Zn was in the order of the offshore areas > the middle areas > the inshore areas; in the deep (40-100 cm) sediments, the content of Cu, Zn was in the order of the middle areas>the offshore areas>the inshore areas. This showed that the content of Cu, Zn in the coastal wetland sediments was lowest in the inshore areas of the Yellow River Delta.
(iii) The vertical direction analysis results showed that the content of Cu, Zn gradually increased with increasing soil depth in general, and the content of both reached the highest value at 80-100 cm. Despite the decrease in the content of Cu, Zn with the increase of soil depth in some samples, but overall, the content of Cu, Zn in the deepest (80-100 cm) soil was higher than the content of Cu, Zn in the surface (0-20 cm) soil.
(iv) There were significant differences in the content of heavy metals in sediments under different vegetation cover. The content of Cu in the sediments under different vegetation cover was in the order ofSuaedaareas>P.communisareas>Tamarixareas; the content of Zn in the sediments under different vegetation cover was in the order ofTamarixareas>Suaedaareas>P.communisareas. The results showed that different types of vegetation had different ability to absorb Cu, Zn in the sediments. In general, the content of Cu, Zn in the sediments of three vegetation cover areas decreased with the increase of depth, which might be caused by the absorption of heavy metals in the soil by plant roots.
Based on the above conclusions, we can find thatSuaeda,TamarixandP.communishave good ability to absorb the heavy metals in the wetland soils, and they can be widely planted to reduce heavy metal content in wetland soils.
[1] ZHANG XL, LI PY, LIU YL,etal. Studies on the wetland of the Yellow River Delta: a review[J]. Marine Sciences, 2007, 31(7): 81-85. (in Chinese).
[2] HE Q, CUI BS, ZHAO XS,etal. Vegetation distribution patterns to the gradients of water depth and soil salinity in wetlands of Yellow River Delta, China[J]. Wetland Science, 2007, 5(3): 208-214. (in Chinese).
[3] Wet Lands International China Office. Economic evaluation of wet land[M]. Beijing: China Forestry Publishing House, 1999.
[4] WILLIAM J, JAMES GG. Wet lands[M]. New York: John Wiley, 2000.
[5] YE SY, DING XG, YUAN HM,etal. Coastal wetland protection in China: Geological issues and research tasks[J]. Marine Geology Letters, 2011, 27(2): 1-7. (in Chinese).
[6] ATTRILL MJ, THOMESM RM. Heavy metal concentrations in sediment from the Thames Estuary,UK[J]. Marine Pollution Bulletin,1995,30(11):742-744.
[7] CHEN ZL, XU SY, LIU L,etal. Spatial distribution and accumulation of heavy metals in tidal flat sediments of Shanghai Coastal Zone[J]. Acta Geographica Sinica, 2000,55(6):641-650. (in Chinese).
[8] QUAN WM, LI CJ, SHEN AL,etal. Distribution and accumulation of nutrients and heavy metals in Dongtan wetlands on Chongming Island, China[J]. Acta Ecologica Sinica, 2006, 26(10): 3324-3331. (in Chinese).
[9] CUI XD, HOU LY, MA FY,etal. Characteristics of soil nutrient and enzyme activity and mutual relative analysis of different land use types in Yellow River Delta[J]. Journal of Northwest Forestry University, 2007,22(4):66-69. (in Chinese).
[10] LING M, LIU RH, WANG Y,etal. The spatial distribution of heavy metals in the soil ofTamarixchinensisforest farm in Yellow River Delta Wetland and its ecological significance[J]. Transaction of Oceanology and Limnology, 2010 (4): 41-46. (in Chinese).
[11] HE Z, HU Y, CHEN J. Heavy metal distribution in surface sediment and sedimentary environment in Jiulongjiang Estuary[J]. Journal of Oceanography In Taiwan Strait, 2009,28 (4):455-459. (in Chinese).
杂志排行

Asian Agricultural Research的其它文章
- System Factors for Land Corruption in China
- Value Appeal of Harmonious Moral Life of Chinese College Students
- Interaction between Hosts and Guests of Rural Tourism in Northeast China Based on Symbolic Interaction Theory
- Rules for Access of Foreign Capitals to Agricultural Field in Countries along the "Belt and Road"
- Promoting Cotton Green Production in Shandong through Accelerating Simplified Cultivation Technique
- Comprehensive Evaluation of Main Traits of Sugarcane Germplasm Resources with High Sucrose Content