机械通风楼房猪舍热环境及有害气体监测与分析
2018-03-09刁亚萍林长光刘亚轩郭长明雷明刚
高 云,刁亚萍,林长光,刘亚轩,郭长明,雷明刚,童 宇,黎 煊
机械通风楼房猪舍热环境及有害气体监测与分析
高 云1,2,刁亚萍1,林长光3,刘亚轩3,郭长明3,雷明刚2,4,童 宇1,2,黎 煊1,2
(1.华中农业大学工学院,武汉 430070;2. 生猪健康养殖协同创新中心,武汉 430070; 3. 福建光华百斯特生态农牧发展有限公司,三明 365106; 4.华中农业大学动物科技学院动物医学院,武汉 430070)
楼房养猪模式提高了养殖密度,节约了土地资源,同时也带来了养殖企业对饲养环境的关注。该文以楼房猪舍为监测对象,采用无线传感网络多点部署的方法连续24 h监测不同楼层猪舍的温热环境和有害气体等环境因子参数分布,对比和分析不同楼层间以及同一楼层内不同位置间热环境和有害气体分布的差异性。以每楼层动物所需通风率为基准,将通风情况划分为欠通风、合适通风和过通风3种水平,结果显示中间层(保育猪1960头,10.8±1.9 kg)欠通风造成温湿度指标THI(temperature and humidity index)平均值达27.9,接近舒适区上限28.06。受顶层辐射和底层保温影响,顶层(生长猪940头,51±4.4 kg)温度最大值比底层(生长猪955头,40±3.6 kg)高2.8 ℃,顶层昼夜温度最大差值达11.6 ℃。底层湿度高,相对湿度达85.7%。夏季通风条件下,各楼层内的CO2和NH3浓度远低于最高浓度限值,欠通风猪舍CO2和NH3分布不均,且较难排出,其中NH3浓度受猪舍内尿液排出方式影响。各楼层温热和有害气体环境差异性显著,同一层猪舍不同位置环境存在差异。该研究为优化楼房养猪机械通风设计,提高楼房养猪环境控制水平提供理论依据。
温度;湿度;通风;楼房猪舍;热环境;有害气体;THI;差异性分析
0 引 言
自2014年1月1日《畜禽规模养殖污染防治条例》[1]实施起,环保政策密集出台,养殖用地日见紧张。为了节约养猪用地,全国各地楼房养猪正在兴起。楼房养猪作为一种新兴的养猪模式,既节约用地,也便于进行生物安全管理,同时由于不同楼层猪舍有高低落差,方便污水污粪的集中处理。国内的楼房养猪是顺应国内紧缩养殖用地的政策出现,国外鲜有相关研究报道。楼房养猪不同于平房养猪,由于缺少阁楼等建筑结构,在猪舍内的机械通风系统设计上,无法采用屋顶风机和屋顶进风口等通风结构,目前大部分楼房猪舍使用纵向通风设计。另外,不同楼层与外部环境的热交换情况有一定差异,如顶层热辐射,底层地板保温等影响,可能导致相同面积,相似的通风系统条件不同楼层中的环境控制效果有差异,从而对养猪生产造成较大的影响。因此有必要弄清不同楼层猪舍内部环境的规律,并针对不同楼层特点在猪舍通风系统设计以及运行方式上做进一步的调整和优化。
通常用来衡量猪舍环境的参数指标包括热环境和有害气体参数等。热环境指标主要以温度和湿度参数为主,另外还包括热辐射、大气压、光照等[2]。有害气体指标主要有CO2、NH3、H2S,其中CO2是一种温室气体[3-7],常用作计算通风率的示踪气体[8-12]。比如在美国国家空气排放监测研究(NAEMS)项目中,Heber等[13-14]连续2 a监测了15栋猪舍的温湿度、有害气体(包括CO2、NH3、H2S等)、通风率、外部气候、静压差、光照、动物和工人的活动等。除此以外,颗粒物、臭气、VOC、病菌的浓度和排放率也常作为猪舍内的环境监测指标[15-18]。根据行业内的标准和共识,猪舍内CO2、NH3和H2S的职业卫生最高质量浓度分别不超过9 819.3,19.0和15.2 mg/m3[19-21],从猪的健康角度,CO2不应超过3 024.3 mg/m3,NH3不应超过8.4 mg/m3[21]。猪舍内的CO2主要产生于动物的呼吸和粪便的分解,其排放量与猪的生理阶段和体重,进食成分相关[22-23];NH3主要来源于尿液中的尿素快速水解[24],其排放量与品种和生长阶段、气候变化、粪便处理方式、猪舍结构都密切相关[25-28]。H2S由粪便分解产生,目前在国内集约化猪舍内的质量浓度普遍不高,多数在0.2 mg/m3以下[29],远低于对动物有害水平。
为了监测猪舍内的环境参数,从20世纪90年代中期开始,计算机和传感器等技术在猪舍环境监测系统中大量采用。数字式温湿度传感器给畜禽舍内温湿度测量提供了便利条件。有害气体浓度的测量从化学分析法[30-32],发展到光声多气体监测、傅里叶变换红外光谱、气相色谱-质谱[33-34]等气体分析方法。便携式有害气体传感器也从电化学传感器发展为红外或激光气体传感器。电化学气体传感器短期测量数据准确,但长期使用易受其他气体影响。红外或激光气体传感器具有长期稳定的特点,但价格较为昂贵。在测量数据传输方面,通信网络也由RS-485,CAN总线发展为以太网TCP/IP协议,组网也由有线发展为WIFI、Zigbee等无线网络[35-37]。无线传感器网络在精确监测猪舍内部环境的同时,还具有良好的兼容性,能与猪舍内环境调控设备集成为完整系统[38-40],以确保猪舍内通风系统的有效运行。
为了掌握不同楼层猪舍内部环境的规律,本文基于无线传感器环境监测网络,采用在楼房猪舍内多点布置无线传感器的方法,对不同楼层的猪舍进行24 h监测,测量每楼层内的温湿度,CO2和NH3浓度,进行差异性分析,计算温湿度指标THI。为了考察猪舍内通风环境在较热气候条件下的运行情况,监测选择在春夏交替气候条件下(室外气温为17.3~31.5 ℃)进行,以期掌握多楼层猪舍内部的环境特征,为优化多楼层养猪通风系统,改善多楼层养猪的内部环境提供理论依据。
1 试验材料与方法
1.1 多环境因子无线传感网络监测系统
1.1.1 无线传感网络监测系统结构
现代集约化猪场的猪舍面积逐步增大,多点部署传感器测点才能有效监测猪舍内存在环境不均衡现象。本文采用在一层猪舍内多点均匀部署无线传感器测点的方式,来测量猪舍内部环境分布。每个无线传感器测点集成有温、湿度,CO2和NH3传感器。
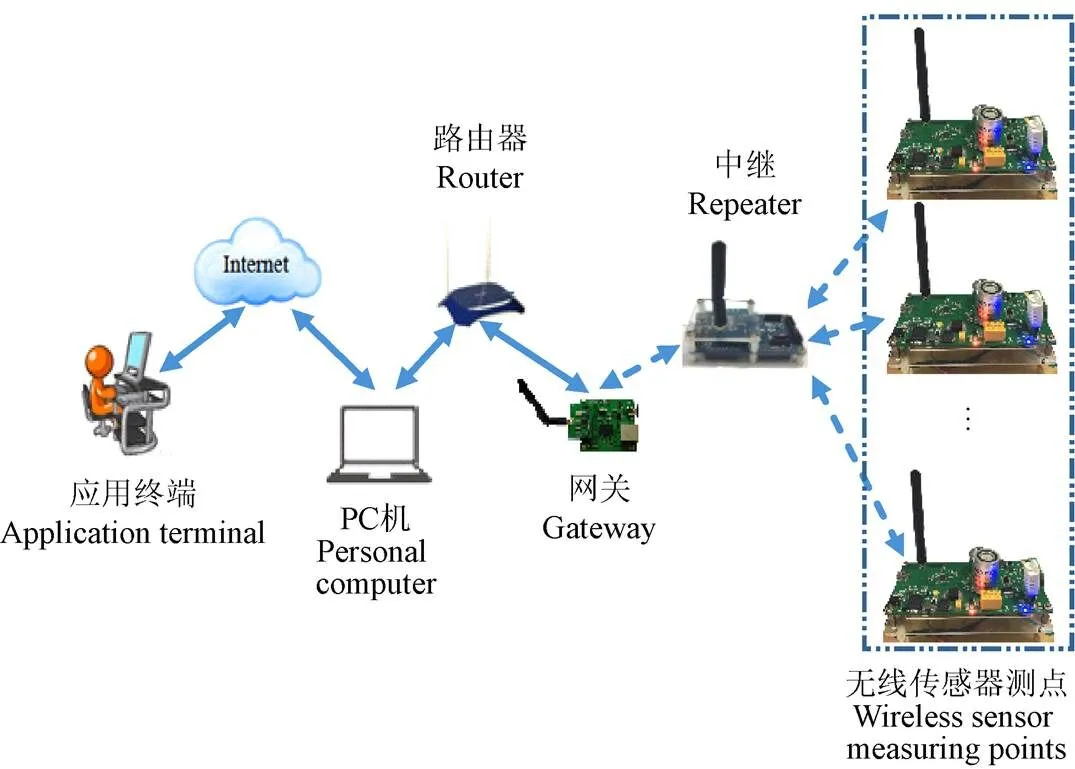
无线传感网络(WSN,wireless sensor network)监测系统结构如图1所示,包括无线传感器测点(数据采集前端)、中继(或中转节点)、网关(边缘路由器)、路由器、PC机(数据存储和信息监控)、应用终端(信息管理)。

图1 多环境因子无线传感网络监测系统结构
无线传感器测点由CC2530控制模块、传感器模块(包括温、湿度,CO2和NH3传感器),无线收发模块,供电电源管理模块组成,采用8 800 mAh/7.4 V的锂电池供电,在每5 min采样1次的情况下,可供整个网络连续工作4×24 h。每次采样设置3 min传感器预热时间,采样间隙测点进入PM2低功耗模式,电流仅为8A。中继通过网关将采集数据转换为IPv4协议数据,由内部局域网或者Internet外网传输至PC机。PC机上安装的基于Visual Studio 2012(Microsoft,美国)的软件平台开发的专用数据采集软件,从网络内抓包获取数据,并将数据存储到SQL server数据库,实现信息存储和管理功能。
1.1.2 监测传感器及仪器
无线传感器测点上搭载的温、湿度传感器(AM2302,奥松电子,广州),红外CO2传感器(SRH-1,四方光电,武汉),电化学NH3传感器(4NE-NH3-100,楚环,东莞)均为数字式传感器。电化学传感器放置于商业猪舍内短期监测数据稳定,连续监测超过3个月衰减严重。由于本监测为短期监测,在监测前进行预监测试验,连续测量72 h监测数据准确。
监测期间用于辅助测量和对比的仪器还包括:温湿度测量仪,CO2测量仪BM-80-CO2和NH3测量仪AP-S-NH3-J,双口压差计SDMN5。各传感器及手持式测量仪器参数如表1所示。监测前,所有传感器及仪器均返厂重新标定,保证测量数据的准确性。

表1 传感器和测量仪器参数
1.2 猪舍环境测量方法及无线测点部署
从2017年5月11日到21日对福建光华百斯特生态农牧发展有限公司下属的现代化楼房猪舍进行监测。为了尽量不影响猪舍的正常生产,并分析不同楼层机械通风系统内部环境的规律,数据监测选择在基本满载运行且猪只的品种较为统一的二栋1层(底层)、四栋5层(中间层)、一栋7层(顶层)猪舍分别进行24 h监测,楼房位置平面图如图2所示。3间猪舍的饲养面积相同,长90 m×宽15 m,顶高3.5 m,中间无隔断,单一走廊宽1 m,刮粪池深0.8 m,半漏缝地板占总猪圈面积的2/3,地板、吊顶和墙壁均为水泥表面。

图2 楼房猪舍位置平面图
二栋1层有生长猪955头(40±3.6 kg);四栋5层有保育猪1960头(10.8±1.9 kg);一栋7层有生长猪940头(51±4.4 kg),品种均为长白猪和大白猪。自动料线喂料时间为每天上午。8:00-10:00,下午14:00-16:00。采用人工清粪和刮粪机相结合,刮粪板自动清理时间为每天16:00-17:00,人工打扫猪栏时间为每天07:00-9:00和15:00-16:00。
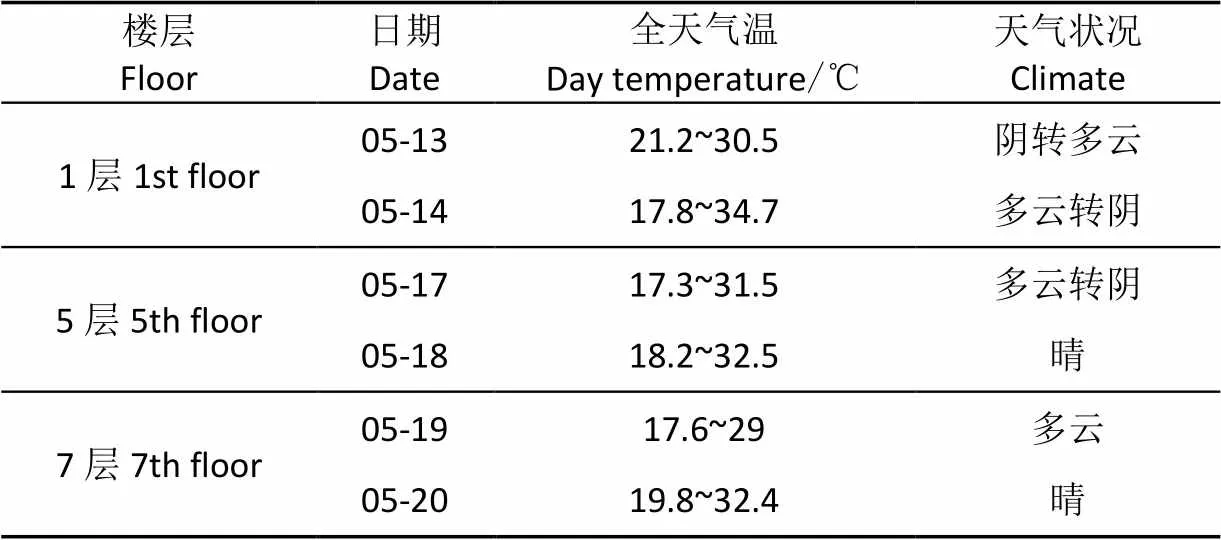
测量前期使用氦气球搭载无线传感器测点对每栋楼外部环境进行了预测量,发现4栋楼外部环境差异很小。表2所示为3层猪舍监测期间的外部天气情况。因测量时间为第1天09:00到第2天09:00,因此取第1天白天外部天气的最大值和第1天夜间至第2天白天外部天气的最小值为监测期间外部温度范围,1层外部气温为17.8~30.5 ℃,5层外部气温为17.3~31.5 ℃,7层外部气温为17.6~29 ℃。3层猪舍在试验期间外部气温范围近似。

表2 舍外天气
注: 依据福建省尤溪县气象局统计结果。
Note: According to statistical results from the weather bureau of Youxi County , Fujian Province.
3层猪舍均采用负压纵向通风模式。由图3可知,1层、5层猪舍通风设计完全相同,每侧墙开窗4扇,共8扇,每扇尺寸为长0.8 m,宽0.3 m;每侧墙各有4台30英寸风机(Munters EM30,蒙特,北京);两侧端墙共装有9台50英寸风机(Munters EM50);两侧墙各装有长30 m,宽2.3 m湿帘。其中,5层楼房猪舍的湿帘用塑料纸密封没有使用。7层通风系统同为纵向通风,安装方法稍有不同。两侧墙对称安装有4台风机50英寸(Munters EM50)和12台30英寸风机(Munters EM30);一侧端墙装有5台50英寸风机(Munters EM50);另一侧端墙装有长15 m,宽2.3 m湿帘,侧墙开窗在监测期间全部关闭。7层和1层、5层的通风系统稍有不同,7层内气流纵向穿过整个猪舍,1层和5层气流从楼层中部进入,两端墙排出,与1层、5层对比,7层多4台30英寸风机。理论上气流在1层、5层中移动距离为7层的一半,环境分布应较7层均匀,但是实际环境均匀性还与通风率大小相关。监测期间,根据工作人员经验结合舍内环境温度判断控制舍内机械设备的运行,并未同时全部开启所有设备。
每个猪舍的测量时间均为从第1天的上午9:00至第2天的上午09:00。1层、5层、7层猪舍测量时间分别为2017年5月13-14日,17-18日和19-20日。由于育肥猪体高通常小于1 m,所有无线测点的安装高度距离地面1.2 m,尽量接近猪生活区同时防止猪咬坏。由于1层、5层猪舍走廊在楼层中间,通风系统基本对称,采用不对称放置无线传感器测点于走廊两侧的猪生活区中,尽可能多地获取纵向不同位置的环境参数。7层猪舍走廊紧靠侧墙,因此传感器测点均匀放置于纵向猪生活区中,并保证传感器网络测点距离端墙的最小距离相同。每个无线测点每5 min自动测量一组温、湿度、CO2和NH3数据并发送,每组测量连续读取传感器数据6次取平均值。舍内外压差每小时人工测量1次。各层猪舍通风设备及无线测点的部署位置如图3所示。

图3 3个楼层传感器测点布置平面示意图
1.3 数据处理及温湿度指标(THI)计算方法
计算每楼层所需通风率,对采集到的数据进行统计学分析和THI计算,分为4个步骤。
1)计算每楼层所需通风率。根据美国猪舍建筑及设备手册(MWPS-8),前保育猪(5.4~13.6 kg)夏季所需通风率为每头117.99×10⁻⁴m3/s,生长猪(34.0~68.0 kg)夏季所需通风率为每头353.96×10⁻⁴m3/s。各楼层所需通风率计算方法为单头猪所需通风率×楼层猪头数。1层猪舍所需通风率为353.96×10-4m3/s×955 =33.80 m3/s,5层猪舍所需通风率为117.99×10-4m3/s×1 960 =23.13 m3/s,7层猪舍所需通风率为353.96×10-4m3/s×940 = 33.27 m3/s。
2)计算每楼层环境参数包括平均值(±标准差)、最小值、最大值、最大差值和同期最大差值在内的统计学参数。每5 min采样1次,取所有测点的所有该参数采样值的平均值为该参数的平均值。对每个测点的每个环境参数测量数据取15 min平均值,取所有测点同一环境参数全天中15 min均值的最大值为该参数最大值,取15 min均值中的最小值为最小值,取该参数最大值和最小值的差值为最大差值。以15 min平均值为基准,每15 min计算7个测点同一参数的最大值和最小值之差作为同期差值,全天24 h内同期差值的最大值即为同期最大差值,同期最大差值反映了同一时刻环境分布的不均匀性。
3)进行差异性分析。使用SPSS软件(SPSS 22.0,IBM,美国)逐次检验任意2楼层同一参数均值组间水平的差异性是否显著。检验不同楼层温度、湿度、CO2、NH3浓度的数组间的方差齐性,当数组间方差齐时,使用LSD法;当数组间方差不齐时,使用Tamhane’s T2法。检验同一楼层的7个部署测点的温度、湿度、CO2、NH3浓度的数组间的差异性分析。
4)THI计算。取温、湿度15min平均值计算环境中THI,评判猪舍环境的舒适性。采用文献[41]中THI计算公式,见式(1)。结合汪开英[42-43]研究得到的THI标准,THI<28.06为舒适区;THI>28.06,猪只可能会出现热应激反应;THI>28.94时为过热区,猪只出现明显的热应激反应。

式中、分别为舍内空气的干球温度(℃)和湿球温度(℃),湿球温度可由环境温度和相对湿度通过焓湿图求得,公式在相对湿度大于30%时成立。本监测中猪舍所在地区平均海平面高度190 m,大气压取为98.7 kPa。
2 结果与分析
2.1 各楼层通风率分析
从动物头数来看,5层保育猪的头数(1960头)远大于1层(955头)和7层(940头)生长猪头数,但所需通风率5层(23.13 m3/s)小于1层(33.80 m3/s)和7层(33.27 m3/s)。由于所需通风率与动物的代谢发热量,水蒸气排放量,CO2排出量综合相关[44],实际在3个楼层环境对比时,不以动物的头数和质量作为对比的依据,而以实际通风水平是否达到该层动物热、湿、CO2排放所需的通风率为依据,将各楼层的通风情况统一划分为欠通风、合适通风和过通风3种通风水平。对比在不同通风水平下各楼层内的环境参数。
参考美国猪舍建筑及设备手册(MWPS-8),依据猪舍内风机开启情况,实际进气口面积和舍内外静压差对监测期间每楼层的实际通风率进行计算,各楼层通风情况如表3所示。

表3 3个楼层的通风情况
注: A风机,Munters EM30,30英寸风机,根据风机的损耗和维护情况,通常将风机的效率设定为70%,下同,静压差为0时,通风率为3.75 m3·s-1×70%= 2.625 m3·s-1;为25 Pa时,通风率为3.17 m3·s-1×70%=2.219 m3·s-1;B风机,Munters EM50,50英寸风机,静压差为0 时,通风率为11.70 m3·s-1×70%=8.19 m3·s-1;25 Pa通风率为10.57 m3·s-1×70%=7.399 m3·s-1;总进风口面积=开窗面积+湿帘面积。
Note: Fan A, Munters EM30, 30 inch fan, according to service life and maintenance of fan, normally the efficiency of fans is set to 70%, the same as below, ventilation rate under a static pressure difference of 0 is 3.75 m3·s-1×70%=2.625 m3·s-1; the ventilation rate under 25 Pa is 3.17 m3·s-1×70%=2.219 m3·s-1; Fan B, Munters EM50, 50 inch fan, ventilation rate under a static pressure difference of 0 is 11.70 m3·s-1×70%=8.19 m3·s-1; ventilation rate under 25 Pa 10.57 m3·s-1×70%=7.399 m3·s-1; total inlet area =open window areas + evaporative pad areas.
图4为监测24 h期间3个楼层的实际运行通风率与所需通风率对比,二栋1层白天过通风,夜间欠通风;总体上四栋5层连续24 h欠通风,夜间21:00-06:00欠通风严重;一栋7层白天过通风,夜间合适通风。1层、5层的通风系统相同,操作运行方式不同,通风率差异较大。在监测期间外部温度范围相似,7层的整体通风运行情况优于1层、5层,其中的通风运行情况最差。

图4 各时段3个楼层的实际通风率
2.2 温湿度及有害气体分析
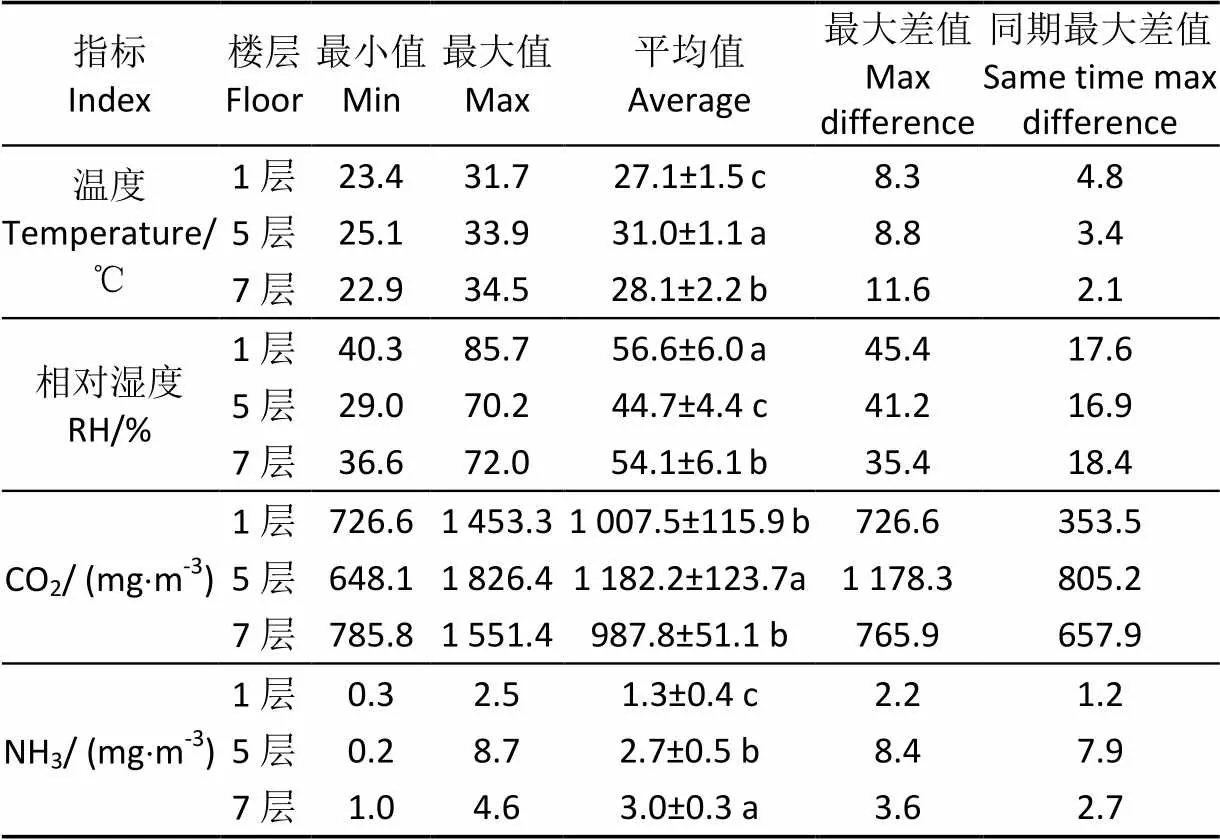
3个楼层猪舍的环境参数的统计学分析指标如表4所示。5层温度最小值、平均值均高于其他楼层,尤其是夜间的最低温度高于其他楼层1.7 ℃以上。5层猪舍由于欠通风致使舍内热量较难排出,对舍内温度影响较大。7层的通风情况优于其他楼层,舍内同期最大差值最小为2.1 ℃,温度均匀性较好,但受白天层顶辐射影响,在外部最高温度(29 ℃)略小于其他楼层(30.5和31.5 ℃)的情况下白天温度最大值为3层中最高(34.5 ℃)比1层高出2.8 ℃,舍内温度最大差值高达11.6 ℃,昼夜温差大。1层白天温度最大值较其他楼层低2 ℃以上,舍内7个测点的最大差值最低,昼夜温差小,与1层直接和楼底地面接触,地面热阻大的特性相符。该层舍内同期最大差值最高,表明温度均匀性差。从湿度数据来看,1层的相对湿度最大值(85.7%)、最小值(40.3%)、平均值(56.6%)均高于其他楼层,可能受楼底湿度影响较大。

表4 3个楼层综合环境因子测量数据
注: 同列中指标不同字母表示差异显著(<0.05),标有相同字母表示差异不显著(>0.05)。
Note: Different letters at the same column of each index indicate significant differences (<0.05), same letters indicate no significant difference (>0.05).
猪舍内CO2浓度主要产生于动物的呼吸和粪便的分解,靠通风系统排出,各楼层内的CO2浓度远低于健康限值(3 024.3mg/m3)及最高浓度限值(9 819.3 mg/m3)。根据文献[45],保育猪的CO2排放量为每头0.86 kg /d,生长猪CO2排放量为每头2.67 kg /d。估算每楼层CO2总排出量约为1层(2.67 kg/d×955=2 549.9 kg/d)>7层(2.67 kg/d×940=2 509.8 kg/d)>5层(0.86 kg/d×1 960= 1 685.6 kg/d)。受欠通风影响,5层在总排出量最低的情况下,CO2浓度平均值、最大值、最大差值、同期最大差值均高于其他楼层,CO2分布不均匀,且较难排出。
猪舍内NH3浓度主要来源于尿液中的尿素快速水解[24],受楼层猪舍排尿系统布置及通风情况影响较大。各楼层使用尿管排尿,其中2-7层各尿管汇总后从2层排出,每层尿管在舍内汇集处敞开,导致多层尿液中散发出的NH3经尿管开口处扩散至2-7层猪舍内,因此5层和7层NH3浓度较高,而1层为单独排尿管,尿液通过封闭尿管流出舍外,NH3浓度较低。监测期间各楼层猪舍普遍NH3浓度不高,基本低于健康限值(8.4mg/m3),远低于最高浓度限值(19.0mg/m3)。受欠通风影响,5层NH3浓度最大值、最大差值、同期最大差值均高于其他楼层,NH3分布不均匀。7层的NH3浓度平均值略高于5层,但最大值、最大差值、同期最大差值均低于5层,均匀性较5层优,与通风水平相符。由于1层尿液单独排出不受其他楼层尿液影响,故NH3浓度最小。
对不同楼层之间的全天环境参数平均值进行差异性分析,结果如表4所示。不同楼层的均值除了1层与7层CO2浓度差异性不显著(>0.05),其他不同楼层间均值差异性显著(<0.05)。表5为每楼层各测点位置全天的环境参数均值及测点间参数差异性分析。同楼层相邻位置测点出现某些参数差异性显著,某些参数差异性不显著,各测点位置间环境参数异差性情况各异,如1层中1#与2#的温、湿度差异性不显著(>0.05),但是CO2和NH3浓度差异性显著(<0.05)。结果显示温、湿度场,CO2和NH3浓度场由于产生源头和变化的诱因各不相同引起在同楼层猪舍内测点间差异性及分布情况各异。其中同层中温、湿度分布场受通风率,气流方向,猪散热及呼吸,外部环境等影响较大。而CO2浓度场受动物呼吸排出量,通风率,气流方向影响较大,NH3浓度场受粪尿排放方式,温度,通风率,气流方向等影响[45]。

表5 3个楼层7个测点的环境因子的均值差异性分析
注: 同一行标有不同字母表示差异显著(<0.05),标有相同字母表示差异不显著(>0.05),下同。
Note: Different letters marked at the same row indicate significant differences (<0.05), same letters indicate no significant difference (>0.05), the same as below.
2.3 温湿度指标(THI)分析
用每15 min温湿度均值计算每测点位置在监测期间的THI,如图5所示,THI在28.94之上为过热区,在28.06以下为舒适区。5层通风运行情况最差,1#和2#测点(靠近一侧端墙风机区域)从第1天11:00至第2天09:00时间段内,连续12 h以上THI>28.06。几乎全部测点在15:00-20:00时间段THI>28.06,平均值27.9±0.8接近舒适区上限。通过2.1小节中的分析得知7层通风运行最优,该层下午时段12:00-18:00间大部分测点位置处于THI>28.06,13:00-16:00时段2#、5#、7#测点(猪舍中部大部分位置)THI>28.94。1层只有在15:00-18:00时间段内1#和2#测点THI值(靠近一侧端墙风机区域)超出适宜范围,其余测点THI值均在适宜范围内。

图5 3个楼层的THI指标
表6中为3个楼层的THI指标分析。5层的THI指标最差,平均值接近舒适区上限。1层不同测点测得THI最大差值最高为7.1,但由于1层的5个测点测得的THI均未超过热应激区域指标,平均值较低为24.9,环境舒适性仍然较5层和7层优。现场猪舍工作人员证实1层猪舍为3层猪舍中猪死亡率最低。

表6 3个楼层的THI指标分析
3个楼层的不同测点间的THI差异性分析如表7所示。

表7 每楼层不同测点THI指标差异性分析
同一楼层多个不同部署测点间的THI均值差异性显著,如1层的1#与3#-7#的THI均值差异性显著(<0.05),5层的1#与2#-4#的THI均值差异性显著(<0.05),7层的1#与2#-3#的THI均值差异性显著(<0.05)。各楼层环境舒适性分布不均且无规律。
根据以上分析,通风水平是影响猪舍内部环境的主要因素,其次为楼层差异。猪舍夏季通风时必需保持实际通风率不小于设计通风率。楼层猪舍的顶层受太阳辐射影响较大,需要增加顶层屋顶的保温和防辐射措施。底层受地面保温性的影响,在高温天气下舍内温度不高;但地底湿气导致舍内湿度大,可采用加大通风率的方法排出空气中多余水分。
3 结 论
本文采用无线传感网络,部署7个无线测点分别对楼房猪舍的顶层、中间层和底层的热环境和有害气体分别进行连续24 h监测,对数据进行分析并计算温湿度指标(THI),结论如下:
1)对比每楼层实际通风率与所需通风率(每楼层实际猪头数Í夏季每头猪所需通风率),将通风情况划分为欠通风、合适通风和过通风3种水平。5层(中间层)欠通风严重, THI指标整体偏高,平均值(27.9±0.8)接近舒适区上限。7层(顶层)通风最优但受辐射影响,白天温度最大值比底层高2.8 ℃,昼夜最大温差达11.6 ℃。1层(底层)通风较7层差,较5层优,但保温性好湿气大,温度整体较低,昼夜温差较小,相对湿度高达85.7%,由于温度较低THI均值为24.9,环境为3层中最佳。影响THI指标的2个主要因素分别为通风水平和楼层差异。
2)夏季通风条件下,各楼层内的CO2和NH3浓度远低于最高浓度限值。5层在3个楼层中估算CO2总排出量最低(1 685.6 kg/d),但其受欠通风影响舍内CO2浓度均值最高且浓度分布不均。由于各楼层使用尿管排尿,尿液基本不在舍内停留,各楼层猪舍NH3浓度普遍不高。1层猪舍尿液通过封闭尿管排出舍外,尿管在舍内没有开口,NH3浓度最低。总体来说,CO2受通风水平影响大,NH3浓度则受通风和尿排出方式两者影响较大。
3)从环境分布来看,不同楼层间温热和有害气体环境存在差异,不同楼层的均值除了1层与7层CO2浓度差异性不显著(>0.05),其他不同楼层间均值差异性显著(<0.05)。同一层猪舍不同测点位置环境也存在差异,如1层中1#与2#的CO2和NH3浓度差异性显著(<0.05)。
本文通过对集约化楼房猪舍环境的温湿度、CO2、NH3的监测结果分析,深入了解楼房猪舍养殖生产过程中存在的环境控制问题,帮助找出楼房养猪机械通风设计及操作运行情况存在的不足,为提高楼房养猪环境控制水平提供理论依据。
[1] 前瞻研究院. 多项环保政策密集出台我国环境监测行业前景利好[J]. 化学分析计量,2017,26(4):100.
[2] Rowsell H C. A guide to environmental research on animals[J]. The Canadian Veterinary Journal, 1972, 13(8): 196.
[3] 董红敏,李玉娥,陶秀萍,等. 中国农业源温室气体排放与减排技术对策[J]. 农业工程学报,2008,24(10):269-273.
Dong Hongmin, Li Yu’e, Tao Xiuping, et al. China greenhouse gas emissions from agricultural activities and its mitigation strategy[J]. Transactions of the Chinese Society of Agricultural Engineering (Transactions of the CSAE), 2008, 24(10): 269-273. (in Chinese with English abstract)
[4] Philippe F X, Canart B, Laitat M, et al. Gaseous emissions from group-housed gestating sows kept on deep litter and offered an ad libitum high-fibre diet[J]. Agriculture Ecosystems & Environment, 2009, 132(1): 66-73.
[5] Hou J, Xie Y, Wang F, et al. Greenhouse gas emissions from livestock waste: China evaluation[J]. International Congress, 2006, 1293: 29-32.
[6] 李娜,董红敏,朱志平,等. 夏季猪场污水贮存过程中CO2、CH4排放试验[J]. 农业工程学报,2008,24(9):234-238.
Li Na, Dong Hongmin, Zhu Zhiping, et al. Carbon dioxide and methane emission from slurry storage of swine farm in summer[J]. Transactions of the Chinese Society of Agricultural Engineering (Transactions of the CSAE), 2008, 24(9): 234-238. (in Chinese with English abstract)
[7] Stinn J P, Xin H, Shepherd T A, et al. Ammonia and greenhouse gas emissions from a modern U.S. swine breeding- gestation-farrowing system[J]. Atmospheric Environment, 2014, 98: 620-628.
[8] Rong L, Liu D, Pedersen E F, et al. Effect of climate parameters on air exchange rate and ammonia and methane emissions from a hybrid ventilated dairy cow building[J]. Energy & Buildings, 2014, 82: 632-643.
[9] 董红敏,朱志平,陶秀萍,等. 育肥猪舍甲烷排放浓度和排放通量的测试与分析[J]. 农业工程学报,2006,22(1):123-128.
Dong Hongmin, Zhu Zhiping, Tao Xiuping, et a1. Measurement and analysis of methane concentration and flux emitted from finishing pig house[J]. Transactions of the Chinese Society of Agricultural Engineering (Transactions of the CSAE), 2006, 22(1): 123-128. (in Chinese with English abstract)
[10] 朱志平,董红敏,尚斌,等. 妊娠猪舍氨气及氧化亚氮浓度测定与排放通量的估算[J]. 农业工程学报,2006,22(14):175-178.
Zhu Zhiping, Dong Hongmin, Shang Bin, et a1. Measurement of ammonia and nitrous oxide concentrations and estimation of the emission rates from gestation pig buildings[J]. Transactions of the Chinese Society of Agricultural Engineering (Transactions of the CSAE), 2006, 22(14): 175-178. (in Chinese with English abstract)
[11] Sousa P D, Pedersen S. Ammonia emission from fattening pig houses in relation to animal activity and carbon dioxide production[J]. Agricultural Engineering International: The CIGR Journal of Scientific Research and Development, 2004, 6(3): 1-13.
[12] Li H, Xin H, Liang Y, et al. Comparison of direct vs. indirect ventilation rate determinations in layer barns using manure belts[J]. American Society of Agricultural Engineers (Transactions of the ASAE), 2005, 48(1): 367-372.
[13] Heber A J, Bogan B W, Ni J Q, et al. The national air emissions monitoring study: Overview of barn sources[C]// Central Theme, Technology for All: Sharing the Knowledge for Development. Proceedings of the International Conference of Agricultural Engineering, Brazilian Congress of Agricultural Engineering, International Livestock Environment Symposium - Iles Viii. 2008: 199-205.
[14] Heber A J, Ni J Q, Lim T, et al. Quality assurance project plan for the national air emissions monitoring study (barns component)[C]// Agriculture Air Research Council, Purdue University Department of Agricultural and Biological Engineering. Purdue Agricultural Air Quality Laboratory (PAAQL), 2008: 50-62.
[15] Sun G, Guo H, Peterson J, et al. Diurnal odor, ammonia, hydrogen sulfide, and carbon dioxide emission profiles of confined swine grower/finisher rooms[J]. Journal of the Air & Waste Management Association, 2008, 58(11): 1434-1448.
[16] Kim K Y, Ko H J, Lee K J, et al. Temporal and spatial distributions of aerial contaminants in an enclosed pig building in winter[J]. Environmental Research, 2005, 99(2): 150-157.
[17] Elenbaasthomas A M, Zhao L Y, Hyun Y, et al. Effects of room ozonation on air quality and pig performance[J]. American Society of Agricultural Engineers (Transactions of the ASAE), 2005, 48(3): 1167-1173.
[18] Lim T T, Heber A J, Ni J Q, et al. Odor impact distance guideline for swine production systems[J]. Proceedings of the Water Environment Federation, 2000: 773-788.
[19] 北京市农林科学院畜牧兽医研究所.规模猪场环境参数及环境管理:GB/T 17824.3-2008[S]. 北京:中国标准出版社,2008.
[20] Day D L, Hansen E L, Anderson S. Gases and odors in confinement swine buildings[J]. American Society of Agricultural Engineers (Transactions of the ASAE), 1965, 8: 118-121.
[21] Kliebenstein J. Iowa concentrated animal feeding operation air quality study[R]. Iowa: Iowa State University and the University of Iowa Study Group, 2002.
[22] Philippe F X, Nicks B. Review on greenhouse gas emissions from pig houses: Production of carbon dioxide, methane and nitrous oxide by animals and manure[J]. Agriculture Ecosystems & Environment, 2014, 199: 10-25.
[23] Zong C, Zhang G, Feng Y, et al. Carbon dioxide production from a fattening pig building with partial pit ventilation system[J]. Biosystems Engineering, 2014, 126(10): 56-68.
[24] Cortus E L, Lemay S P, Barber E M, et al. A dynamic model of ammonia emission from urine puddles[J]. Biosystems Engineering, 2008, 99(3): 390-402.
[25] Arogo J, Westerman P W, Heber A J. A review of ammonia emissions from confined swine feeding operations[J]. American Society of Agricultural Engineers (Transactions of the ASAE), 2003, 46(3): 805-817.
[26] Hayes E T, Curran T P, Dodd V A. Odour and ammonia emissions from intensive pig units in Ireland[J]. Bioresource Technology, 2006, 97(7): 940-948.
[27] Zong C, Li H, Zhang G. Ammonia and greenhouse gas emissions from fattening pig house with two types of partial pit ventilation systems[J]. Agriculture Ecosystems & Environment, 2015, 208: 94-105.
[28] 汪开英,代小蓉,李震宇,等. 不同地面结构的育肥猪舍NH3排放系数[J]. 农业机械学报,2010,41(1):163-166.
Wang Kaiying, Dai Xiaorong, Li Zhenyu, et al. NH3emission factors of fattening pig buildings with different floor systems[J]. Transactions of the Chinese Society for Agricultural Machinery, 2010, 41(1): 163-166. (in Chinese with English abstract)
[29] 代小蓉,Ni J Q,潘乔纳,等. 华东地区典型保育猪舍温湿度和空气质量监测[J]. 农业机械学报,2016,47(7):315-322.
Dai Xiaorong, Ni J Q, Pan Qiaona, et al. Monitoring of tempreature, humidity and air quality inside pig weaner house in eastern china[J]. Transactions of the Chinese Society for Agricultural Machinery, 2016, 47(7): 315-322. (in Chinese with English abstract)
[30] Phillips V R, Holden M R, Sneath R W, et al. The development of robust methods for measuring concentrations and emission rates of gaseous and particulate air pollutants in livestock buildings[J]. Journal of Agricultural Engineering Research, 1998, 70(1): 11-24.
[31] Demmers T G M, Burgess L R, Short J L, et al. Ammonia emissions from two mechanically ventilated UK livestock buildings[J]. Atmospheric Environment, 1999, 33(2): 217-227.
[32] Heber A J, Ni J Q, Haymore B L, et al. Air quality and emission measurement methodology at swine finishing buildings[J]. American Society of Agricultural Engineers (Transactions of the ASAE), 2001, 44: 1765-1778.
[33] Philippe F X, Laitat M, Canart B, et al. Comparison of ammonia and greenhouse gas emissions during the fattening of pigs, kept either on fully slatted floor or on deep litter[J]. Livestock Science, 2007, 111(1/2): 144-152.
[34] Ni J Q, Heber A J, Darr M J, et al. Air quality monitoring and on-site computer system for livestock and poultry environment studies[J]. Agricultural and Biosystems Engineering, 2009, 52(3): 937-947.
[35] Hwang J H, Yoe H. Design and implementation of ubiquitous pig farm management system using IOS based smart phone[C]// International Conference on Future Generation Information Technology. 2011: 147-155.
[36] Duan Y, Ma L, Zhang C, et al. A remote monitoring system for physiology and environmental information in pig farming[C]//ASABE Annual International Meeting Paper. 2014: 1-9.
[37] 朱虹,李爽,郑丽敏,等. 生猪养殖场无线传感器网络路径损耗模型的建立与验证[J]. 农业工程学报,2017,33(2):205-212.
Zhu Hong, Li Shuang, Zheng Limin, et al. Modeling and validation on path loss of WSN in pig breeding farm[J]. Transactions of the Chinese Society of Agricultural Engineering (Transactions of the CSAE), 2017, 33(2): 205-212. (in Chinese with English abstract)
[38] Bo L, Zheng H, Lin Y, et al. Design of environmental monitoring and control system for large-scale pig house with fermentation bed[J]. Agricultural Science & Technology, 2015, 40(2): 391-399.
[39] 朱伟兴,戴陈云,黄鹏. 基于物联网的保育猪舍环境监控系统[J]. 农业工程学报,2012,28(11):177-182.
Zhu Weixing, Dai Chenyun, Huang Peng. Environmental control system based on IOT for nursery pig house[J]. Transactions of the Chinese Society of Agricultural Engineering(Transactions of the CSAE), 2012, 28(11): 177-182. (in Chinese with English abstract)
[40] Hwang J, Yoe H. Study of the ubiquitous hog farm system using wireless sensor networks for environmental monitoring and facilities control[J]. Sensors, 2010, 10(12): 10752-10777.
[41] National Research Council. Effect of Environment on Nutrient Requirements of Domestic Animals[M]. Washington: National Academy Press, 1981.
[42] 汪开英. 华东南地区猪的热调节行为与湿热环境相关性的研究[D]. 杭州:浙江大学,2001.
Wang Kaiying. Study on the Correlation Between Heat Regulation Behavior and Humid and Hot Environment in Southeast China[D]. Hangzhou: Zhejiang University, 2001. (in Chinese with English abstract)
[43] 汪开英. 育成猪的体温与猪舍温湿度指标(THI)的相关性研究[J]. 浙江大学学报:农业与生命科学版,2003,29(6):675-678.
Wang Kaiying. Study on the relationship between body temperature of growing pigs and temperature-humidity index of pig housing. Journal of Zhejiang University: Agriculture and Life Sciences, 2003, 29(6): 675-678. (in Chinese with English abstract)
[44] Iowa State University . MWPS-8 Swine housing and equipment handbook[M]. Iowa: Midwest Plan Service, 1983: 2-111.
[45] Philippe F X, Nicks B. Review on greenhouse gas emissions from pig houses: Production of carbon dioxide, methane and nitrous oxide by animals and manure[J]. Agriculture Ecosystems & Environment, 2015, 199(199): 10-25.
Monitoring and analysis of thermal environment and harmful gases in mechanically ventilated multistory pig buildings
Gao Yun1,2, Diao Yaping1, Lin Changguang3, Liu Yaxuan3, Guo Changming3, Lei Minggang2,4,Tong Yu1,2, Li Xuan1,2
(1430070; 2430070,; 3365106,; 4430070,)
With the intensive introduction of policies and acts for environmental protection, the farming land shortage situations for domesticated animals are increasingly serious. Innovational multistory pig buildings are introduced to save land resources and thus increase breeding intensities. The following awareness and concerns towards air qualities of animal occupant zones on each floor are being raised among pig producers. In this paper, a wireless sensor network for collecting environmental factors was used to monitor the thermal environments and harmful gases of three representative floors in multistory pig buildings, which were the top floor (7thfloor), the middle floor (5thfloor) and the ground floor (1stfloor). According to the heads of animals and their weights on these representative floors, the ventilation situations were determined to be the less-ventilated, the well-ventilated and the over-ventilated levels by comparing the actual ventilation rates with the floor’s desired ventilation rates. Therefore, the differences of indoor environments between various floors and between multi-locations on the same floor were analyzed with respect to each floor’s ventilation levels, which eventually revealed the practices of indoor environment in multistory pig buildings. The monitoring was conductedfrom the 11thto 21stMay 2017 inFujian province, located in southern China. Seven wireless sensor nodes were deployed on the top, ground and middle floors respectively. Each floor was monitored over 24 hours, from 9 am of the first day to the same 9 am of the next day. The results were summarized as follows: 1) Ventilation levels had a crucial impact on thermal environments.The less-ventilated levels of the 5th floor made the temperature-humidity indexes (THIs) higher than those of other floors, with an average value of 27.9 ± 0.8 close to the upper limit of comfort zone, 28.06. The radiation effects on the top floor increased the maximum temperature value of this floor to 34.5 ℃, 2.8 ℃ higher than that of the ground floor, with a highest day-night temperature difference up to 11.6 ℃. The temperature of the ground floor was kept in a comfortable range with a smaller day-night temperature difference due to the better thermal insulation of its floor, whereas the relative humidity was increased to a maximum of 85.7% by the moisture from the underlying surface, which was integrated to an average THI of 24.9. 2) The overall concentrations of CO2and NH3on each floor, under the summer ventilation conditions, were far less from the upper concentration limits. The maximum value, average value, maximum difference, and the same time maximum difference of the CO2concentrations on the 5thfloor were higher than those of other floors, contrasting with the lowest approximated CO2emission of 1685.6 kg/d among those of three floors, which was due to its less-ventilated levels in 24 hours. The constitution of the buildings’ urinary collecting duct system influenced the NH3concentrations dominantly, the lowest concentrations of NH3on the ground floor benefited from the isolation of its urinary ducts from other floor’s system. 3) The difference analyses between average environmental factors of various floors and between the environmental factors of different locations on the same floor were conducted. Highly significant differences (<0.05) were found in most environmental factors of different floors except there was no significant difference of CO2concentrations between the 1stfloor and the 7thfloor. The significant differences (<0.05) were found in some environmental factors between different locations on each floor, while no significant differences (> 0.05) existed among other factors. Mechanically ventilated multistory pig buildings are innovative in China at present. To gain a deep understanding of animal occupant zone environments in multistory pig buildings, and further help to find design flaws of mechanical ventilation systems and disadvantages of operation strategies, the monitoring and analysis of thermal environments and harmful gases have been carried out in the multistory pig buildings during pig production, which would build up the theoretical basis and principles to improve environmental control levels of multistory pig buildings.
temperature; humidity; ventilation; multistory pig building; thermal environment; toxic gases; THI; difference analysis
2017-10-09
2018-01-16
“十三五”国家重点研发计划项目(2016YFD0500506);现代农业技术体系(CARS-35);福建省科技重大专项(2012NZ0003-3);中央高校自主创新基金(2662017PY086)
高云,女,湖北武汉人,副教授,博士,主要从事农业智能检测与控制方面的研究。Email:angelclouder@mail.hzau.edu.cn。中国农业工程学会会员:高云(E041700006M)
10.11975/j.issn.1002-6819.2018.04.029
TP391
A
1002-6819(2018)-04-0239-09
高 云,刁亚萍,林长光,刘亚轩,郭长明,雷明刚,童 宇,黎 煊. 机械通风楼房猪舍热环境及有害气体监测与分析[J]. 农业工程学报,2018,34(4):239-247.doi:10.11975/j.issn.1002-6819.2018.04.029 http://www.tcsae.org
Gao Yun, Diao Yaping, Lin Changguang, Liu Yaxuan, Guo Changming, Lei Minggang, Tong Yu, Li Xuan. Monitoring and analysis of thermal environment and harmful gases in mechanically ventilated multistory pig buildings[J]. Transactions of the Chinese Society of Agricultural Engineering (Transactions of the CSAE), 2018, 34(4): 239-247. (in Chinese with English abstract) doi:10.11975/j.issn.1002-6819.2018.04.029 http://www.tcsae.org
