Five characteristics of China textile industry performance in 2017
2018-02-25ByZhaoZihan
By+Zhao+Zihan
According to the 2017 Summary Conference of China National Textile and Apparel Council(CNTAC) held on January 22nd to 23rd, in the first 11 months of 2017, the overall operation of Chinas textile industry showed a steady growth rate, stable domestic demand growth, recovering overseas market demand, active investment in the east and steady improvement in performance. Specifically speaking, the improved performance, high capacity utilization, rising consumer spending, and the the conversion of former and present driving forces showcased the industrys high-quality development.
Steady growth rate
According to statistics from Institute of Industrial Economics, CNTAC, in the first 11 months of 2017, Chinas industrial added value growth rate was 6.6%, manufacturing growth rate 7.7% and textile industry growth rate 4.9%. The value-added growth of the textile industry slowed gradually from 6.7% in February 2016 to 4.9% in December 2016; since 2017, the growth rate has steadily stabilized and reached 4.8% for the full year of 2017. The development of Chinas textile industry has basically shifted from a transition period to a smooth period. In the various sub-branches of textile industry, the growth of home textiles, garments and chemical fiber industries increased sharply, with the growth rates of 9.3%, 6.0% and 5.4% respectively.
Stable domestic demand growth
In 2017, the retail sales of garments, hats, shoes, and knitwear amounted to 1,455.7 billion RMB, up 7.8% year on year, an increase of 0.8 percentage point from the previous year, and it is the first increase in seven years. (Fig. 1)
According to a preliminary estimate by CNTAC, in 2017, the trade volume of e-commerce in Chinas textile industry is about 5.34 trillion RMB, up 20% over the same period of last year. It can be seen that the scale of e-commerce transactions in the textile industry maintained a steady growth at a relatively high speed. (Fig. 2)
The urbanization rate in China has continued to increase from 45.9% in 2007 to 58.5% in 2017. Since there is a gap between urban and rural areas in the expenditure on clothing, the overall expenditure on clothing will continue to grow as the urbanization rate continues to rise.
Recovering overseas market demand
In 2017, the global economy grew by 3.6%, up 0.4% from the previous year. Three-quarters of the countries in the world achieved positive growth, enjoying recovery. Global trade increased by 4.2%, a growth of 1.8 percentage points over the previous year. Trade growth was better than economic growth, presenting a more clearly trend that recovering market demand has been advancing economic recovery.endprint
In 2017, Chinas textile and garment exports reached 266.95 billion USD, an increase of 1.53% year on year, reversing the negative growth for two consecutive years. The external demand market rebounded significantly.
In relation to the volume and value of textile and apparel exports, the overall trend is increase in volume and decrease in value. From January to November 2017, the volume of Chinas textile and apparel exports increased by 6.63% year on year, reversing the negative growth in two years; the drop in export prices narrowed to -6.3%.
In Chinas textile and apparel export market structure, exports textile and apparel products to the countries and regions along the Belt and Road accounted for 33.36% of the total, with 18.09%, 17.43% and 7.8% respectively to Europe, the United States and Japan.(Fig. 3)
EU market
From January to November 2017, the EU imported 105.26 billion euros of textile and apparel, up 1.78% year on year, reversing the negative growth of the previous year. The EU textile and garment import growth rate presents such a trend as firstly a continuous dropping from February 2016 to March 2017 when the rate dropped to the bottom, and then the decline was gradually narrowed until June 2017 when the negative growth was reversed with a stabilized growth rate at about 2%.
US market
From January to November 2017, the United States imported 98.38 billion USD of textile and apparel, an increase of 1.24% year on year, reversing the negative growth of the previous year. Judging from the growth rate of the US textile and apparel imports, the decline has continued to deepen from March 2016 to February 2017, after which the decline has been gradually narrowed until negative growth is reversed in October 2017, achieving positive growth.
Japanese market
From January to November 2017, Japan imported 3.7051 trillion yen of textile and apparel, an increase of 4.04% from a year earlier, reversing the negative growth of the previous year. Judging from the growth rate of Japans textile and apparel imports, the decline kept on dropping from March 2016 to October 2016, after which the decline narrowed gradually until July 2017, reversing negative growth and maintaining steady growth.
Markets along the Belt and Road
From January to November 2017, Chinas textile and clothing exports to the countries and regions along the Belt and Road reached 83.435 billion USD, up 3.11% year on year, reversing the negative growth for two years. Among them, the top five markets are Vietnam, Russia, the Philippines, Bangladesh and the UAE, with a total export of 35.34 billion USD, accounting for 42.4% of the total exports of textile and apparel to the countries and regions along the Belt and Road. The growth of the export of textile and clothing along the Belt and Road is higher than the growth of export of the industry, accounting for more than onethird of the total.endprint
Active investment in the east
From January to November 2017, the fixed investment of Chinas textile industry was 1230.93 billion yuan, a year-on-year increase of 6.29%. In terms of the regional structure, the growth rate of investment in the eastern region was 8.7%, an acceleration of 4.5 percentage points over the same period of the previous year and accounting for 80.1% of the national investment increase. The relatively high growth rate in the eastern part of the country based on lower new capacity shows that the enterprises are of high enthusiasm in putting investment into transformation and upgrading. (Table 1)
Except for the chemical fiber industry, the growth rate of investment in the front-end industries of the industry chain decreased from the same period of the year earlier. The investment growth rate of the three major downstream industries increased over the previous year. The total investment in the three downstream industries totaled 597.04 billion yuan, accounting for 48.5% of the total investment in the industry. The investment growth was 6.0%, 25.8% and 4.8% respectively. (Table 2)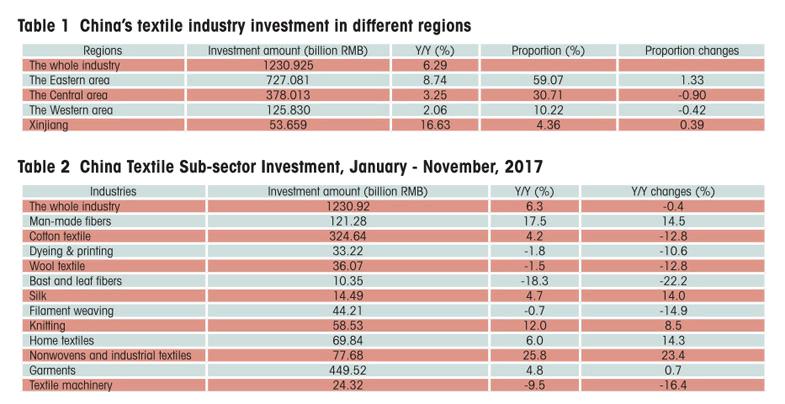
Steady improvement in performance
In the first eleven months of 2017, the profit margin of the textile industry was 5.26%, up 0.13% from the same period of the previous year, and the profitability of the industry increased. The main revenue of one hundred yuan was 88.49 yuan, a decrease of 0.1% year on year and a slightly increase in cost control; asset-liability ratio was 51.8%, down 0.22 percentage point from the same period of the previous year, and achieved some success through deleveraging. (Table 3)
From the perspective of sub-sectors, the profit growth of chemical fiber, filament yarn weaving and textile machinery industry witnessed remarkable growth. The profit growth of cotton spinning, bast fiber spinning and technical textile industries declined. The profit growth of chemical fiber industry accounted for 50.7% of the total. (Fig. 4)
Differentiation in different sectors of the industrys internal industrial chain is relatively significant: from January to November 2017, the profit margin of Chinas textile industry increased by 0.13 percentage point. Among them, the profit margin of chemical fiber, filament weaving and textile machinery industries increased significantly, with respective profit margins of 5.30%, 4.94% and 6.90%; the profitability of cotton spinning, bast fiber spinning and technical textile industries saw somewhat decline over the same period of the previous year, with profit margins of 4.64%, 4.17% and 5.63% respectively. (Fig. 5)endprint
杂志排行

China Textile的其它文章
- 数据
- Hong Kong exhibitor debuts International star’s accessory collection
- ISPO Beijing 2018 reflects the great potential of the Chinese sporting goods industry
- It might not sound sexy,but AI & AR are what’s hot in retail
- Newness has put denim back in the saddle again
- The main force driving forwards Chinese luxury market